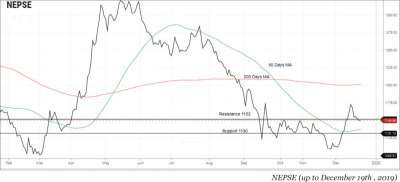
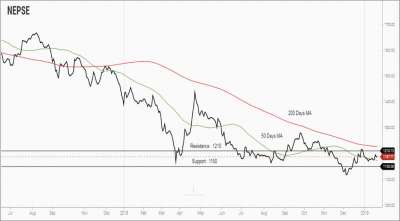
NEPSE index gained 39.57 points (or up 3.56 %) to close at 1149.65 last month. Last month 50 days moving average of NEPSE was crossed from below which showed short term bull. However, NEPSE is . . . Read more »
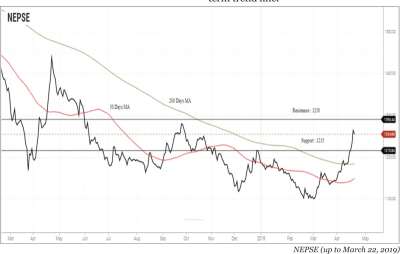
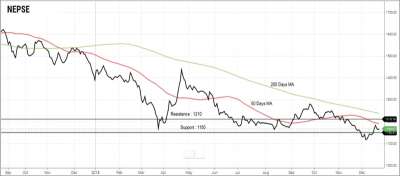
NEPSE gained 116.34 points (or up 10.20%) to close at 1250.94 last month that ended on April 22. Last month, NEPSE showed a bullish momentum breaking the resistance level of 200 days moving average. . . . Read more »
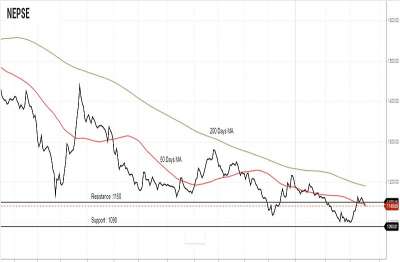
NEPSE gained 38.04 points (or up 3.45%) to close at 1140.6 last month. At the beginning of month, NEPSE showed a bullish momentum breaking the resistance level of 50 days moving . . . Read more »
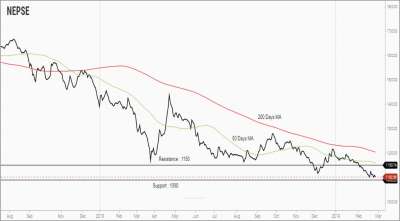
NEPSE index lost 85.21 points (or down 7.17%) to close at 1102.56 last month. Currently, NEPSE is trading below the 200 days moving average. At the beginning of the month, NEPSE breached the support . . . Read more »
NEPSE index gained 21.8 (or up 1.87%) to close at 1187.77 last month. At the beginning of last month, NEPSE index showed bullish momentum by breaching the resistance of 50 days moving average. . . . Read more »
NEPSE index lost 15.27 (or down 1.293%) to close at 1165.97 last month. Currently, the index is trading below the 50 days moving average and 200 days moving average. During the course of last month, . . . Read more »
NEPSE index lost 59.70 (or down 4.81%) to close at 1181.41 last month. Currently, the index is trading below the 50 days moving average and 200 days moving average. NEPSE breached the support level of 50 days moving . . . Read more »
NEPSE index lost 36.63 (or down 2.867%) to close at 1241.11 last month. Currently, the index is trading above the 50 days moving average. However, the index is still moving below 200 days moving . . . Read more »
NEPSE index experienced high volatility in the course of last month. It gained 102.02 (or up 8.68%) to close at 1277.74 last month. Currently, the index is trading above 50 days moving average. However, the index is still moving below 200-day moving average. . . . Read more »
Nepse index lost 3.16 points (or down0.27%) to close at 1178.5 last month. The index continues to trade below50-day moving average and 200-day moving average indicating bearish momentum in the market. The average volume turnover decreased to Rs 22.51crores from Rs 29.66 crores the month . . . Read more »
The benchmark index declined in the course of last month. Nepse decreased by 36.80 points (or down 3.02%) to close at 1181.66. The index continues to trade below 50-day moving average and 200-day moving average indicating bearish momentum in the . . . Read more »
The benchmark index declined in the course of last month. Nepse decreased by 99.76 points (or down 7.57%) to close at 1218.46. The index breached 50-day moving average and still trading below 200-day moving average indicating bearish momentum in the market. . . . Read more »
The benchmark index declined in the course of last month. Nepse decreased by 76.64 points (or down 4.90%) to close at 1318.22.The index moved towards 50-day moving average and still remains below the 200-day moving average. . . . Read more »
The benchmark index surged up in the course of last month. Nepse increased by a staggering 163.79 points (or up 12.97%) to close at 1394.86. The index crossed above the 50-day moving average, giving a bullish signal. However, the index still remains below the 200-day MA. New investors entering the market, as well as optimism regarding the implementation of online trading platform, has created this bullish trigger. . . . Read more »
The benchmark index continued its downfall in the course of last month. Nepse declined by a staggering 115.97 points (or down 11.78%) to close at 1231.01. The index moving below the 50-day and the 200-day moving average indicates bearish momentum in the market. . . . Read more »
The benchmark index continued its downfall in the course of last month. Nepse declined by 15.11 points (or down 1.02%) to close at 1386.98. The index moving below the 50-day and the 200-day moving average indicates bearish momentum in the . . . Read more »
The benchmark index fell by 70.06 points (or down 4.75%) to close at 1402.09 last month. The index continued to move below the 50-day and the 200-day moving average, indicating a bearish momentum in the market. The market will likely remain bearish as the banks continue to face liquidity . . . Read more »
The benchmark index fell by 21.14 points (or down 1.38%) to close at 1472.15 last month. The index has moved below the 50-day, as well as 200-day moving average, giving a bearish signal. Completion of the election at the beginning of the month did little to create bullish sentiment in the . . . Read more »
The benchmark index fell by 75.06 points (or down 4.83%) to close at 1493.29 last month. The index is hovering below the 50-day, as well as the 200-day moving average. This shows the market to be in a bearish mode in the course of last . . . Read more »
The benchmark index gained a modest 24.65 points (or up 1.67%) to close at 1568.35 last month. The index continues to move close to the 200-day moving average, which acts as a support level to the index. Favorable political outlook has triggered a bullish sentiment in the market. . . . Read more »
The benchmark index lost 67.87 points (or down 4.20%) to close at 1543.7 last month. The index fell below the 50-day, as well as 200-day moving average, which shows bearish sentiment in the . . . Read more »
The benchmark index lost 17.51 points (or down 1.06%) to close at 1611.57 last month. The index remains above the 50-day, as well as 200 day moving average, signaling the market to be bullish. However, Nepse hovering close to the 50-day MA will test the respective MA for support . . . Read more »
The benchmark index gained 69.59 points (or up 4.44%) to close at 1629.08 last month. Events such as release of monetary policy and talks regarding online trading system were witnessed in the course of last month. . . . Read more »
The benchmark index continued to fall in the course of last month. It declined by 70.09 points (or down -4.32%) last month to close at 1559.49. The index fell below the 50-day, as well as the 200-day moving average, giving a bearish . . . Read more »
The benchmark index declined from 1670.3 to 1629.58 in the course of last month. Its new support and resistance level stands at 1612 and 1780 level respectively. With no new bullish trigger, the index will likely test the new support . . . Read more »
The benchmark index continued its bullish run in the course of last month. Nepse gained 138.55 points (or up 9.08%) to close at 1672.38. Several factors supported the bullish momentum in the market. Positive political state of affairs, as well as Insurance Board’s directive to increase insurance . . . Read more »
The benchmark index experienced a remarkable climb in the course of last month. The index gained a staggering 176.26 points (or up 12.44%) to close at 1533.83. Gradual decrease in interest rates and positive hopes for political scenario seems to have caused a bullish trigger in the market. . . . Read more »
The benchmark index took a bearish ride at the beginning of last month, dropping as low as 1252.5 level. In the course of the month, Nepse lost a staggering 104.99 points (or down -6.93%) to close at 1357.57. Uncertain political environment and higher fixed deposit rate by the banks continues to create bearish sentiment in the . . . Read more »
The benchmark indexcontinued to decline in the course of last month. The index lost 12.85 points (or down 0.87%) to close at 1462.56. Nepse continues to hover below the 200-day moving . . . Read more »
The benchmark index experienced high volatility and bearish downturn in the course of last month. The index lost a staggering 151.38 points (or down 8.60%) to close at 1608.33. . . . Read more »
The benchmark index climbed up during the first half of last month. However, it took a U-turn during the second half of the month, indicating a bearish presence in the market. The index lost 7.2 points (or down 0.34%) last month to close at 1759.71. . . . Read more »
The benchmark index experienced a bullish run during the first half of last month. However, the second half of the month was triggered by a bearish momentum. Nepse gained 36.29 points (or up 2.12%) last month to close at 1766.91. . . . Read more »
The benchmark index went through high volatility last month. The index lost a staggering 147.31 points (or down -7.72%) to close at 1730.62. Nepse lost 202.02 points during the first half of the month. The index hit a negative, as well as positive circuit break during the middle of the month, as nervousness became apparent in the market. . . . Read more »
The benchmark index saw tremendous growth in the course of last month. The index gained 165.09 points (or up 7.86%) to close at 1877.93. Various policies and economic scenarios have supported the bullish sentiment in the . . . Read more »
The benchmark index created history by breaking the 1600 and 1700 mark in the course of last month. The index gained a staggering 197.65 points (or up 12.34%) to close at 1721.77. The Insurance and Hydropower sectors have caused the market to climb further . . . Read more »
The benchmark index continues to create new heights as the bullish momentum is driving the market upward. The index gained 59.21 points (or up 4.01%) to close at 1524.12 in the course of last month. The market did correct itself during the course of the week. . . . Read more »
The benchmark index continued its upward climb last month as well. Nepse index gained 87.58 points (or up 6.21%) to close at an all time height of 1464.91. The index witnessed some corrections at the beginning of the month, as it declined by 25.79 . . . Read more »
The benchmark index scaled up further in the course of last month. Nepse index gained a staggering 67.41 points (or up 5.43%) to close at 1283.52. The index is moving well above the 50-day moving average (MA) and 200-day MA, indicating that the overall market outlook looks . . . Read more »
The benchmark index increased further in the course of last month. The Nepse index gained a staggering 79.08 points (or up 6.77%) to close at 1216.11. Few reasons have caused the market to be bullish last month. Firstly, the bullish momentum was triggered by an increase in the demand in the insurance . . . Read more »
or the first half of the month, the benchmark index moved sideways, hovering above its immediate support level of 1084. The index then reached a high level of 1109. However, for the second half of the month the index spiraled downwards, losing 48.03 points (or down . . . Read more »
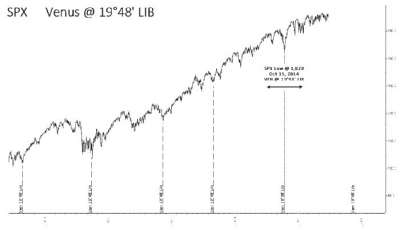
You will see every time when the planet Venus travels the sign of Libra at 19.48 degree, the S&P makes an important low there. Not once or twice or thrice, but in year 2010, 2011, 2012, 2013 and 2014 . . . Read more »
Gold is ruled by the planet Sun and the sign Leo. When a benefic planet transits Leo and at the same time casts good aspects to the Sun or when it casts a good aspect to Leo from other signs the value of gold rises. . . . Read more »
The secondary market touched the historic high during the review period ahead of the promulgation of the long awaited new constitution. But after the constitution was promulgated, it shed some of the gains and remains flat then after. . . . Read more »
Nepse index followed a sideways movement for most of last month. The benchmark index tested the 1200 mark three times in the course of previous month. On 15th September, Nepse reached its all time high of 1205.84 level. The current trend shows Nepse to be falling faintly, creating lower low in the support zone. . . . Read more »
This trade is probably the most awaited trade of 2015. The entire world is anxious to know when the US stock indices are going to stop their unstoppable bull rally which started in . . . Read more »
Nepal’s Capital Market set the history’s new high during the review period as positive sentiments towards banking stocks led all the sectors. The benchmark Nepse index touched 1200.92 adding 197.54 points in the review period while the session’s low was at the opening (23 July) with . . . Read more »
Nepse witnessed remarkable gains in the course of last month. The benchmark index rose by 197.54 points (or up 18.31%). It surpassed its previous resistance levels of 1036.98 and 1100 points and is moving well above the 50-day and 200-day moving average, and at a much higher rate, indicating a bullish . . . Read more »
In our article, “Millionaires don’t use astrology but billionaires do” written on March 31 2015 and published in the May, 2015 issue of New Business Age we forecasted that: . . . Read more »
As the earthquake has destroyed property and hampered trade, consumption, investment and living patterns of the people, business activities have been hampered. However, the exact loss can be assesses only after the coming quarterly reports of the listed . . . Read more »
In US stock market history, so far we have seen three big crashes. The first crash was on 28th October 1929, followed by the second on 19th October 1987 and the last crash was on 6th October . . . Read more »
Before investing in the secondary market, take a breather and evaluate yourself. What is your type? Are you an investor or a . . . Read more »
The aftermath of the earthquake caused Nepse index to fall by 10.70%. Nevertheless, the index increased soon enough, rising by 15.43% halfway through last month. Currently, Nepse is at a correction . . . Read more »
Most of the stocks turned red during the review period (Feb 18 - March 19) pushing the index to nearly two months low. The Nepse index closed in red losing 15.03 points or 1.53% to settle at 967.62. The index touched highest level on 9 March with 988.77 and the lowest was 959.14 on 16 March. . . . Read more »
RSI is a form of leading indicator that is believed to be most effective during periods of sideways movement. Such indicators may create numerous buy and sell signals that are useful when the market is not clearly trending upwards or downwards. . . . Read more »
Most of the stocks turned red during the review period (Feb 18 - March 19) pushing the index to nearly two months low. The Nepse index closed in red losing 15.03 points or 1.53% to settle at 967.62. The index touched highest level on 9 March with 988.77 and the lowest was 959.14 on 16 March. . . . Read more »
Nepse has not made much improvement in the past 30 days as compared to the growth witnessed in the previous months. Nepse decreased by -19.43 points (or -1.95%) to close at 967.62 points. It fell below its support level of 972.17, which is now its new resistance level. . . . Read more »
The secondary market of Nepal stalled after reaching nearly six months high while political uncertainties compelled the investors to wait-and-watch. The benchmark Nepse index added 7.20 points or 0.74 per cent to rest at 982.62. . . . Read more »
After the huge gains witnessed in the previous periods, Nepse remained almost flat during the past 30 days. However, there was an overall positive gain in the market as Nepse increased by 7.2 points (or 0.74%) to close at 982.65 . . . Read more »
Nepal’s secondary market turned little green with hopes that agreement between major political parties on contentious issues of new constitution was underway. The Nepse index accelerated 66.19 points or 7.38 per cent to close at 962.80. . . . Read more »
Giving continuity to the previous period’s positive momentum, Nepse has been able to make remarkable gains during this period. The stock market moved past its strong resistance level of 938.41 to close at 962.8 points – an increase of 58.91 points or 6.52 per . . . Read more »
Most of the listed companies have declared their dividends and few others are about to make these announcements. This means that the price adjustment of the stock after dividend declaration has also played role in driving the prices lower for such few companies. . . . Read more »
There was significant sideways movement in Nepse in the period between Nov 21, 2014 and Dec 20, 2014. The immediate support level of 844.42 was tested three times while the imme-diate resistance level of 875.56 was tested once in the review . . . Read more »
The stock market of Nepal plunged to 6 months low in the review period as gloomy political winter cooled investors’ sentiment. The Nepse index lost 61.84 points or 6.69% to rest at 862.5 while the session’s high was on 27 Oct with 935.01 and lowest was on 18 Nov with 844.06. . . . Read more »
Since Nepse peaked at 1083.55 points on July 21, 2014, the stock market has been following a bearish pattern. Though the markets stabilized and saw a 2.88% rebound during the last trading period, overall Nepse has continued its downward . . . Read more »
Ups and downs in the indicators of the stock market are a regular phenomenon. The market goes up when more investors exercise for buying stocks and slips down when more investors are in the mood to sell their shares. If they quickly want to exit from the . . . Read more »
The Nepali stock market remained stable during the review period despite the recent sharp fall. The benchmark Nepse index added 3.71 points or 0.40% to reach 923.59 while the session’s high was on 30 September with 937.99 and lowest was on 22 September with 881.87. . . . Read more »
After two continuous trading periods of huge declines, Nepse has stabilized in recent times. Compared to the previous period, Nepse made an upward gain of 25.96 points (or 2.88%) closing at 925.85 points. . . . Read more »
Historically stock exchanges started as a mutually governed, non-profit making, self-regulated cooperative like structures. Mostly brokers were the owners of such exchanges. However, due to the change in the technology and the concept of securities commission as apex . . . Read more »
The Nepali bourse cooled down after reaching a high of 1083.55 as selling pressure ruled the market. The benchmark Nepse index plummeted 61.35 points or 5.71% to close at 1013.6 while session’s high was on 21st July with 1083.55 and lowest on 18th August with 1013.25. . . . Read more »
On the first trading day of the review period the secondary market had witnessed the highest rise as the benchmark index settled at 1083.55 points, a new high since the last 6 years. On the same day Nepse had attained the highest turnover of NPR 1.20 billion on a single trading day in its . . . Read more »
Notice (8): Undefined index: MagazineIssue [APP/View/MagazineArticles/category.ctp, line 86]Code Context<div class="category"><span class="label label-danger"><?php echo $this->Html->link($issue_title['MagazineIssue']['title'],$viewFile = '/var/www/html/newbusinessage.com/app/View/MagazineArticles/category.ctp' $dataForView = array( 'current_user' => null, 'logged_in' => false ) $current_user = null $logged_in = false $cat_id = '63' $magazineArticles = array( (int) 0 => array( 'MagazineArticle' => array( 'id' => '2742', 'magazine_issue_id' => '1006', 'magazine_category_id' => '63', 'title' => 'Monthly Technical Analysis (November 24th -December 19th 2019)', 'image' => '20201010020410_Clipboard30.jpg', 'short_content' => 'NEPSE index gained 39.57 points (or up 3.56 %) to close at 1149.65 last month. Last month 50 days moving average of NEPSE was crossed from below which showed short term bull. However, NEPSE is trading below 200 days moving average which shows that overall long term sentiment is still bearish.', 'status' => true, 'publish_date' => null ) ), (int) 1 => array( 'MagazineArticle' => array( 'id' => '2508', 'magazine_issue_id' => '998', 'magazine_category_id' => '63', 'title' => 'Monthly Technical Analysis of Nepse March 24th 2019 – April 22th 2019', 'image' => '20190511100832_Clipboard24.jpg', 'short_content' => 'NEPSE gained 116.34 points (or up 10.20%) to close at 1250.94 last month that ended on April 22. Last month, NEPSE showed a bullish momentum breaking the resistance level of 200 days moving average. Currently, NEPSE is trading above the 50 days moving average and 200 days moving average. The average daily volume turnover has increased to NPR 53.01 crores from NPR 30.26 crores', 'status' => true, 'publish_date' => null ) ), (int) 2 => array( 'MagazineArticle' => array( 'id' => '2464', 'magazine_issue_id' => '997', 'magazine_category_id' => '63', 'title' => 'Monthly Technical Analysis of Nepse (February 27th 2019 – March 21th 2019)', 'image' => '20190403054014_1111.jpg', 'short_content' => 'NEPSE gained 38.04 points (or up 3.45%) to close at 1140.6 last month. At the beginning of month, NEPSE showed a bullish momentum breaking the resistance level of 50 days moving average.', 'status' => true, 'publish_date' => null ) ), (int) 3 => array( 'MagazineArticle' => array( 'id' => '2429', 'magazine_issue_id' => '996', 'magazine_category_id' => '63', 'title' => 'Monthly Technical Analysis of Nepse (January 26rd 2019 – February 16th 2019)', 'image' => '20190307122140_Clipboard04.jpg', 'short_content' => 'NEPSE index lost 85.21 points (or down 7.17%) to close at 1102.56 last month. Currently, NEPSE is trading below the 200 days moving average. At the beginning of the month, NEPSE breached the support level of 50 days moving average and traded below the 50 days moving average. ', 'status' => true, 'publish_date' => null ) ), (int) 4 => array( 'MagazineArticle' => array( 'id' => '2403', 'magazine_issue_id' => '995', 'magazine_category_id' => '63', 'title' => 'Monthly Technical Analysis of Nepse (December 23rd 2018 – January 17th 2019)', 'image' => '20190215124248_Clipboard07.jpg', 'short_content' => 'NEPSE index gained 21.8 (or up 1.87%) to close at 1187.77 last month. At the beginning of last month, NEPSE index showed bullish momentum by breaching the resistance of 50 days moving average. However, NEPSE index could not breach the 200 days moving average and retraced back forming a shooting star candle. Currently, NEPSE is trading above 50 days moving average and below 200 days moving says average.', 'status' => true, 'publish_date' => null ) ), (int) 5 => array( 'MagazineArticle' => array( 'id' => '2359', 'magazine_issue_id' => '993', 'magazine_category_id' => '63', 'title' => 'Monthly Technical Analysis of Nepse (November 25, 2018 – December 20, 2018)', 'image' => '20190110065454_Clipboard10.jpg', 'short_content' => 'NEPSE index lost 15.27 (or down 1.293%) to close at 1165.97 last month. Currently, the index is trading below the 50 days moving average and 200 days moving average. During the course of last month, NEPSE index breached the support level of 1150, reached the low level of 1120.84 forming a spinning bottom and bounced back to close at 1165.97.', 'status' => true, 'publish_date' => '2019-01-10' ) ), (int) 6 => array( 'MagazineArticle' => array( 'id' => '2325', 'magazine_issue_id' => '992', 'magazine_category_id' => '63', 'title' => 'Monthly Technical Analysis of Nepse (October 26, 2018 – November 22, 2018)', 'image' => null, 'short_content' => 'NEPSE index lost 59.70 (or down 4.81%) to close at 1181.41 last month. Currently, the index is trading below the 50 days moving average and 200 days moving average. NEPSE breached the support level of 50 days moving average.', 'status' => true, 'publish_date' => '0000-00-00' ) ), (int) 7 => array( 'MagazineArticle' => array( 'id' => '2294', 'magazine_issue_id' => '991', 'magazine_category_id' => '63', 'title' => 'Monthly Technical Analysis of Nepse (September 26th 2018 – October 25th 2018)', 'image' => null, 'short_content' => 'NEPSE index lost 36.63 (or down 2.867%) to close at 1241.11 last month. Currently, the index is trading above the 50 days moving average. However, the index is still moving below 200 days moving average.', 'status' => true, 'publish_date' => '0000-00-00' ) ), (int) 8 => array( 'MagazineArticle' => array( 'id' => '2264', 'magazine_issue_id' => '990', 'magazine_category_id' => '63', 'title' => 'Monthly Technical Analysis of Nepse (August 26th 2018 – September 26th 2018)', 'image' => null, 'short_content' => 'NEPSE index experienced high volatility in the course of last month. It gained 102.02 (or up 8.68%) to close at 1277.74 last month. Currently, the index is trading above 50 days moving average. However, the index is still moving below 200-day moving average. ', 'status' => true, 'publish_date' => '0000-00-00' ) ), (int) 9 => array( 'MagazineArticle' => array( 'id' => '2232', 'magazine_issue_id' => '989', 'magazine_category_id' => '63', 'title' => 'Monthly Technical Analysis of Nepse (July 22nd 2018 - August 23rd 2018)', 'image' => null, 'short_content' => 'Nepse index lost 3.16 points (or down0.27%) to close at 1178.5 last month. The index continues to trade below50-day moving average and 200-day moving average indicating bearish momentum in the market. The average volume turnover decreased to Rs 22.51crores from Rs 29.66 crores the month prior.', 'status' => true, 'publish_date' => '0000-00-00' ) ), (int) 10 => array( 'MagazineArticle' => array( 'id' => '2220', 'magazine_issue_id' => '988', 'magazine_category_id' => '63', 'title' => 'Monthly Technical Analysis of Nepse (June 24th 2018 - July 22th 2018)', 'image' => null, 'short_content' => 'The benchmark index declined in the course of last month. Nepse decreased by 36.80 points (or down 3.02%) to close at 1181.66. The index continues to trade below 50-day moving average and 200-day moving average indicating bearish momentum in the market.', 'status' => true, 'publish_date' => '0000-00-00' ) ), (int) 11 => array( 'MagazineArticle' => array( 'id' => '2171', 'magazine_issue_id' => '987', 'magazine_category_id' => '63', 'title' => 'Monthly Technical Analysis of Nepse (May25th 2018 - June 21th 2018)', 'image' => null, 'short_content' => 'The benchmark index declined in the course of last month. Nepse decreased by 99.76 points (or down 7.57%) to close at 1218.46. The index breached 50-day moving average and still trading below 200-day moving average indicating bearish momentum in the market. ', 'status' => true, 'publish_date' => '0000-00-00' ) ), (int) 12 => array( 'MagazineArticle' => array( 'id' => '2147', 'magazine_issue_id' => '986', 'magazine_category_id' => '63', 'title' => 'Monthly Technical Analysis of Nepse (April 25th 2018 - May 24th 2018)', 'image' => null, 'short_content' => 'The benchmark index declined in the course of last month. Nepse decreased by 76.64 points (or down 4.90%) to close at 1318.22.The index moved towards 50-day moving average and still remains below the 200-day moving average. ', 'status' => true, 'publish_date' => '0000-00-00' ) ), (int) 13 => array( 'MagazineArticle' => array( 'id' => '2110', 'magazine_issue_id' => '985', 'magazine_category_id' => '63', 'title' => 'Monthly Technical Analysis of Nepse (March 22nd 2018 – April 24th 2018)', 'image' => null, 'short_content' => 'The benchmark index surged up in the course of last month. Nepse increased by a staggering 163.79 points (or up 12.97%) to close at 1394.86. The index crossed above the 50-day moving average, giving a bullish signal. However, the index still remains below the 200-day MA. New investors entering the market, as well as optimism regarding the implementation of online trading platform, has created this bullish trigger. ', 'status' => true, 'publish_date' => '0000-00-00' ) ), (int) 14 => array( 'MagazineArticle' => array( 'id' => '2089', 'magazine_issue_id' => '984', 'magazine_category_id' => '63', 'title' => 'Monthly Technical Analysis of Nepse (25 February to 21 March 2018)', 'image' => null, 'short_content' => 'The benchmark index continued its downfall in the course of last month. Nepse declined by a staggering 115.97 points (or down 11.78%) to close at 1231.01. The index moving below the 50-day and the 200-day moving average indicates bearish momentum in the market. ', 'status' => true, 'publish_date' => '0000-00-00' ) ), (int) 15 => array( 'MagazineArticle' => array( 'id' => '2062', 'magazine_issue_id' => '983', 'magazine_category_id' => '63', 'title' => 'Monthly Technical Analysis of Nepse (23 January to 22 February 2018)', 'image' => null, 'short_content' => 'The benchmark index continued its downfall in the course of last month. Nepse declined by 15.11 points (or down 1.02%) to close at 1386.98. The index moving below the 50-day and the 200-day moving average indicates bearish momentum in the market.', 'status' => true, 'publish_date' => '0000-00-00' ) ), (int) 16 => array( 'MagazineArticle' => array( 'id' => '2035', 'magazine_issue_id' => '982', 'magazine_category_id' => '63', 'title' => 'Monthly Technical Analysis of Nepse (24 December 2017 to 22 January 2018)', 'image' => null, 'short_content' => 'The benchmark index fell by 70.06 points (or down 4.75%) to close at 1402.09 last month. The index continued to move below the 50-day and the 200-day moving average, indicating a bearish momentum in the market. The market will likely remain bearish as the banks continue to face liquidity crunch.', 'status' => true, 'publish_date' => '0000-00-00' ) ), (int) 17 => array( 'MagazineArticle' => array( 'id' => '2011', 'magazine_issue_id' => '981', 'magazine_category_id' => '63', 'title' => 'Monthly Technical Analysis of Nepse (26 November to 21 December 2017)', 'image' => null, 'short_content' => 'The benchmark index fell by 21.14 points (or down 1.38%) to close at 1472.15 last month. The index has moved below the 50-day, as well as 200-day moving average, giving a bearish signal. Completion of the election at the beginning of the month did little to create bullish sentiment in the market.', 'status' => true, 'publish_date' => '0000-00-00' ) ), (int) 18 => array( 'MagazineArticle' => array( 'id' => '1982', 'magazine_issue_id' => '980', 'magazine_category_id' => '63', 'title' => 'Monthly Technical Analysis of Nepse (22 October to 23 November 2017)', 'image' => null, 'short_content' => 'The benchmark index fell by 75.06 points (or down 4.83%) to close at 1493.29 last month. The index is hovering below the 50-day, as well as the 200-day moving average. This shows the market to be in a bearish mode in the course of last month.', 'status' => true, 'publish_date' => '0000-00-00' ) ), (int) 19 => array( 'MagazineArticle' => array( 'id' => '1950', 'magazine_issue_id' => '979', 'magazine_category_id' => '63', 'title' => 'Monthly Technical Analysis of Nepse (20 September to 18 October 2017)', 'image' => null, 'short_content' => 'The benchmark index gained a modest 24.65 points (or up 1.67%) to close at 1568.35 last month. The index continues to move close to the 200-day moving average, which acts as a support level to the index. Favorable political outlook has triggered a bullish sentiment in the market. ', 'status' => true, 'publish_date' => '0000-00-00' ) ), (int) 20 => array( 'MagazineArticle' => array( 'id' => '1933', 'magazine_issue_id' => '978', 'magazine_category_id' => '63', 'title' => 'Monthly Technical Analysis of Nepse (22 August to 18 September 2017)', 'image' => null, 'short_content' => 'The benchmark index lost 67.87 points (or down 4.20%) to close at 1543.7 last month. The index fell below the 50-day, as well as 200-day moving average, which shows bearish sentiment in the market.', 'status' => true, 'publish_date' => '0000-00-00' ) ), (int) 21 => array( 'MagazineArticle' => array( 'id' => '1897', 'magazine_issue_id' => '977', 'magazine_category_id' => '63', 'title' => 'Monthly Technical Analysis of Nepse (25 July to 21 August 2017)', 'image' => null, 'short_content' => 'The benchmark index lost 17.51 points (or down 1.06%) to close at 1611.57 last month. The index remains above the 50-day, as well as 200 day moving average, signaling the market to be bullish. However, Nepse hovering close to the 50-day MA will test the respective MA for support level.', 'status' => true, 'publish_date' => '0000-00-00' ) ), (int) 22 => array( 'MagazineArticle' => array( 'id' => '1866', 'magazine_issue_id' => '976', 'magazine_category_id' => '63', 'title' => ' Monthly Technical Analysis of Nepse (25 June to 24 July 2017)', 'image' => null, 'short_content' => 'The benchmark index gained 69.59 points (or up 4.44%) to close at 1629.08 last month. Events such as release of monetary policy and talks regarding online trading system were witnessed in the course of last month. ', 'status' => true, 'publish_date' => '0000-00-00' ) ), (int) 23 => array( 'MagazineArticle' => array( 'id' => '1848', 'magazine_issue_id' => '975', 'magazine_category_id' => '63', 'title' => 'Monthly Technical Analysis of Nepse (28 May to 22 June 2017)', 'image' => null, 'short_content' => 'The benchmark index continued to fall in the course of last month. It declined by 70.09 points (or down -4.32%) last month to close at 1559.49. The index fell below the 50-day, as well as the 200-day moving average, giving a bearish signal.', 'status' => true, 'publish_date' => '0000-00-00' ) ), (int) 24 => array( 'MagazineArticle' => array( 'id' => '1801', 'magazine_issue_id' => '974', 'magazine_category_id' => '63', 'title' => 'Monthly Technical Analysis of Nepse (26 April to 24 May 2017)', 'image' => null, 'short_content' => 'The benchmark index declined from 1670.3 to 1629.58 in the course of last month. Its new support and resistance level stands at 1612 and 1780 level respectively. With no new bullish trigger, the index will likely test the new support level', 'status' => true, 'publish_date' => '0000-00-00' ) ), (int) 25 => array( 'MagazineArticle' => array( 'id' => '1780', 'magazine_issue_id' => '973', 'magazine_category_id' => '63', 'title' => 'Monthly Technical Analysis of Nepse (27 March to 25 April 2017)', 'image' => null, 'short_content' => 'The benchmark index continued its bullish run in the course of last month. Nepse gained 138.55 points (or up 9.08%) to close at 1672.38. Several factors supported the bullish momentum in the market. Positive political state of affairs, as well as Insurance Board’s directive to increase insurance capital,', 'status' => true, 'publish_date' => '0000-00-00' ) ), (int) 26 => array( 'MagazineArticle' => array( 'id' => '1753', 'magazine_issue_id' => '972', 'magazine_category_id' => '63', 'title' => 'Monthly Technical Analysis of Nepse (22 February to 26 March 2017)', 'image' => null, 'short_content' => 'The benchmark index experienced a remarkable climb in the course of last month. The index gained a staggering 176.26 points (or up 12.44%) to close at 1533.83. Gradual decrease in interest rates and positive hopes for political scenario seems to have caused a bullish trigger in the market. ', 'status' => true, 'publish_date' => '0000-00-00' ) ), (int) 27 => array( 'MagazineArticle' => array( 'id' => '1732', 'magazine_issue_id' => '971', 'magazine_category_id' => '63', 'title' => 'Monthly Technical Analysis of Nepse (20 January to 21 February 2017)', 'image' => null, 'short_content' => 'The benchmark index took a bearish ride at the beginning of last month, dropping as low as 1252.5 level. In the course of the month, Nepse lost a staggering 104.99 points (or down -6.93%) to close at 1357.57. Uncertain political environment and higher fixed deposit rate by the banks continues to create bearish sentiment in the market.', 'status' => true, 'publish_date' => '0000-00-00' ) ), (int) 28 => array( 'MagazineArticle' => array( 'id' => '1702', 'magazine_issue_id' => '970', 'magazine_category_id' => '63', 'title' => 'Nepse in Consolidation Stage', 'image' => null, 'short_content' => 'The benchmark indexcontinued to decline in the course of last month. The index lost 12.85 points (or down 0.87%) to close at 1462.56. Nepse continues to hover below the 200-day moving ..', 'status' => true, 'publish_date' => '0000-00-00' ) ), (int) 29 => array( 'MagazineArticle' => array( 'id' => '1650', 'magazine_issue_id' => '968', 'magazine_category_id' => '63', 'title' => 'Monthly Technical Analysis of Nepse (3 November to 30 November 2016)', 'image' => null, 'short_content' => 'The benchmark index experienced high volatility and bearish downturn in the course of last month. The index lost a staggering 151.38 points (or down 8.60%) to close at 1608.33. ', 'status' => true, 'publish_date' => '0000-00-00' ) ), (int) 30 => array( 'MagazineArticle' => array( 'id' => '1623', 'magazine_issue_id' => '967', 'magazine_category_id' => '63', 'title' => 'Monthly Technical Analysis of Nepse (23 September to 27 October 2016)', 'image' => null, 'short_content' => 'The benchmark index climbed up during the first half of last month. However, it took a U-turn during the second half of the month, indicating a bearish presence in the market. The index lost 7.2 points (or down 0.34%) last month to close at 1759.71. ', 'status' => true, 'publish_date' => '0000-00-00' ) ), (int) 31 => array( 'MagazineArticle' => array( 'id' => '1598', 'magazine_issue_id' => '966', 'magazine_category_id' => '63', 'title' => 'Monthly Technical Analysis of Nepse (28 August to 22 September 2016)', 'image' => null, 'short_content' => 'The benchmark index experienced a bullish run during the first half of last month. However, the second half of the month was triggered by a bearish momentum. Nepse gained 36.29 points (or up 2.12%) last month to close at 1766.91. ', 'status' => true, 'publish_date' => '0000-00-00' ) ), (int) 32 => array( 'MagazineArticle' => array( 'id' => '1567', 'magazine_issue_id' => '965', 'magazine_category_id' => '63', 'title' => 'Monthly Technical Analysis of Nepse (31 July to 25 August 2016)', 'image' => null, 'short_content' => 'The benchmark index went through high volatility last month. The index lost a staggering 147.31 points (or down -7.72%) to close at 1730.62. Nepse lost 202.02 points during the first half of the month. The index hit a negative, as well as positive circuit break during the middle of the month, as nervousness became apparent in the market. ', 'status' => true, 'publish_date' => '0000-00-00' ) ), (int) 33 => array( 'MagazineArticle' => array( 'id' => '1543', 'magazine_issue_id' => '964', 'magazine_category_id' => '63', 'title' => 'Monthly Technical Analysis of Nepse (28 June to 28 July 2016)', 'image' => null, 'short_content' => 'The benchmark index saw tremendous growth in the course of last month. The index gained 165.09 points (or up 7.86%) to close at 1877.93. Various policies and economic scenarios have supported the bullish sentiment in the market.', 'status' => true, 'publish_date' => '0000-00-00' ) ), (int) 34 => array( 'MagazineArticle' => array( 'id' => '1531', 'magazine_issue_id' => '963', 'magazine_category_id' => '63', 'title' => ' Monthly Technical Analysis of Nepse (26 May to 27 June 2016)', 'image' => null, 'short_content' => 'The benchmark index created history by breaking the 1600 and 1700 mark in the course of last month. The index gained a staggering 197.65 points (or up 12.34%) to close at 1721.77. The Insurance and Hydropower sectors have caused the market to climb further up', 'status' => true, 'publish_date' => '0000-00-00' ) ), (int) 35 => array( 'MagazineArticle' => array( 'id' => '1505', 'magazine_issue_id' => '962', 'magazine_category_id' => '63', 'title' => 'Monthly Technical Analysis of Nepse (2 May to 25 May 2016)', 'image' => null, 'short_content' => 'The benchmark index continues to create new heights as the bullish momentum is driving the market upward. The index gained 59.21 points (or up 4.01%) to close at 1524.12 in the course of last month. The market did correct itself during the course of the week. ', 'status' => true, 'publish_date' => '0000-00-00' ) ), (int) 36 => array( 'MagazineArticle' => array( 'id' => '1481', 'magazine_issue_id' => '961', 'magazine_category_id' => '63', 'title' => 'Monthly Technical Analysis of Nepse (28 March to 28 April 2016)', 'image' => null, 'short_content' => 'The benchmark index continued its upward climb last month as well. Nepse index gained 87.58 points (or up 6.21%) to close at an all time height of 1464.91. The index witnessed some corrections at the beginning of the month, as it declined by 25.79 points.', 'status' => true, 'publish_date' => '0000-00-00' ) ), (int) 37 => array( 'MagazineArticle' => array( 'id' => '1449', 'magazine_issue_id' => '959', 'magazine_category_id' => '63', 'title' => ' Monthly Technical Analysis of Nepse (31 January to 25 February 2016)', 'image' => null, 'short_content' => 'The benchmark index scaled up further in the course of last month. Nepse index gained a staggering 67.41 points (or up 5.43%) to close at 1283.52. The index is moving well above the 50-day moving average (MA) and 200-day MA, indicating that the overall market outlook looks good.', 'status' => true, 'publish_date' => '0000-00-00' ) ), (int) 38 => array( 'MagazineArticle' => array( 'id' => '1432', 'magazine_issue_id' => '958', 'magazine_category_id' => '63', 'title' => ' Monthly Technical Analysis of Nepse (27 December, 2015 to 28 January 2016)', 'image' => null, 'short_content' => 'The benchmark index increased further in the course of last month. The Nepse index gained a staggering 79.08 points (or up 6.77%) to close at 1216.11. Few reasons have caused the market to be bullish last month. Firstly, the bullish momentum was triggered by an increase in the demand in the insurance sector.', 'status' => true, 'publish_date' => '0000-00-00' ) ), (int) 39 => array( 'MagazineArticle' => array( 'id' => '1380', 'magazine_issue_id' => '956', 'magazine_category_id' => '63', 'title' => 'Monthly Technical Analysis of Nepse (1 November to 26 November, 2015)', 'image' => null, 'short_content' => 'or the first half of the month, the benchmark index moved sideways, hovering above its immediate support level of 1084. The index then reached a high level of 1109. However, for the second half of the month the index spiraled downwards, losing 48.03 points (or down 4.43%).', 'status' => true, 'publish_date' => '0000-00-00' ) ), (int) 40 => array( 'MagazineArticle' => array( 'id' => '1363', 'magazine_issue_id' => '955', 'magazine_category_id' => '63', 'title' => 'Why S&P 500 is expected to make an important low on 26th November, 2015 at 13:43 NEWYORK TIME ?', 'image' => '20151125121943_st.jpg', 'short_content' => 'You will see every time when the planet Venus travels the sign of Libra at 19.48 degree, the S&P makes an important low there. Not once or twice or thrice, but in year 2010, 2011, 2012, 2013 and 2014 – five years in a row - it was right on the spot and the next date is 26th November,2015.', 'status' => true, 'publish_date' => '0000-00-00' ) ), (int) 41 => array( 'MagazineArticle' => array( 'id' => '1324', 'magazine_issue_id' => '954', 'magazine_category_id' => '63', 'title' => 'Forecasting Gold Prices with Astrology’s Help ', 'image' => null, 'short_content' => 'Gold is ruled by the planet Sun and the sign Leo. When a benefic planet transits Leo and at the same time casts good aspects to the Sun or when it casts a good aspect to Leo from other signs the value of gold rises. ', 'status' => true, 'publish_date' => '0000-00-00' ) ), (int) 42 => array( 'MagazineArticle' => array( 'id' => '1338', 'magazine_issue_id' => '954', 'magazine_category_id' => '63', 'title' => 'Market Gone Flat after Breaching Record (Review for 25 August to 24 September, 2015)', 'image' => null, 'short_content' => 'The secondary market touched the historic high during the review period ahead of the promulgation of the long awaited new constitution. But after the constitution was promulgated, it shed some of the gains and remains flat then after. ', 'status' => true, 'publish_date' => '0000-00-00' ) ), (int) 43 => array( 'MagazineArticle' => array( 'id' => '1346', 'magazine_issue_id' => '954', 'magazine_category_id' => '63', 'title' => 'Monthly Technical Analysis of Nepse (23 August to 24 September, 2015)', 'image' => null, 'short_content' => 'Nepse index followed a sideways movement for most of last month. The benchmark index tested the 1200 mark three times in the course of previous month. On 15th September, Nepse reached its all time high of 1205.84 level. The current trend shows Nepse to be falling faintly, creating lower low in the support zone. ', 'status' => true, 'publish_date' => '0000-00-00' ) ), (int) 44 => array( 'MagazineArticle' => array( 'id' => '1294', 'magazine_issue_id' => '953', 'magazine_category_id' => '63', 'title' => 'The Most Awaited Trade of 2015', 'image' => null, 'short_content' => 'This trade is probably the most awaited trade of 2015. The entire world is anxious to know when the US stock indices are going to stop their unstoppable bull rally which started in 2009.', 'status' => true, 'publish_date' => '0000-00-00' ) ), (int) 45 => array( 'MagazineArticle' => array( 'id' => '1312', 'magazine_issue_id' => '953', 'magazine_category_id' => '63', 'title' => 'Rise and Rise of Nepse (Review for 23 July to 20 August, 2015)', 'image' => null, 'short_content' => 'Nepal’s Capital Market set the history’s new high during the review period as positive sentiments towards banking stocks led all the sectors. The benchmark Nepse index touched 1200.92 adding 197.54 points in the review period while the session’s low was at the opening (23 July) with 1003.38.', 'status' => true, 'publish_date' => '0000-00-00' ) ), (int) 46 => array( 'MagazineArticle' => array( 'id' => '1313', 'magazine_issue_id' => '953', 'magazine_category_id' => '63', 'title' => 'Monthly Technical Analysis of Nepse (26 July to 20 August, 2015) ', 'image' => null, 'short_content' => 'Nepse witnessed remarkable gains in the course of last month. The benchmark index rose by 197.54 points (or up 18.31%). It surpassed its previous resistance levels of 1036.98 and 1100 points and is moving well above the 50-day and 200-day moving average, and at a much higher rate, indicating a bullish outlook.', 'status' => true, 'publish_date' => '0000-00-00' ) ), (int) 47 => array( 'MagazineArticle' => array( 'id' => '1265', 'magazine_issue_id' => '952', 'magazine_category_id' => '63', 'title' => 'Stay Alert from September 14 to October 14', 'image' => null, 'short_content' => 'In our article, “Millionaires don’t use astrology but billionaires do” written on March 31 2015 and published in the May, 2015 issue of New Business Age we forecasted that: ', 'status' => true, 'publish_date' => '0000-00-00' ) ), (int) 48 => array( 'MagazineArticle' => array( 'id' => '1244', 'magazine_issue_id' => '928', 'magazine_category_id' => '63', 'title' => 'Moving Sideways', 'image' => null, 'short_content' => 'As the earthquake has destroyed property and hampered trade, consumption, investment and living patterns of the people, business activities have been hampered. However, the exact loss can be assesses only after the coming quarterly reports of the listed companies.', 'status' => true, 'publish_date' => '0000-00-00' ) ), (int) 49 => array( 'MagazineArticle' => array( 'id' => '1245', 'magazine_issue_id' => '928', 'magazine_category_id' => '63', 'title' => 'Are We Ready for the Next Stock Market Crash?', 'image' => null, 'short_content' => 'In US stock market history, so far we have seen three big crashes. The first crash was on 28th October 1929, followed by the second on 19th October 1987 and the last crash was on 6th October 2008.', 'status' => true, 'publish_date' => '0000-00-00' ) ), (int) 50 => array( 'MagazineArticle' => array( 'id' => '1246', 'magazine_issue_id' => '928', 'magazine_category_id' => '63', 'title' => 'Smarten Your Approach to the Secondary Market', 'image' => null, 'short_content' => 'Before investing in the secondary market, take a breather and evaluate yourself. What is your type? Are you an investor or a trader?', 'status' => true, 'publish_date' => '0000-00-00' ) ), (int) 51 => array( 'MagazineArticle' => array( 'id' => '1247', 'magazine_issue_id' => '928', 'magazine_category_id' => '63', 'title' => 'Monthly Technical Analysis of Nepse (May 24 to June 23, 2015)', 'image' => null, 'short_content' => 'The aftermath of the earthquake caused Nepse index to fall by 10.70%. Nevertheless, the index increased soon enough, rising by 15.43% halfway through last month. Currently, Nepse is at a correction period.', 'status' => true, 'publish_date' => '0000-00-00' ) ), (int) 52 => array( 'MagazineArticle' => array( 'id' => '1193', 'magazine_issue_id' => '889', 'magazine_category_id' => '63', 'title' => '11.47 Points Fall Ahead of Q3 Results', 'image' => null, 'short_content' => 'Most of the stocks turned red during the review period (Feb 18 - March 19) pushing the index to nearly two months low. The Nepse index closed in red losing 15.03 points or 1.53% to settle at 967.62. The index touched highest level on 9 March with 988.77 and the lowest was 959.14 on 16 March. ', 'status' => true, 'publish_date' => '0000-00-00' ) ), (int) 53 => array( 'MagazineArticle' => array( 'id' => '1194', 'magazine_issue_id' => '889', 'magazine_category_id' => '63', 'title' => 'Monthly Technical Analysis of Nepse (March 19 to April 23, 2015) : At Lowest Volatility of the Year', 'image' => null, 'short_content' => 'RSI is a form of leading indicator that is believed to be most effective during periods of sideways movement. Such indicators may create numerous buy and sell signals that are useful when the market is not clearly trending upwards or downwards. ', 'status' => true, 'publish_date' => '0000-00-00' ) ), (int) 54 => array( 'MagazineArticle' => array( 'id' => '1166', 'magazine_issue_id' => '863', 'magazine_category_id' => '63', 'title' => 'Market @ Two Months’ Low', 'image' => null, 'short_content' => 'Most of the stocks turned red during the review period (Feb 18 - March 19) pushing the index to nearly two months low. The Nepse index closed in red losing 15.03 points or 1.53% to settle at 967.62. The index touched highest level on 9 March with 988.77 and the lowest was 959.14 on 16 March. ', 'status' => true, 'publish_date' => '0000-00-00' ) ), (int) 55 => array( 'MagazineArticle' => array( 'id' => '1167', 'magazine_issue_id' => '863', 'magazine_category_id' => '63', 'title' => 'Technical Analysis Monthly (February 19 to March 19, 2015) Bearish Signals', 'image' => null, 'short_content' => ' Nepse has not made much improvement in the past 30 days as compared to the growth witnessed in the previous months. Nepse decreased by -19.43 points (or -1.95%) to close at 967.62 points. It fell below its support level of 972.17, which is now its new resistance level. ', 'status' => true, 'publish_date' => '0000-00-00' ) ), (int) 56 => array( 'MagazineArticle' => array( 'id' => '1139', 'magazine_issue_id' => '839', 'magazine_category_id' => '63', 'title' => 'Nepse Slows Down', 'image' => null, 'short_content' => 'The secondary market of Nepal stalled after reaching nearly six months high while political uncertainties compelled the investors to wait-and-watch. The benchmark Nepse index added 7.20 points or 0.74 per cent to rest at 982.62. ', 'status' => true, 'publish_date' => '0000-00-00' ) ), (int) 57 => array( 'MagazineArticle' => array( 'id' => '1140', 'magazine_issue_id' => '839', 'magazine_category_id' => '63', 'title' => 'Technical Analysis Monthly (Jan 20, 14 – Feb 19, 15) : Bullish Signal for Long Term', 'image' => null, 'short_content' => 'After the huge gains witnessed in the previous periods, Nepse remained almost flat during the past 30 days. However, there was an overall positive gain in the market as Nepse increased by 7.2 points (or 0.74%) to close at 982.65 points.', 'status' => true, 'publish_date' => '0000-00-00' ) ), (int) 58 => array( 'MagazineArticle' => array( 'id' => '1108', 'magazine_issue_id' => '811', 'magazine_category_id' => '63', 'title' => 'Waiting for Confirmation Signal', 'image' => null, 'short_content' => 'Nepal’s secondary market turned little green with hopes that agreement between major political parties on contentious issues of new constitution was underway. The Nepse index accelerated 66.19 points or 7.38 per cent to close at 962.80. ', 'status' => true, 'publish_date' => '0000-00-00' ) ), (int) 59 => array( 'MagazineArticle' => array( 'id' => '1109', 'magazine_issue_id' => '811', 'magazine_category_id' => '63', 'title' => 'Technical Analysis Monthly (Dec 21, 2014 to Jan 20, 2015)', 'image' => null, 'short_content' => 'Giving continuity to the previous period’s positive momentum, Nepse has been able to make remarkable gains during this period. The stock market moved past its strong resistance level of 938.41 to close at 962.8 points – an increase of 58.91 points or 6.52 per cent.', 'status' => true, 'publish_date' => '0000-00-00' ) ), (int) 60 => array( 'MagazineArticle' => array( 'id' => '1064', 'magazine_issue_id' => '783', 'magazine_category_id' => '63', 'title' => 'Politics Still a Factor', 'image' => null, 'short_content' => 'Most of the listed companies have declared their dividends and few others are about to make these announcements. This means that the price adjustment of the stock after dividend declaration has also played role in driving the prices lower for such few companies. ', 'status' => true, 'publish_date' => '0000-00-00' ) ), (int) 61 => array( 'MagazineArticle' => array( 'id' => '1065', 'magazine_issue_id' => '783', 'magazine_category_id' => '63', 'title' => 'Technical Analysis Monthly (Nov 21 – Dec 20) : Fighting 916 Resistance', 'image' => null, 'short_content' => 'There was significant sideways movement in Nepse in the period between Nov 21, 2014 and Dec 20, 2014. The immediate support level of 844.42 was tested three times while the imme-diate resistance level of 875.56 was tested once in the review period.', 'status' => true, 'publish_date' => '0000-00-00' ) ), (int) 62 => array( 'MagazineArticle' => array( 'id' => '1036', 'magazine_issue_id' => '756', 'magazine_category_id' => '63', 'title' => 'Market Dips to 6 Months Low', 'image' => null, 'short_content' => 'The stock market of Nepal plunged to 6 months low in the review period as gloomy political winter cooled investors’ sentiment. The Nepse index lost 61.84 points or 6.69% to rest at 862.5 while the session’s high was on 27 Oct with 935.01 and lowest was on 18 Nov with 844.06. ', 'status' => true, 'publish_date' => '0000-00-00' ) ), (int) 63 => array( 'MagazineArticle' => array( 'id' => '1037', 'magazine_issue_id' => '756', 'magazine_category_id' => '63', 'title' => 'Technical Analysis Monthly (Oct 20 – Nov 20)', 'image' => null, 'short_content' => 'Since Nepse peaked at 1083.55 points on July 21, 2014, the stock market has been following a bearish pattern. Though the markets stabilized and saw a 2.88% rebound during the last trading period, overall Nepse has continued its downward trend', 'status' => true, 'publish_date' => '0000-00-00' ) ), (int) 64 => array( 'MagazineArticle' => array( 'id' => '1038', 'magazine_issue_id' => '756', 'magazine_category_id' => '63', 'title' => 'Ups and Downs in Nepali Stock Market', 'image' => null, 'short_content' => 'Ups and downs in the indicators of the stock market are a regular phenomenon. The market goes up when more investors exercise for buying stocks and slips down when more investors are in the mood to sell their shares. If they quickly want to exit from the market,', 'status' => true, 'publish_date' => '0000-00-00' ) ), (int) 65 => array( 'MagazineArticle' => array( 'id' => '992', 'magazine_issue_id' => '730', 'magazine_category_id' => '63', 'title' => 'Market Stalled after Losing Steam', 'image' => null, 'short_content' => 'The Nepali stock market remained stable during the review period despite the recent sharp fall. The benchmark Nepse index added 3.71 points or 0.40% to reach 923.59 while the session’s high was on 30 September with 937.99 and lowest was on 22 September with 881.87. ', 'status' => true, 'publish_date' => '0000-00-00' ) ), (int) 66 => array( 'MagazineArticle' => array( 'id' => '993', 'magazine_issue_id' => '730', 'magazine_category_id' => '63', 'title' => 'Monthly Technical Analysis of Nepse November 2014', 'image' => null, 'short_content' => 'After two continuous trading periods of huge declines, Nepse has stabilized in recent times. Compared to the previous period, Nepse made an upward gain of 25.96 points (or 2.88%) closing at 925.85 points. ', 'status' => true, 'publish_date' => '0000-00-00' ) ), (int) 67 => array( 'MagazineArticle' => array( 'id' => '994', 'magazine_issue_id' => '730', 'magazine_category_id' => '63', 'title' => 'Privatization, Corporatization and Strategic Partner for NEPSE', 'image' => null, 'short_content' => 'Historically stock exchanges started as a mutually governed, non-profit making, self-regulated cooperative like structures. Mostly brokers were the owners of such exchanges. However, due to the change in the technology and the concept of securities commission as apex regulator', 'status' => true, 'publish_date' => '0000-00-00' ) ), (int) 68 => array( 'MagazineArticle' => array( 'id' => '920', 'magazine_issue_id' => '678', 'magazine_category_id' => '63', 'title' => 'The Big Retreat', 'image' => null, 'short_content' => 'The Nepali bourse cooled down after reaching a high of 1083.55 as selling pressure ruled the market. The benchmark Nepse index plummeted 61.35 points or 5.71% to close at 1013.6 while session’s high was on 21st July with 1083.55 and lowest on 18th August with 1013.25. ', 'status' => true, 'publish_date' => '0000-00-00' ) ), (int) 69 => array( 'MagazineArticle' => array( 'id' => '921', 'magazine_issue_id' => '678', 'magazine_category_id' => '63', 'title' => 'Monthly Technical Analysis of Nepse (July 21 - August 14, 2014)', 'image' => null, 'short_content' => 'On the first trading day of the review period the secondary market had witnessed the highest rise as the benchmark index settled at 1083.55 points, a new high since the last 6 years. On the same day Nepse had attained the highest turnover of NPR 1.20 billion on a single trading day in its history.', 'status' => true, 'publish_date' => '0000-00-00' ) ), (int) 70 => array( 'MagazineArticle' => array( 'id' => '952', 'magazine_issue_id' => '704', 'magazine_category_id' => '63', 'title' => 'The End of Bull Run', 'image' => null, 'short_content' => 'The stock market of Nepal which was predicted to break the previous historic high level of 1175.38 points pulled back from 1083.55 and witnessed a nose dive sessions. ', 'status' => true, 'publish_date' => '0000-00-00' ) ), (int) 71 => array( 'MagazineArticle' => array( 'id' => '953', 'magazine_issue_id' => '704', 'magazine_category_id' => '63', 'title' => 'Monthly Technical Analysis of Nepse October 2014', 'image' => null, 'short_content' => 'Nepal Stock Exchange (Nepse) index continued spiralling downwards during the August 19 to September 18, 2014 period, just like the preceding period. During the review period, Nepse fell by 134.5 points (-13 per cent) to close at 899.89 points.', 'status' => true, 'publish_date' => '0000-00-00' ) ), (int) 72 => array( 'MagazineArticle' => array( 'id' => '954', 'magazine_issue_id' => '704', 'magazine_category_id' => '63', 'title' => 'NRN Investment through Capital Market', 'image' => null, 'short_content' => '‘Economic Roadmap for Prosperous Nepal’ was the main theme of 8th NRN regional conference held on Nagano, Japan from September 18 to 19. About three hundred NRNs had participated from different part of the globe to discuss on the given theme. ', 'status' => true, 'publish_date' => '0000-00-00' ) ), (int) 73 => array( 'MagazineArticle' => array( 'id' => '1405', 'magazine_issue_id' => '957', 'magazine_category_id' => '63', 'title' => 'Monthly Technical Analysis of Nepse (29 November to 24 December, 2015)', 'image' => null, 'short_content' => 'The benchmark index saw huge changes in the course of last month. Despite all the difficulties and political unrest in the country, Nepse gained a staggering 114.26 points (or up 11.17%) to close at 1137.03. It seems that the monetary policy is still playing a major role in causing the market to be bullish.', 'status' => true, 'publish_date' => '0000-00-00' ) ) ) $magazineCategory = array( 'MagazineCategory' => array( 'id' => '63', 'title' => 'Stock Taking', 'sortorder' => '516', 'status' => true, 'created' => '0000-00-00 00:00:00', 'homepage' => true, 'modified' => '2013-04-01 00:00:00' ) ) $magazineArticle = array( 'MagazineArticle' => array( 'id' => '952', 'magazine_issue_id' => '704', 'magazine_category_id' => '63', 'title' => 'The End of Bull Run', 'image' => null, 'short_content' => 'The stock market of Nepal which was predicted to break the previous historic high level of 1175.38 points pulled back from 1083.55 and witnessed a nose dive sessions. ', 'status' => true, 'publish_date' => '0000-00-00' ) ) $issue_title = array() $width = (int) 400 $height = (int) 230 $ratio = (float) 1.7391304347826 $img_width = (int) 160 $img_height = (float) 92include - APP/View/MagazineArticles/category.ctp, line 86 View::_evaluate() - CORE/Cake/View/View.php, line 971 View::_render() - CORE/Cake/View/View.php, line 933 View::render() - CORE/Cake/View/View.php, line 473 Controller::render() - CORE/Cake/Controller/Controller.php, line 968 Dispatcher::_invoke() - CORE/Cake/Routing/Dispatcher.php, line 200 Dispatcher::dispatch() - CORE/Cake/Routing/Dispatcher.php, line 167 [main] - APP/webroot/index.php, line 117
Notice (8): Trying to access array offset on value of type null [APP/View/MagazineArticles/category.ctp, line 86]Code Context<div class="category"><span class="label label-danger"><?php echo $this->Html->link($issue_title['MagazineIssue']['title'],$viewFile = '/var/www/html/newbusinessage.com/app/View/MagazineArticles/category.ctp' $dataForView = array( 'current_user' => null, 'logged_in' => false ) $current_user = null $logged_in = false $cat_id = '63' $magazineArticles = array( (int) 0 => array( 'MagazineArticle' => array( 'id' => '2742', 'magazine_issue_id' => '1006', 'magazine_category_id' => '63', 'title' => 'Monthly Technical Analysis (November 24th -December 19th 2019)', 'image' => '20201010020410_Clipboard30.jpg', 'short_content' => 'NEPSE index gained 39.57 points (or up 3.56 %) to close at 1149.65 last month. Last month 50 days moving average of NEPSE was crossed from below which showed short term bull. However, NEPSE is trading below 200 days moving average which shows that overall long term sentiment is still bearish.', 'status' => true, 'publish_date' => null ) ), (int) 1 => array( 'MagazineArticle' => array( 'id' => '2508', 'magazine_issue_id' => '998', 'magazine_category_id' => '63', 'title' => 'Monthly Technical Analysis of Nepse March 24th 2019 – April 22th 2019', 'image' => '20190511100832_Clipboard24.jpg', 'short_content' => 'NEPSE gained 116.34 points (or up 10.20%) to close at 1250.94 last month that ended on April 22. Last month, NEPSE showed a bullish momentum breaking the resistance level of 200 days moving average. Currently, NEPSE is trading above the 50 days moving average and 200 days moving average. The average daily volume turnover has increased to NPR 53.01 crores from NPR 30.26 crores', 'status' => true, 'publish_date' => null ) ), (int) 2 => array( 'MagazineArticle' => array( 'id' => '2464', 'magazine_issue_id' => '997', 'magazine_category_id' => '63', 'title' => 'Monthly Technical Analysis of Nepse (February 27th 2019 – March 21th 2019)', 'image' => '20190403054014_1111.jpg', 'short_content' => 'NEPSE gained 38.04 points (or up 3.45%) to close at 1140.6 last month. At the beginning of month, NEPSE showed a bullish momentum breaking the resistance level of 50 days moving average.', 'status' => true, 'publish_date' => null ) ), (int) 3 => array( 'MagazineArticle' => array( 'id' => '2429', 'magazine_issue_id' => '996', 'magazine_category_id' => '63', 'title' => 'Monthly Technical Analysis of Nepse (January 26rd 2019 – February 16th 2019)', 'image' => '20190307122140_Clipboard04.jpg', 'short_content' => 'NEPSE index lost 85.21 points (or down 7.17%) to close at 1102.56 last month. Currently, NEPSE is trading below the 200 days moving average. At the beginning of the month, NEPSE breached the support level of 50 days moving average and traded below the 50 days moving average. ', 'status' => true, 'publish_date' => null ) ), (int) 4 => array( 'MagazineArticle' => array( 'id' => '2403', 'magazine_issue_id' => '995', 'magazine_category_id' => '63', 'title' => 'Monthly Technical Analysis of Nepse (December 23rd 2018 – January 17th 2019)', 'image' => '20190215124248_Clipboard07.jpg', 'short_content' => 'NEPSE index gained 21.8 (or up 1.87%) to close at 1187.77 last month. At the beginning of last month, NEPSE index showed bullish momentum by breaching the resistance of 50 days moving average. However, NEPSE index could not breach the 200 days moving average and retraced back forming a shooting star candle. Currently, NEPSE is trading above 50 days moving average and below 200 days moving says average.', 'status' => true, 'publish_date' => null ) ), (int) 5 => array( 'MagazineArticle' => array( 'id' => '2359', 'magazine_issue_id' => '993', 'magazine_category_id' => '63', 'title' => 'Monthly Technical Analysis of Nepse (November 25, 2018 – December 20, 2018)', 'image' => '20190110065454_Clipboard10.jpg', 'short_content' => 'NEPSE index lost 15.27 (or down 1.293%) to close at 1165.97 last month. Currently, the index is trading below the 50 days moving average and 200 days moving average. During the course of last month, NEPSE index breached the support level of 1150, reached the low level of 1120.84 forming a spinning bottom and bounced back to close at 1165.97.', 'status' => true, 'publish_date' => '2019-01-10' ) ), (int) 6 => array( 'MagazineArticle' => array( 'id' => '2325', 'magazine_issue_id' => '992', 'magazine_category_id' => '63', 'title' => 'Monthly Technical Analysis of Nepse (October 26, 2018 – November 22, 2018)', 'image' => null, 'short_content' => 'NEPSE index lost 59.70 (or down 4.81%) to close at 1181.41 last month. Currently, the index is trading below the 50 days moving average and 200 days moving average. NEPSE breached the support level of 50 days moving average.', 'status' => true, 'publish_date' => '0000-00-00' ) ), (int) 7 => array( 'MagazineArticle' => array( 'id' => '2294', 'magazine_issue_id' => '991', 'magazine_category_id' => '63', 'title' => 'Monthly Technical Analysis of Nepse (September 26th 2018 – October 25th 2018)', 'image' => null, 'short_content' => 'NEPSE index lost 36.63 (or down 2.867%) to close at 1241.11 last month. Currently, the index is trading above the 50 days moving average. However, the index is still moving below 200 days moving average.', 'status' => true, 'publish_date' => '0000-00-00' ) ), (int) 8 => array( 'MagazineArticle' => array( 'id' => '2264', 'magazine_issue_id' => '990', 'magazine_category_id' => '63', 'title' => 'Monthly Technical Analysis of Nepse (August 26th 2018 – September 26th 2018)', 'image' => null, 'short_content' => 'NEPSE index experienced high volatility in the course of last month. It gained 102.02 (or up 8.68%) to close at 1277.74 last month. Currently, the index is trading above 50 days moving average. However, the index is still moving below 200-day moving average. ', 'status' => true, 'publish_date' => '0000-00-00' ) ), (int) 9 => array( 'MagazineArticle' => array( 'id' => '2232', 'magazine_issue_id' => '989', 'magazine_category_id' => '63', 'title' => 'Monthly Technical Analysis of Nepse (July 22nd 2018 - August 23rd 2018)', 'image' => null, 'short_content' => 'Nepse index lost 3.16 points (or down0.27%) to close at 1178.5 last month. The index continues to trade below50-day moving average and 200-day moving average indicating bearish momentum in the market. The average volume turnover decreased to Rs 22.51crores from Rs 29.66 crores the month prior.', 'status' => true, 'publish_date' => '0000-00-00' ) ), (int) 10 => array( 'MagazineArticle' => array( 'id' => '2220', 'magazine_issue_id' => '988', 'magazine_category_id' => '63', 'title' => 'Monthly Technical Analysis of Nepse (June 24th 2018 - July 22th 2018)', 'image' => null, 'short_content' => 'The benchmark index declined in the course of last month. Nepse decreased by 36.80 points (or down 3.02%) to close at 1181.66. The index continues to trade below 50-day moving average and 200-day moving average indicating bearish momentum in the market.', 'status' => true, 'publish_date' => '0000-00-00' ) ), (int) 11 => array( 'MagazineArticle' => array( 'id' => '2171', 'magazine_issue_id' => '987', 'magazine_category_id' => '63', 'title' => 'Monthly Technical Analysis of Nepse (May25th 2018 - June 21th 2018)', 'image' => null, 'short_content' => 'The benchmark index declined in the course of last month. Nepse decreased by 99.76 points (or down 7.57%) to close at 1218.46. The index breached 50-day moving average and still trading below 200-day moving average indicating bearish momentum in the market. ', 'status' => true, 'publish_date' => '0000-00-00' ) ), (int) 12 => array( 'MagazineArticle' => array( 'id' => '2147', 'magazine_issue_id' => '986', 'magazine_category_id' => '63', 'title' => 'Monthly Technical Analysis of Nepse (April 25th 2018 - May 24th 2018)', 'image' => null, 'short_content' => 'The benchmark index declined in the course of last month. Nepse decreased by 76.64 points (or down 4.90%) to close at 1318.22.The index moved towards 50-day moving average and still remains below the 200-day moving average. ', 'status' => true, 'publish_date' => '0000-00-00' ) ), (int) 13 => array( 'MagazineArticle' => array( 'id' => '2110', 'magazine_issue_id' => '985', 'magazine_category_id' => '63', 'title' => 'Monthly Technical Analysis of Nepse (March 22nd 2018 – April 24th 2018)', 'image' => null, 'short_content' => 'The benchmark index surged up in the course of last month. Nepse increased by a staggering 163.79 points (or up 12.97%) to close at 1394.86. The index crossed above the 50-day moving average, giving a bullish signal. However, the index still remains below the 200-day MA. New investors entering the market, as well as optimism regarding the implementation of online trading platform, has created this bullish trigger. ', 'status' => true, 'publish_date' => '0000-00-00' ) ), (int) 14 => array( 'MagazineArticle' => array( 'id' => '2089', 'magazine_issue_id' => '984', 'magazine_category_id' => '63', 'title' => 'Monthly Technical Analysis of Nepse (25 February to 21 March 2018)', 'image' => null, 'short_content' => 'The benchmark index continued its downfall in the course of last month. Nepse declined by a staggering 115.97 points (or down 11.78%) to close at 1231.01. The index moving below the 50-day and the 200-day moving average indicates bearish momentum in the market. ', 'status' => true, 'publish_date' => '0000-00-00' ) ), (int) 15 => array( 'MagazineArticle' => array( 'id' => '2062', 'magazine_issue_id' => '983', 'magazine_category_id' => '63', 'title' => 'Monthly Technical Analysis of Nepse (23 January to 22 February 2018)', 'image' => null, 'short_content' => 'The benchmark index continued its downfall in the course of last month. Nepse declined by 15.11 points (or down 1.02%) to close at 1386.98. The index moving below the 50-day and the 200-day moving average indicates bearish momentum in the market.', 'status' => true, 'publish_date' => '0000-00-00' ) ), (int) 16 => array( 'MagazineArticle' => array( 'id' => '2035', 'magazine_issue_id' => '982', 'magazine_category_id' => '63', 'title' => 'Monthly Technical Analysis of Nepse (24 December 2017 to 22 January 2018)', 'image' => null, 'short_content' => 'The benchmark index fell by 70.06 points (or down 4.75%) to close at 1402.09 last month. The index continued to move below the 50-day and the 200-day moving average, indicating a bearish momentum in the market. The market will likely remain bearish as the banks continue to face liquidity crunch.', 'status' => true, 'publish_date' => '0000-00-00' ) ), (int) 17 => array( 'MagazineArticle' => array( 'id' => '2011', 'magazine_issue_id' => '981', 'magazine_category_id' => '63', 'title' => 'Monthly Technical Analysis of Nepse (26 November to 21 December 2017)', 'image' => null, 'short_content' => 'The benchmark index fell by 21.14 points (or down 1.38%) to close at 1472.15 last month. The index has moved below the 50-day, as well as 200-day moving average, giving a bearish signal. Completion of the election at the beginning of the month did little to create bullish sentiment in the market.', 'status' => true, 'publish_date' => '0000-00-00' ) ), (int) 18 => array( 'MagazineArticle' => array( 'id' => '1982', 'magazine_issue_id' => '980', 'magazine_category_id' => '63', 'title' => 'Monthly Technical Analysis of Nepse (22 October to 23 November 2017)', 'image' => null, 'short_content' => 'The benchmark index fell by 75.06 points (or down 4.83%) to close at 1493.29 last month. The index is hovering below the 50-day, as well as the 200-day moving average. This shows the market to be in a bearish mode in the course of last month.', 'status' => true, 'publish_date' => '0000-00-00' ) ), (int) 19 => array( 'MagazineArticle' => array( 'id' => '1950', 'magazine_issue_id' => '979', 'magazine_category_id' => '63', 'title' => 'Monthly Technical Analysis of Nepse (20 September to 18 October 2017)', 'image' => null, 'short_content' => 'The benchmark index gained a modest 24.65 points (or up 1.67%) to close at 1568.35 last month. The index continues to move close to the 200-day moving average, which acts as a support level to the index. Favorable political outlook has triggered a bullish sentiment in the market. ', 'status' => true, 'publish_date' => '0000-00-00' ) ), (int) 20 => array( 'MagazineArticle' => array( 'id' => '1933', 'magazine_issue_id' => '978', 'magazine_category_id' => '63', 'title' => 'Monthly Technical Analysis of Nepse (22 August to 18 September 2017)', 'image' => null, 'short_content' => 'The benchmark index lost 67.87 points (or down 4.20%) to close at 1543.7 last month. The index fell below the 50-day, as well as 200-day moving average, which shows bearish sentiment in the market.', 'status' => true, 'publish_date' => '0000-00-00' ) ), (int) 21 => array( 'MagazineArticle' => array( 'id' => '1897', 'magazine_issue_id' => '977', 'magazine_category_id' => '63', 'title' => 'Monthly Technical Analysis of Nepse (25 July to 21 August 2017)', 'image' => null, 'short_content' => 'The benchmark index lost 17.51 points (or down 1.06%) to close at 1611.57 last month. The index remains above the 50-day, as well as 200 day moving average, signaling the market to be bullish. However, Nepse hovering close to the 50-day MA will test the respective MA for support level.', 'status' => true, 'publish_date' => '0000-00-00' ) ), (int) 22 => array( 'MagazineArticle' => array( 'id' => '1866', 'magazine_issue_id' => '976', 'magazine_category_id' => '63', 'title' => ' Monthly Technical Analysis of Nepse (25 June to 24 July 2017)', 'image' => null, 'short_content' => 'The benchmark index gained 69.59 points (or up 4.44%) to close at 1629.08 last month. Events such as release of monetary policy and talks regarding online trading system were witnessed in the course of last month. ', 'status' => true, 'publish_date' => '0000-00-00' ) ), (int) 23 => array( 'MagazineArticle' => array( 'id' => '1848', 'magazine_issue_id' => '975', 'magazine_category_id' => '63', 'title' => 'Monthly Technical Analysis of Nepse (28 May to 22 June 2017)', 'image' => null, 'short_content' => 'The benchmark index continued to fall in the course of last month. It declined by 70.09 points (or down -4.32%) last month to close at 1559.49. The index fell below the 50-day, as well as the 200-day moving average, giving a bearish signal.', 'status' => true, 'publish_date' => '0000-00-00' ) ), (int) 24 => array( 'MagazineArticle' => array( 'id' => '1801', 'magazine_issue_id' => '974', 'magazine_category_id' => '63', 'title' => 'Monthly Technical Analysis of Nepse (26 April to 24 May 2017)', 'image' => null, 'short_content' => 'The benchmark index declined from 1670.3 to 1629.58 in the course of last month. Its new support and resistance level stands at 1612 and 1780 level respectively. With no new bullish trigger, the index will likely test the new support level', 'status' => true, 'publish_date' => '0000-00-00' ) ), (int) 25 => array( 'MagazineArticle' => array( 'id' => '1780', 'magazine_issue_id' => '973', 'magazine_category_id' => '63', 'title' => 'Monthly Technical Analysis of Nepse (27 March to 25 April 2017)', 'image' => null, 'short_content' => 'The benchmark index continued its bullish run in the course of last month. Nepse gained 138.55 points (or up 9.08%) to close at 1672.38. Several factors supported the bullish momentum in the market. Positive political state of affairs, as well as Insurance Board’s directive to increase insurance capital,', 'status' => true, 'publish_date' => '0000-00-00' ) ), (int) 26 => array( 'MagazineArticle' => array( 'id' => '1753', 'magazine_issue_id' => '972', 'magazine_category_id' => '63', 'title' => 'Monthly Technical Analysis of Nepse (22 February to 26 March 2017)', 'image' => null, 'short_content' => 'The benchmark index experienced a remarkable climb in the course of last month. The index gained a staggering 176.26 points (or up 12.44%) to close at 1533.83. Gradual decrease in interest rates and positive hopes for political scenario seems to have caused a bullish trigger in the market. ', 'status' => true, 'publish_date' => '0000-00-00' ) ), (int) 27 => array( 'MagazineArticle' => array( 'id' => '1732', 'magazine_issue_id' => '971', 'magazine_category_id' => '63', 'title' => 'Monthly Technical Analysis of Nepse (20 January to 21 February 2017)', 'image' => null, 'short_content' => 'The benchmark index took a bearish ride at the beginning of last month, dropping as low as 1252.5 level. In the course of the month, Nepse lost a staggering 104.99 points (or down -6.93%) to close at 1357.57. Uncertain political environment and higher fixed deposit rate by the banks continues to create bearish sentiment in the market.', 'status' => true, 'publish_date' => '0000-00-00' ) ), (int) 28 => array( 'MagazineArticle' => array( 'id' => '1702', 'magazine_issue_id' => '970', 'magazine_category_id' => '63', 'title' => 'Nepse in Consolidation Stage', 'image' => null, 'short_content' => 'The benchmark indexcontinued to decline in the course of last month. The index lost 12.85 points (or down 0.87%) to close at 1462.56. Nepse continues to hover below the 200-day moving ..', 'status' => true, 'publish_date' => '0000-00-00' ) ), (int) 29 => array( 'MagazineArticle' => array( 'id' => '1650', 'magazine_issue_id' => '968', 'magazine_category_id' => '63', 'title' => 'Monthly Technical Analysis of Nepse (3 November to 30 November 2016)', 'image' => null, 'short_content' => 'The benchmark index experienced high volatility and bearish downturn in the course of last month. The index lost a staggering 151.38 points (or down 8.60%) to close at 1608.33. ', 'status' => true, 'publish_date' => '0000-00-00' ) ), (int) 30 => array( 'MagazineArticle' => array( 'id' => '1623', 'magazine_issue_id' => '967', 'magazine_category_id' => '63', 'title' => 'Monthly Technical Analysis of Nepse (23 September to 27 October 2016)', 'image' => null, 'short_content' => 'The benchmark index climbed up during the first half of last month. However, it took a U-turn during the second half of the month, indicating a bearish presence in the market. The index lost 7.2 points (or down 0.34%) last month to close at 1759.71. ', 'status' => true, 'publish_date' => '0000-00-00' ) ), (int) 31 => array( 'MagazineArticle' => array( 'id' => '1598', 'magazine_issue_id' => '966', 'magazine_category_id' => '63', 'title' => 'Monthly Technical Analysis of Nepse (28 August to 22 September 2016)', 'image' => null, 'short_content' => 'The benchmark index experienced a bullish run during the first half of last month. However, the second half of the month was triggered by a bearish momentum. Nepse gained 36.29 points (or up 2.12%) last month to close at 1766.91. ', 'status' => true, 'publish_date' => '0000-00-00' ) ), (int) 32 => array( 'MagazineArticle' => array( 'id' => '1567', 'magazine_issue_id' => '965', 'magazine_category_id' => '63', 'title' => 'Monthly Technical Analysis of Nepse (31 July to 25 August 2016)', 'image' => null, 'short_content' => 'The benchmark index went through high volatility last month. The index lost a staggering 147.31 points (or down -7.72%) to close at 1730.62. Nepse lost 202.02 points during the first half of the month. The index hit a negative, as well as positive circuit break during the middle of the month, as nervousness became apparent in the market. ', 'status' => true, 'publish_date' => '0000-00-00' ) ), (int) 33 => array( 'MagazineArticle' => array( 'id' => '1543', 'magazine_issue_id' => '964', 'magazine_category_id' => '63', 'title' => 'Monthly Technical Analysis of Nepse (28 June to 28 July 2016)', 'image' => null, 'short_content' => 'The benchmark index saw tremendous growth in the course of last month. The index gained 165.09 points (or up 7.86%) to close at 1877.93. Various policies and economic scenarios have supported the bullish sentiment in the market.', 'status' => true, 'publish_date' => '0000-00-00' ) ), (int) 34 => array( 'MagazineArticle' => array( 'id' => '1531', 'magazine_issue_id' => '963', 'magazine_category_id' => '63', 'title' => ' Monthly Technical Analysis of Nepse (26 May to 27 June 2016)', 'image' => null, 'short_content' => 'The benchmark index created history by breaking the 1600 and 1700 mark in the course of last month. The index gained a staggering 197.65 points (or up 12.34%) to close at 1721.77. The Insurance and Hydropower sectors have caused the market to climb further up', 'status' => true, 'publish_date' => '0000-00-00' ) ), (int) 35 => array( 'MagazineArticle' => array( 'id' => '1505', 'magazine_issue_id' => '962', 'magazine_category_id' => '63', 'title' => 'Monthly Technical Analysis of Nepse (2 May to 25 May 2016)', 'image' => null, 'short_content' => 'The benchmark index continues to create new heights as the bullish momentum is driving the market upward. The index gained 59.21 points (or up 4.01%) to close at 1524.12 in the course of last month. The market did correct itself during the course of the week. ', 'status' => true, 'publish_date' => '0000-00-00' ) ), (int) 36 => array( 'MagazineArticle' => array( 'id' => '1481', 'magazine_issue_id' => '961', 'magazine_category_id' => '63', 'title' => 'Monthly Technical Analysis of Nepse (28 March to 28 April 2016)', 'image' => null, 'short_content' => 'The benchmark index continued its upward climb last month as well. Nepse index gained 87.58 points (or up 6.21%) to close at an all time height of 1464.91. The index witnessed some corrections at the beginning of the month, as it declined by 25.79 points.', 'status' => true, 'publish_date' => '0000-00-00' ) ), (int) 37 => array( 'MagazineArticle' => array( 'id' => '1449', 'magazine_issue_id' => '959', 'magazine_category_id' => '63', 'title' => ' Monthly Technical Analysis of Nepse (31 January to 25 February 2016)', 'image' => null, 'short_content' => 'The benchmark index scaled up further in the course of last month. Nepse index gained a staggering 67.41 points (or up 5.43%) to close at 1283.52. The index is moving well above the 50-day moving average (MA) and 200-day MA, indicating that the overall market outlook looks good.', 'status' => true, 'publish_date' => '0000-00-00' ) ), (int) 38 => array( 'MagazineArticle' => array( 'id' => '1432', 'magazine_issue_id' => '958', 'magazine_category_id' => '63', 'title' => ' Monthly Technical Analysis of Nepse (27 December, 2015 to 28 January 2016)', 'image' => null, 'short_content' => 'The benchmark index increased further in the course of last month. The Nepse index gained a staggering 79.08 points (or up 6.77%) to close at 1216.11. Few reasons have caused the market to be bullish last month. Firstly, the bullish momentum was triggered by an increase in the demand in the insurance sector.', 'status' => true, 'publish_date' => '0000-00-00' ) ), (int) 39 => array( 'MagazineArticle' => array( 'id' => '1380', 'magazine_issue_id' => '956', 'magazine_category_id' => '63', 'title' => 'Monthly Technical Analysis of Nepse (1 November to 26 November, 2015)', 'image' => null, 'short_content' => 'or the first half of the month, the benchmark index moved sideways, hovering above its immediate support level of 1084. The index then reached a high level of 1109. However, for the second half of the month the index spiraled downwards, losing 48.03 points (or down 4.43%).', 'status' => true, 'publish_date' => '0000-00-00' ) ), (int) 40 => array( 'MagazineArticle' => array( 'id' => '1363', 'magazine_issue_id' => '955', 'magazine_category_id' => '63', 'title' => 'Why S&P 500 is expected to make an important low on 26th November, 2015 at 13:43 NEWYORK TIME ?', 'image' => '20151125121943_st.jpg', 'short_content' => 'You will see every time when the planet Venus travels the sign of Libra at 19.48 degree, the S&P makes an important low there. Not once or twice or thrice, but in year 2010, 2011, 2012, 2013 and 2014 – five years in a row - it was right on the spot and the next date is 26th November,2015.', 'status' => true, 'publish_date' => '0000-00-00' ) ), (int) 41 => array( 'MagazineArticle' => array( 'id' => '1324', 'magazine_issue_id' => '954', 'magazine_category_id' => '63', 'title' => 'Forecasting Gold Prices with Astrology’s Help ', 'image' => null, 'short_content' => 'Gold is ruled by the planet Sun and the sign Leo. When a benefic planet transits Leo and at the same time casts good aspects to the Sun or when it casts a good aspect to Leo from other signs the value of gold rises. ', 'status' => true, 'publish_date' => '0000-00-00' ) ), (int) 42 => array( 'MagazineArticle' => array( 'id' => '1338', 'magazine_issue_id' => '954', 'magazine_category_id' => '63', 'title' => 'Market Gone Flat after Breaching Record (Review for 25 August to 24 September, 2015)', 'image' => null, 'short_content' => 'The secondary market touched the historic high during the review period ahead of the promulgation of the long awaited new constitution. But after the constitution was promulgated, it shed some of the gains and remains flat then after. ', 'status' => true, 'publish_date' => '0000-00-00' ) ), (int) 43 => array( 'MagazineArticle' => array( 'id' => '1346', 'magazine_issue_id' => '954', 'magazine_category_id' => '63', 'title' => 'Monthly Technical Analysis of Nepse (23 August to 24 September, 2015)', 'image' => null, 'short_content' => 'Nepse index followed a sideways movement for most of last month. The benchmark index tested the 1200 mark three times in the course of previous month. On 15th September, Nepse reached its all time high of 1205.84 level. The current trend shows Nepse to be falling faintly, creating lower low in the support zone. ', 'status' => true, 'publish_date' => '0000-00-00' ) ), (int) 44 => array( 'MagazineArticle' => array( 'id' => '1294', 'magazine_issue_id' => '953', 'magazine_category_id' => '63', 'title' => 'The Most Awaited Trade of 2015', 'image' => null, 'short_content' => 'This trade is probably the most awaited trade of 2015. The entire world is anxious to know when the US stock indices are going to stop their unstoppable bull rally which started in 2009.', 'status' => true, 'publish_date' => '0000-00-00' ) ), (int) 45 => array( 'MagazineArticle' => array( 'id' => '1312', 'magazine_issue_id' => '953', 'magazine_category_id' => '63', 'title' => 'Rise and Rise of Nepse (Review for 23 July to 20 August, 2015)', 'image' => null, 'short_content' => 'Nepal’s Capital Market set the history’s new high during the review period as positive sentiments towards banking stocks led all the sectors. The benchmark Nepse index touched 1200.92 adding 197.54 points in the review period while the session’s low was at the opening (23 July) with 1003.38.', 'status' => true, 'publish_date' => '0000-00-00' ) ), (int) 46 => array( 'MagazineArticle' => array( 'id' => '1313', 'magazine_issue_id' => '953', 'magazine_category_id' => '63', 'title' => 'Monthly Technical Analysis of Nepse (26 July to 20 August, 2015) ', 'image' => null, 'short_content' => 'Nepse witnessed remarkable gains in the course of last month. The benchmark index rose by 197.54 points (or up 18.31%). It surpassed its previous resistance levels of 1036.98 and 1100 points and is moving well above the 50-day and 200-day moving average, and at a much higher rate, indicating a bullish outlook.', 'status' => true, 'publish_date' => '0000-00-00' ) ), (int) 47 => array( 'MagazineArticle' => array( 'id' => '1265', 'magazine_issue_id' => '952', 'magazine_category_id' => '63', 'title' => 'Stay Alert from September 14 to October 14', 'image' => null, 'short_content' => 'In our article, “Millionaires don’t use astrology but billionaires do” written on March 31 2015 and published in the May, 2015 issue of New Business Age we forecasted that: ', 'status' => true, 'publish_date' => '0000-00-00' ) ), (int) 48 => array( 'MagazineArticle' => array( 'id' => '1244', 'magazine_issue_id' => '928', 'magazine_category_id' => '63', 'title' => 'Moving Sideways', 'image' => null, 'short_content' => 'As the earthquake has destroyed property and hampered trade, consumption, investment and living patterns of the people, business activities have been hampered. However, the exact loss can be assesses only after the coming quarterly reports of the listed companies.', 'status' => true, 'publish_date' => '0000-00-00' ) ), (int) 49 => array( 'MagazineArticle' => array( 'id' => '1245', 'magazine_issue_id' => '928', 'magazine_category_id' => '63', 'title' => 'Are We Ready for the Next Stock Market Crash?', 'image' => null, 'short_content' => 'In US stock market history, so far we have seen three big crashes. The first crash was on 28th October 1929, followed by the second on 19th October 1987 and the last crash was on 6th October 2008.', 'status' => true, 'publish_date' => '0000-00-00' ) ), (int) 50 => array( 'MagazineArticle' => array( 'id' => '1246', 'magazine_issue_id' => '928', 'magazine_category_id' => '63', 'title' => 'Smarten Your Approach to the Secondary Market', 'image' => null, 'short_content' => 'Before investing in the secondary market, take a breather and evaluate yourself. What is your type? Are you an investor or a trader?', 'status' => true, 'publish_date' => '0000-00-00' ) ), (int) 51 => array( 'MagazineArticle' => array( 'id' => '1247', 'magazine_issue_id' => '928', 'magazine_category_id' => '63', 'title' => 'Monthly Technical Analysis of Nepse (May 24 to June 23, 2015)', 'image' => null, 'short_content' => 'The aftermath of the earthquake caused Nepse index to fall by 10.70%. Nevertheless, the index increased soon enough, rising by 15.43% halfway through last month. Currently, Nepse is at a correction period.', 'status' => true, 'publish_date' => '0000-00-00' ) ), (int) 52 => array( 'MagazineArticle' => array( 'id' => '1193', 'magazine_issue_id' => '889', 'magazine_category_id' => '63', 'title' => '11.47 Points Fall Ahead of Q3 Results', 'image' => null, 'short_content' => 'Most of the stocks turned red during the review period (Feb 18 - March 19) pushing the index to nearly two months low. The Nepse index closed in red losing 15.03 points or 1.53% to settle at 967.62. The index touched highest level on 9 March with 988.77 and the lowest was 959.14 on 16 March. ', 'status' => true, 'publish_date' => '0000-00-00' ) ), (int) 53 => array( 'MagazineArticle' => array( 'id' => '1194', 'magazine_issue_id' => '889', 'magazine_category_id' => '63', 'title' => 'Monthly Technical Analysis of Nepse (March 19 to April 23, 2015) : At Lowest Volatility of the Year', 'image' => null, 'short_content' => 'RSI is a form of leading indicator that is believed to be most effective during periods of sideways movement. Such indicators may create numerous buy and sell signals that are useful when the market is not clearly trending upwards or downwards. ', 'status' => true, 'publish_date' => '0000-00-00' ) ), (int) 54 => array( 'MagazineArticle' => array( 'id' => '1166', 'magazine_issue_id' => '863', 'magazine_category_id' => '63', 'title' => 'Market @ Two Months’ Low', 'image' => null, 'short_content' => 'Most of the stocks turned red during the review period (Feb 18 - March 19) pushing the index to nearly two months low. The Nepse index closed in red losing 15.03 points or 1.53% to settle at 967.62. The index touched highest level on 9 March with 988.77 and the lowest was 959.14 on 16 March. ', 'status' => true, 'publish_date' => '0000-00-00' ) ), (int) 55 => array( 'MagazineArticle' => array( 'id' => '1167', 'magazine_issue_id' => '863', 'magazine_category_id' => '63', 'title' => 'Technical Analysis Monthly (February 19 to March 19, 2015) Bearish Signals', 'image' => null, 'short_content' => ' Nepse has not made much improvement in the past 30 days as compared to the growth witnessed in the previous months. Nepse decreased by -19.43 points (or -1.95%) to close at 967.62 points. It fell below its support level of 972.17, which is now its new resistance level. ', 'status' => true, 'publish_date' => '0000-00-00' ) ), (int) 56 => array( 'MagazineArticle' => array( 'id' => '1139', 'magazine_issue_id' => '839', 'magazine_category_id' => '63', 'title' => 'Nepse Slows Down', 'image' => null, 'short_content' => 'The secondary market of Nepal stalled after reaching nearly six months high while political uncertainties compelled the investors to wait-and-watch. The benchmark Nepse index added 7.20 points or 0.74 per cent to rest at 982.62. ', 'status' => true, 'publish_date' => '0000-00-00' ) ), (int) 57 => array( 'MagazineArticle' => array( 'id' => '1140', 'magazine_issue_id' => '839', 'magazine_category_id' => '63', 'title' => 'Technical Analysis Monthly (Jan 20, 14 – Feb 19, 15) : Bullish Signal for Long Term', 'image' => null, 'short_content' => 'After the huge gains witnessed in the previous periods, Nepse remained almost flat during the past 30 days. However, there was an overall positive gain in the market as Nepse increased by 7.2 points (or 0.74%) to close at 982.65 points.', 'status' => true, 'publish_date' => '0000-00-00' ) ), (int) 58 => array( 'MagazineArticle' => array( 'id' => '1108', 'magazine_issue_id' => '811', 'magazine_category_id' => '63', 'title' => 'Waiting for Confirmation Signal', 'image' => null, 'short_content' => 'Nepal’s secondary market turned little green with hopes that agreement between major political parties on contentious issues of new constitution was underway. The Nepse index accelerated 66.19 points or 7.38 per cent to close at 962.80. ', 'status' => true, 'publish_date' => '0000-00-00' ) ), (int) 59 => array( 'MagazineArticle' => array( 'id' => '1109', 'magazine_issue_id' => '811', 'magazine_category_id' => '63', 'title' => 'Technical Analysis Monthly (Dec 21, 2014 to Jan 20, 2015)', 'image' => null, 'short_content' => 'Giving continuity to the previous period’s positive momentum, Nepse has been able to make remarkable gains during this period. The stock market moved past its strong resistance level of 938.41 to close at 962.8 points – an increase of 58.91 points or 6.52 per cent.', 'status' => true, 'publish_date' => '0000-00-00' ) ), (int) 60 => array( 'MagazineArticle' => array( 'id' => '1064', 'magazine_issue_id' => '783', 'magazine_category_id' => '63', 'title' => 'Politics Still a Factor', 'image' => null, 'short_content' => 'Most of the listed companies have declared their dividends and few others are about to make these announcements. This means that the price adjustment of the stock after dividend declaration has also played role in driving the prices lower for such few companies. ', 'status' => true, 'publish_date' => '0000-00-00' ) ), (int) 61 => array( 'MagazineArticle' => array( 'id' => '1065', 'magazine_issue_id' => '783', 'magazine_category_id' => '63', 'title' => 'Technical Analysis Monthly (Nov 21 – Dec 20) : Fighting 916 Resistance', 'image' => null, 'short_content' => 'There was significant sideways movement in Nepse in the period between Nov 21, 2014 and Dec 20, 2014. The immediate support level of 844.42 was tested three times while the imme-diate resistance level of 875.56 was tested once in the review period.', 'status' => true, 'publish_date' => '0000-00-00' ) ), (int) 62 => array( 'MagazineArticle' => array( 'id' => '1036', 'magazine_issue_id' => '756', 'magazine_category_id' => '63', 'title' => 'Market Dips to 6 Months Low', 'image' => null, 'short_content' => 'The stock market of Nepal plunged to 6 months low in the review period as gloomy political winter cooled investors’ sentiment. The Nepse index lost 61.84 points or 6.69% to rest at 862.5 while the session’s high was on 27 Oct with 935.01 and lowest was on 18 Nov with 844.06. ', 'status' => true, 'publish_date' => '0000-00-00' ) ), (int) 63 => array( 'MagazineArticle' => array( 'id' => '1037', 'magazine_issue_id' => '756', 'magazine_category_id' => '63', 'title' => 'Technical Analysis Monthly (Oct 20 – Nov 20)', 'image' => null, 'short_content' => 'Since Nepse peaked at 1083.55 points on July 21, 2014, the stock market has been following a bearish pattern. Though the markets stabilized and saw a 2.88% rebound during the last trading period, overall Nepse has continued its downward trend', 'status' => true, 'publish_date' => '0000-00-00' ) ), (int) 64 => array( 'MagazineArticle' => array( 'id' => '1038', 'magazine_issue_id' => '756', 'magazine_category_id' => '63', 'title' => 'Ups and Downs in Nepali Stock Market', 'image' => null, 'short_content' => 'Ups and downs in the indicators of the stock market are a regular phenomenon. The market goes up when more investors exercise for buying stocks and slips down when more investors are in the mood to sell their shares. If they quickly want to exit from the market,', 'status' => true, 'publish_date' => '0000-00-00' ) ), (int) 65 => array( 'MagazineArticle' => array( 'id' => '992', 'magazine_issue_id' => '730', 'magazine_category_id' => '63', 'title' => 'Market Stalled after Losing Steam', 'image' => null, 'short_content' => 'The Nepali stock market remained stable during the review period despite the recent sharp fall. The benchmark Nepse index added 3.71 points or 0.40% to reach 923.59 while the session’s high was on 30 September with 937.99 and lowest was on 22 September with 881.87. ', 'status' => true, 'publish_date' => '0000-00-00' ) ), (int) 66 => array( 'MagazineArticle' => array( 'id' => '993', 'magazine_issue_id' => '730', 'magazine_category_id' => '63', 'title' => 'Monthly Technical Analysis of Nepse November 2014', 'image' => null, 'short_content' => 'After two continuous trading periods of huge declines, Nepse has stabilized in recent times. Compared to the previous period, Nepse made an upward gain of 25.96 points (or 2.88%) closing at 925.85 points. ', 'status' => true, 'publish_date' => '0000-00-00' ) ), (int) 67 => array( 'MagazineArticle' => array( 'id' => '994', 'magazine_issue_id' => '730', 'magazine_category_id' => '63', 'title' => 'Privatization, Corporatization and Strategic Partner for NEPSE', 'image' => null, 'short_content' => 'Historically stock exchanges started as a mutually governed, non-profit making, self-regulated cooperative like structures. Mostly brokers were the owners of such exchanges. However, due to the change in the technology and the concept of securities commission as apex regulator', 'status' => true, 'publish_date' => '0000-00-00' ) ), (int) 68 => array( 'MagazineArticle' => array( 'id' => '920', 'magazine_issue_id' => '678', 'magazine_category_id' => '63', 'title' => 'The Big Retreat', 'image' => null, 'short_content' => 'The Nepali bourse cooled down after reaching a high of 1083.55 as selling pressure ruled the market. The benchmark Nepse index plummeted 61.35 points or 5.71% to close at 1013.6 while session’s high was on 21st July with 1083.55 and lowest on 18th August with 1013.25. ', 'status' => true, 'publish_date' => '0000-00-00' ) ), (int) 69 => array( 'MagazineArticle' => array( 'id' => '921', 'magazine_issue_id' => '678', 'magazine_category_id' => '63', 'title' => 'Monthly Technical Analysis of Nepse (July 21 - August 14, 2014)', 'image' => null, 'short_content' => 'On the first trading day of the review period the secondary market had witnessed the highest rise as the benchmark index settled at 1083.55 points, a new high since the last 6 years. On the same day Nepse had attained the highest turnover of NPR 1.20 billion on a single trading day in its history.', 'status' => true, 'publish_date' => '0000-00-00' ) ), (int) 70 => array( 'MagazineArticle' => array( 'id' => '952', 'magazine_issue_id' => '704', 'magazine_category_id' => '63', 'title' => 'The End of Bull Run', 'image' => null, 'short_content' => 'The stock market of Nepal which was predicted to break the previous historic high level of 1175.38 points pulled back from 1083.55 and witnessed a nose dive sessions. ', 'status' => true, 'publish_date' => '0000-00-00' ) ), (int) 71 => array( 'MagazineArticle' => array( 'id' => '953', 'magazine_issue_id' => '704', 'magazine_category_id' => '63', 'title' => 'Monthly Technical Analysis of Nepse October 2014', 'image' => null, 'short_content' => 'Nepal Stock Exchange (Nepse) index continued spiralling downwards during the August 19 to September 18, 2014 period, just like the preceding period. During the review period, Nepse fell by 134.5 points (-13 per cent) to close at 899.89 points.', 'status' => true, 'publish_date' => '0000-00-00' ) ), (int) 72 => array( 'MagazineArticle' => array( 'id' => '954', 'magazine_issue_id' => '704', 'magazine_category_id' => '63', 'title' => 'NRN Investment through Capital Market', 'image' => null, 'short_content' => '‘Economic Roadmap for Prosperous Nepal’ was the main theme of 8th NRN regional conference held on Nagano, Japan from September 18 to 19. About three hundred NRNs had participated from different part of the globe to discuss on the given theme. ', 'status' => true, 'publish_date' => '0000-00-00' ) ), (int) 73 => array( 'MagazineArticle' => array( 'id' => '1405', 'magazine_issue_id' => '957', 'magazine_category_id' => '63', 'title' => 'Monthly Technical Analysis of Nepse (29 November to 24 December, 2015)', 'image' => null, 'short_content' => 'The benchmark index saw huge changes in the course of last month. Despite all the difficulties and political unrest in the country, Nepse gained a staggering 114.26 points (or up 11.17%) to close at 1137.03. It seems that the monetary policy is still playing a major role in causing the market to be bullish.', 'status' => true, 'publish_date' => '0000-00-00' ) ) ) $magazineCategory = array( 'MagazineCategory' => array( 'id' => '63', 'title' => 'Stock Taking', 'sortorder' => '516', 'status' => true, 'created' => '0000-00-00 00:00:00', 'homepage' => true, 'modified' => '2013-04-01 00:00:00' ) ) $magazineArticle = array( 'MagazineArticle' => array( 'id' => '952', 'magazine_issue_id' => '704', 'magazine_category_id' => '63', 'title' => 'The End of Bull Run', 'image' => null, 'short_content' => 'The stock market of Nepal which was predicted to break the previous historic high level of 1175.38 points pulled back from 1083.55 and witnessed a nose dive sessions. ', 'status' => true, 'publish_date' => '0000-00-00' ) ) $issue_title = array() $width = (int) 400 $height = (int) 230 $ratio = (float) 1.7391304347826 $img_width = (int) 160 $img_height = (float) 92include - APP/View/MagazineArticles/category.ctp, line 86 View::_evaluate() - CORE/Cake/View/View.php, line 971 View::_render() - CORE/Cake/View/View.php, line 933 View::render() - CORE/Cake/View/View.php, line 473 Controller::render() - CORE/Cake/Controller/Controller.php, line 968 Dispatcher::_invoke() - CORE/Cake/Routing/Dispatcher.php, line 200 Dispatcher::dispatch() - CORE/Cake/Routing/Dispatcher.php, line 167 [main] - APP/webroot/index.php, line 117
Notice (8): Undefined index: MagazineIssue [APP/View/MagazineArticles/category.ctp, line 86]Code Context<div class="category"><span class="label label-danger"><?php echo $this->Html->link($issue_title['MagazineIssue']['title'],$viewFile = '/var/www/html/newbusinessage.com/app/View/MagazineArticles/category.ctp' $dataForView = array( 'current_user' => null, 'logged_in' => false ) $current_user = null $logged_in = false $cat_id = '63' $magazineArticles = array( (int) 0 => array( 'MagazineArticle' => array( 'id' => '2742', 'magazine_issue_id' => '1006', 'magazine_category_id' => '63', 'title' => 'Monthly Technical Analysis (November 24th -December 19th 2019)', 'image' => '20201010020410_Clipboard30.jpg', 'short_content' => 'NEPSE index gained 39.57 points (or up 3.56 %) to close at 1149.65 last month. Last month 50 days moving average of NEPSE was crossed from below which showed short term bull. However, NEPSE is trading below 200 days moving average which shows that overall long term sentiment is still bearish.', 'status' => true, 'publish_date' => null ) ), (int) 1 => array( 'MagazineArticle' => array( 'id' => '2508', 'magazine_issue_id' => '998', 'magazine_category_id' => '63', 'title' => 'Monthly Technical Analysis of Nepse March 24th 2019 – April 22th 2019', 'image' => '20190511100832_Clipboard24.jpg', 'short_content' => 'NEPSE gained 116.34 points (or up 10.20%) to close at 1250.94 last month that ended on April 22. Last month, NEPSE showed a bullish momentum breaking the resistance level of 200 days moving average. Currently, NEPSE is trading above the 50 days moving average and 200 days moving average. The average daily volume turnover has increased to NPR 53.01 crores from NPR 30.26 crores', 'status' => true, 'publish_date' => null ) ), (int) 2 => array( 'MagazineArticle' => array( 'id' => '2464', 'magazine_issue_id' => '997', 'magazine_category_id' => '63', 'title' => 'Monthly Technical Analysis of Nepse (February 27th 2019 – March 21th 2019)', 'image' => '20190403054014_1111.jpg', 'short_content' => 'NEPSE gained 38.04 points (or up 3.45%) to close at 1140.6 last month. At the beginning of month, NEPSE showed a bullish momentum breaking the resistance level of 50 days moving average.', 'status' => true, 'publish_date' => null ) ), (int) 3 => array( 'MagazineArticle' => array( 'id' => '2429', 'magazine_issue_id' => '996', 'magazine_category_id' => '63', 'title' => 'Monthly Technical Analysis of Nepse (January 26rd 2019 – February 16th 2019)', 'image' => '20190307122140_Clipboard04.jpg', 'short_content' => 'NEPSE index lost 85.21 points (or down 7.17%) to close at 1102.56 last month. Currently, NEPSE is trading below the 200 days moving average. At the beginning of the month, NEPSE breached the support level of 50 days moving average and traded below the 50 days moving average. ', 'status' => true, 'publish_date' => null ) ), (int) 4 => array( 'MagazineArticle' => array( 'id' => '2403', 'magazine_issue_id' => '995', 'magazine_category_id' => '63', 'title' => 'Monthly Technical Analysis of Nepse (December 23rd 2018 – January 17th 2019)', 'image' => '20190215124248_Clipboard07.jpg', 'short_content' => 'NEPSE index gained 21.8 (or up 1.87%) to close at 1187.77 last month. At the beginning of last month, NEPSE index showed bullish momentum by breaching the resistance of 50 days moving average. However, NEPSE index could not breach the 200 days moving average and retraced back forming a shooting star candle. Currently, NEPSE is trading above 50 days moving average and below 200 days moving says average.', 'status' => true, 'publish_date' => null ) ), (int) 5 => array( 'MagazineArticle' => array( 'id' => '2359', 'magazine_issue_id' => '993', 'magazine_category_id' => '63', 'title' => 'Monthly Technical Analysis of Nepse (November 25, 2018 – December 20, 2018)', 'image' => '20190110065454_Clipboard10.jpg', 'short_content' => 'NEPSE index lost 15.27 (or down 1.293%) to close at 1165.97 last month. Currently, the index is trading below the 50 days moving average and 200 days moving average. During the course of last month, NEPSE index breached the support level of 1150, reached the low level of 1120.84 forming a spinning bottom and bounced back to close at 1165.97.', 'status' => true, 'publish_date' => '2019-01-10' ) ), (int) 6 => array( 'MagazineArticle' => array( 'id' => '2325', 'magazine_issue_id' => '992', 'magazine_category_id' => '63', 'title' => 'Monthly Technical Analysis of Nepse (October 26, 2018 – November 22, 2018)', 'image' => null, 'short_content' => 'NEPSE index lost 59.70 (or down 4.81%) to close at 1181.41 last month. Currently, the index is trading below the 50 days moving average and 200 days moving average. NEPSE breached the support level of 50 days moving average.', 'status' => true, 'publish_date' => '0000-00-00' ) ), (int) 7 => array( 'MagazineArticle' => array( 'id' => '2294', 'magazine_issue_id' => '991', 'magazine_category_id' => '63', 'title' => 'Monthly Technical Analysis of Nepse (September 26th 2018 – October 25th 2018)', 'image' => null, 'short_content' => 'NEPSE index lost 36.63 (or down 2.867%) to close at 1241.11 last month. Currently, the index is trading above the 50 days moving average. However, the index is still moving below 200 days moving average.', 'status' => true, 'publish_date' => '0000-00-00' ) ), (int) 8 => array( 'MagazineArticle' => array( 'id' => '2264', 'magazine_issue_id' => '990', 'magazine_category_id' => '63', 'title' => 'Monthly Technical Analysis of Nepse (August 26th 2018 – September 26th 2018)', 'image' => null, 'short_content' => 'NEPSE index experienced high volatility in the course of last month. It gained 102.02 (or up 8.68%) to close at 1277.74 last month. Currently, the index is trading above 50 days moving average. However, the index is still moving below 200-day moving average. ', 'status' => true, 'publish_date' => '0000-00-00' ) ), (int) 9 => array( 'MagazineArticle' => array( 'id' => '2232', 'magazine_issue_id' => '989', 'magazine_category_id' => '63', 'title' => 'Monthly Technical Analysis of Nepse (July 22nd 2018 - August 23rd 2018)', 'image' => null, 'short_content' => 'Nepse index lost 3.16 points (or down0.27%) to close at 1178.5 last month. The index continues to trade below50-day moving average and 200-day moving average indicating bearish momentum in the market. The average volume turnover decreased to Rs 22.51crores from Rs 29.66 crores the month prior.', 'status' => true, 'publish_date' => '0000-00-00' ) ), (int) 10 => array( 'MagazineArticle' => array( 'id' => '2220', 'magazine_issue_id' => '988', 'magazine_category_id' => '63', 'title' => 'Monthly Technical Analysis of Nepse (June 24th 2018 - July 22th 2018)', 'image' => null, 'short_content' => 'The benchmark index declined in the course of last month. Nepse decreased by 36.80 points (or down 3.02%) to close at 1181.66. The index continues to trade below 50-day moving average and 200-day moving average indicating bearish momentum in the market.', 'status' => true, 'publish_date' => '0000-00-00' ) ), (int) 11 => array( 'MagazineArticle' => array( 'id' => '2171', 'magazine_issue_id' => '987', 'magazine_category_id' => '63', 'title' => 'Monthly Technical Analysis of Nepse (May25th 2018 - June 21th 2018)', 'image' => null, 'short_content' => 'The benchmark index declined in the course of last month. Nepse decreased by 99.76 points (or down 7.57%) to close at 1218.46. The index breached 50-day moving average and still trading below 200-day moving average indicating bearish momentum in the market. ', 'status' => true, 'publish_date' => '0000-00-00' ) ), (int) 12 => array( 'MagazineArticle' => array( 'id' => '2147', 'magazine_issue_id' => '986', 'magazine_category_id' => '63', 'title' => 'Monthly Technical Analysis of Nepse (April 25th 2018 - May 24th 2018)', 'image' => null, 'short_content' => 'The benchmark index declined in the course of last month. Nepse decreased by 76.64 points (or down 4.90%) to close at 1318.22.The index moved towards 50-day moving average and still remains below the 200-day moving average. ', 'status' => true, 'publish_date' => '0000-00-00' ) ), (int) 13 => array( 'MagazineArticle' => array( 'id' => '2110', 'magazine_issue_id' => '985', 'magazine_category_id' => '63', 'title' => 'Monthly Technical Analysis of Nepse (March 22nd 2018 – April 24th 2018)', 'image' => null, 'short_content' => 'The benchmark index surged up in the course of last month. Nepse increased by a staggering 163.79 points (or up 12.97%) to close at 1394.86. The index crossed above the 50-day moving average, giving a bullish signal. However, the index still remains below the 200-day MA. New investors entering the market, as well as optimism regarding the implementation of online trading platform, has created this bullish trigger. ', 'status' => true, 'publish_date' => '0000-00-00' ) ), (int) 14 => array( 'MagazineArticle' => array( 'id' => '2089', 'magazine_issue_id' => '984', 'magazine_category_id' => '63', 'title' => 'Monthly Technical Analysis of Nepse (25 February to 21 March 2018)', 'image' => null, 'short_content' => 'The benchmark index continued its downfall in the course of last month. Nepse declined by a staggering 115.97 points (or down 11.78%) to close at 1231.01. The index moving below the 50-day and the 200-day moving average indicates bearish momentum in the market. ', 'status' => true, 'publish_date' => '0000-00-00' ) ), (int) 15 => array( 'MagazineArticle' => array( 'id' => '2062', 'magazine_issue_id' => '983', 'magazine_category_id' => '63', 'title' => 'Monthly Technical Analysis of Nepse (23 January to 22 February 2018)', 'image' => null, 'short_content' => 'The benchmark index continued its downfall in the course of last month. Nepse declined by 15.11 points (or down 1.02%) to close at 1386.98. The index moving below the 50-day and the 200-day moving average indicates bearish momentum in the market.', 'status' => true, 'publish_date' => '0000-00-00' ) ), (int) 16 => array( 'MagazineArticle' => array( 'id' => '2035', 'magazine_issue_id' => '982', 'magazine_category_id' => '63', 'title' => 'Monthly Technical Analysis of Nepse (24 December 2017 to 22 January 2018)', 'image' => null, 'short_content' => 'The benchmark index fell by 70.06 points (or down 4.75%) to close at 1402.09 last month. The index continued to move below the 50-day and the 200-day moving average, indicating a bearish momentum in the market. The market will likely remain bearish as the banks continue to face liquidity crunch.', 'status' => true, 'publish_date' => '0000-00-00' ) ), (int) 17 => array( 'MagazineArticle' => array( 'id' => '2011', 'magazine_issue_id' => '981', 'magazine_category_id' => '63', 'title' => 'Monthly Technical Analysis of Nepse (26 November to 21 December 2017)', 'image' => null, 'short_content' => 'The benchmark index fell by 21.14 points (or down 1.38%) to close at 1472.15 last month. The index has moved below the 50-day, as well as 200-day moving average, giving a bearish signal. Completion of the election at the beginning of the month did little to create bullish sentiment in the market.', 'status' => true, 'publish_date' => '0000-00-00' ) ), (int) 18 => array( 'MagazineArticle' => array( 'id' => '1982', 'magazine_issue_id' => '980', 'magazine_category_id' => '63', 'title' => 'Monthly Technical Analysis of Nepse (22 October to 23 November 2017)', 'image' => null, 'short_content' => 'The benchmark index fell by 75.06 points (or down 4.83%) to close at 1493.29 last month. The index is hovering below the 50-day, as well as the 200-day moving average. This shows the market to be in a bearish mode in the course of last month.', 'status' => true, 'publish_date' => '0000-00-00' ) ), (int) 19 => array( 'MagazineArticle' => array( 'id' => '1950', 'magazine_issue_id' => '979', 'magazine_category_id' => '63', 'title' => 'Monthly Technical Analysis of Nepse (20 September to 18 October 2017)', 'image' => null, 'short_content' => 'The benchmark index gained a modest 24.65 points (or up 1.67%) to close at 1568.35 last month. The index continues to move close to the 200-day moving average, which acts as a support level to the index. Favorable political outlook has triggered a bullish sentiment in the market. ', 'status' => true, 'publish_date' => '0000-00-00' ) ), (int) 20 => array( 'MagazineArticle' => array( 'id' => '1933', 'magazine_issue_id' => '978', 'magazine_category_id' => '63', 'title' => 'Monthly Technical Analysis of Nepse (22 August to 18 September 2017)', 'image' => null, 'short_content' => 'The benchmark index lost 67.87 points (or down 4.20%) to close at 1543.7 last month. The index fell below the 50-day, as well as 200-day moving average, which shows bearish sentiment in the market.', 'status' => true, 'publish_date' => '0000-00-00' ) ), (int) 21 => array( 'MagazineArticle' => array( 'id' => '1897', 'magazine_issue_id' => '977', 'magazine_category_id' => '63', 'title' => 'Monthly Technical Analysis of Nepse (25 July to 21 August 2017)', 'image' => null, 'short_content' => 'The benchmark index lost 17.51 points (or down 1.06%) to close at 1611.57 last month. The index remains above the 50-day, as well as 200 day moving average, signaling the market to be bullish. However, Nepse hovering close to the 50-day MA will test the respective MA for support level.', 'status' => true, 'publish_date' => '0000-00-00' ) ), (int) 22 => array( 'MagazineArticle' => array( 'id' => '1866', 'magazine_issue_id' => '976', 'magazine_category_id' => '63', 'title' => ' Monthly Technical Analysis of Nepse (25 June to 24 July 2017)', 'image' => null, 'short_content' => 'The benchmark index gained 69.59 points (or up 4.44%) to close at 1629.08 last month. Events such as release of monetary policy and talks regarding online trading system were witnessed in the course of last month. ', 'status' => true, 'publish_date' => '0000-00-00' ) ), (int) 23 => array( 'MagazineArticle' => array( 'id' => '1848', 'magazine_issue_id' => '975', 'magazine_category_id' => '63', 'title' => 'Monthly Technical Analysis of Nepse (28 May to 22 June 2017)', 'image' => null, 'short_content' => 'The benchmark index continued to fall in the course of last month. It declined by 70.09 points (or down -4.32%) last month to close at 1559.49. The index fell below the 50-day, as well as the 200-day moving average, giving a bearish signal.', 'status' => true, 'publish_date' => '0000-00-00' ) ), (int) 24 => array( 'MagazineArticle' => array( 'id' => '1801', 'magazine_issue_id' => '974', 'magazine_category_id' => '63', 'title' => 'Monthly Technical Analysis of Nepse (26 April to 24 May 2017)', 'image' => null, 'short_content' => 'The benchmark index declined from 1670.3 to 1629.58 in the course of last month. Its new support and resistance level stands at 1612 and 1780 level respectively. With no new bullish trigger, the index will likely test the new support level', 'status' => true, 'publish_date' => '0000-00-00' ) ), (int) 25 => array( 'MagazineArticle' => array( 'id' => '1780', 'magazine_issue_id' => '973', 'magazine_category_id' => '63', 'title' => 'Monthly Technical Analysis of Nepse (27 March to 25 April 2017)', 'image' => null, 'short_content' => 'The benchmark index continued its bullish run in the course of last month. Nepse gained 138.55 points (or up 9.08%) to close at 1672.38. Several factors supported the bullish momentum in the market. Positive political state of affairs, as well as Insurance Board’s directive to increase insurance capital,', 'status' => true, 'publish_date' => '0000-00-00' ) ), (int) 26 => array( 'MagazineArticle' => array( 'id' => '1753', 'magazine_issue_id' => '972', 'magazine_category_id' => '63', 'title' => 'Monthly Technical Analysis of Nepse (22 February to 26 March 2017)', 'image' => null, 'short_content' => 'The benchmark index experienced a remarkable climb in the course of last month. The index gained a staggering 176.26 points (or up 12.44%) to close at 1533.83. Gradual decrease in interest rates and positive hopes for political scenario seems to have caused a bullish trigger in the market. ', 'status' => true, 'publish_date' => '0000-00-00' ) ), (int) 27 => array( 'MagazineArticle' => array( 'id' => '1732', 'magazine_issue_id' => '971', 'magazine_category_id' => '63', 'title' => 'Monthly Technical Analysis of Nepse (20 January to 21 February 2017)', 'image' => null, 'short_content' => 'The benchmark index took a bearish ride at the beginning of last month, dropping as low as 1252.5 level. In the course of the month, Nepse lost a staggering 104.99 points (or down -6.93%) to close at 1357.57. Uncertain political environment and higher fixed deposit rate by the banks continues to create bearish sentiment in the market.', 'status' => true, 'publish_date' => '0000-00-00' ) ), (int) 28 => array( 'MagazineArticle' => array( 'id' => '1702', 'magazine_issue_id' => '970', 'magazine_category_id' => '63', 'title' => 'Nepse in Consolidation Stage', 'image' => null, 'short_content' => 'The benchmark indexcontinued to decline in the course of last month. The index lost 12.85 points (or down 0.87%) to close at 1462.56. Nepse continues to hover below the 200-day moving ..', 'status' => true, 'publish_date' => '0000-00-00' ) ), (int) 29 => array( 'MagazineArticle' => array( 'id' => '1650', 'magazine_issue_id' => '968', 'magazine_category_id' => '63', 'title' => 'Monthly Technical Analysis of Nepse (3 November to 30 November 2016)', 'image' => null, 'short_content' => 'The benchmark index experienced high volatility and bearish downturn in the course of last month. The index lost a staggering 151.38 points (or down 8.60%) to close at 1608.33. ', 'status' => true, 'publish_date' => '0000-00-00' ) ), (int) 30 => array( 'MagazineArticle' => array( 'id' => '1623', 'magazine_issue_id' => '967', 'magazine_category_id' => '63', 'title' => 'Monthly Technical Analysis of Nepse (23 September to 27 October 2016)', 'image' => null, 'short_content' => 'The benchmark index climbed up during the first half of last month. However, it took a U-turn during the second half of the month, indicating a bearish presence in the market. The index lost 7.2 points (or down 0.34%) last month to close at 1759.71. ', 'status' => true, 'publish_date' => '0000-00-00' ) ), (int) 31 => array( 'MagazineArticle' => array( 'id' => '1598', 'magazine_issue_id' => '966', 'magazine_category_id' => '63', 'title' => 'Monthly Technical Analysis of Nepse (28 August to 22 September 2016)', 'image' => null, 'short_content' => 'The benchmark index experienced a bullish run during the first half of last month. However, the second half of the month was triggered by a bearish momentum. Nepse gained 36.29 points (or up 2.12%) last month to close at 1766.91. ', 'status' => true, 'publish_date' => '0000-00-00' ) ), (int) 32 => array( 'MagazineArticle' => array( 'id' => '1567', 'magazine_issue_id' => '965', 'magazine_category_id' => '63', 'title' => 'Monthly Technical Analysis of Nepse (31 July to 25 August 2016)', 'image' => null, 'short_content' => 'The benchmark index went through high volatility last month. The index lost a staggering 147.31 points (or down -7.72%) to close at 1730.62. Nepse lost 202.02 points during the first half of the month. The index hit a negative, as well as positive circuit break during the middle of the month, as nervousness became apparent in the market. ', 'status' => true, 'publish_date' => '0000-00-00' ) ), (int) 33 => array( 'MagazineArticle' => array( 'id' => '1543', 'magazine_issue_id' => '964', 'magazine_category_id' => '63', 'title' => 'Monthly Technical Analysis of Nepse (28 June to 28 July 2016)', 'image' => null, 'short_content' => 'The benchmark index saw tremendous growth in the course of last month. The index gained 165.09 points (or up 7.86%) to close at 1877.93. Various policies and economic scenarios have supported the bullish sentiment in the market.', 'status' => true, 'publish_date' => '0000-00-00' ) ), (int) 34 => array( 'MagazineArticle' => array( 'id' => '1531', 'magazine_issue_id' => '963', 'magazine_category_id' => '63', 'title' => ' Monthly Technical Analysis of Nepse (26 May to 27 June 2016)', 'image' => null, 'short_content' => 'The benchmark index created history by breaking the 1600 and 1700 mark in the course of last month. The index gained a staggering 197.65 points (or up 12.34%) to close at 1721.77. The Insurance and Hydropower sectors have caused the market to climb further up', 'status' => true, 'publish_date' => '0000-00-00' ) ), (int) 35 => array( 'MagazineArticle' => array( 'id' => '1505', 'magazine_issue_id' => '962', 'magazine_category_id' => '63', 'title' => 'Monthly Technical Analysis of Nepse (2 May to 25 May 2016)', 'image' => null, 'short_content' => 'The benchmark index continues to create new heights as the bullish momentum is driving the market upward. The index gained 59.21 points (or up 4.01%) to close at 1524.12 in the course of last month. The market did correct itself during the course of the week. ', 'status' => true, 'publish_date' => '0000-00-00' ) ), (int) 36 => array( 'MagazineArticle' => array( 'id' => '1481', 'magazine_issue_id' => '961', 'magazine_category_id' => '63', 'title' => 'Monthly Technical Analysis of Nepse (28 March to 28 April 2016)', 'image' => null, 'short_content' => 'The benchmark index continued its upward climb last month as well. Nepse index gained 87.58 points (or up 6.21%) to close at an all time height of 1464.91. The index witnessed some corrections at the beginning of the month, as it declined by 25.79 points.', 'status' => true, 'publish_date' => '0000-00-00' ) ), (int) 37 => array( 'MagazineArticle' => array( 'id' => '1449', 'magazine_issue_id' => '959', 'magazine_category_id' => '63', 'title' => ' Monthly Technical Analysis of Nepse (31 January to 25 February 2016)', 'image' => null, 'short_content' => 'The benchmark index scaled up further in the course of last month. Nepse index gained a staggering 67.41 points (or up 5.43%) to close at 1283.52. The index is moving well above the 50-day moving average (MA) and 200-day MA, indicating that the overall market outlook looks good.', 'status' => true, 'publish_date' => '0000-00-00' ) ), (int) 38 => array( 'MagazineArticle' => array( 'id' => '1432', 'magazine_issue_id' => '958', 'magazine_category_id' => '63', 'title' => ' Monthly Technical Analysis of Nepse (27 December, 2015 to 28 January 2016)', 'image' => null, 'short_content' => 'The benchmark index increased further in the course of last month. The Nepse index gained a staggering 79.08 points (or up 6.77%) to close at 1216.11. Few reasons have caused the market to be bullish last month. Firstly, the bullish momentum was triggered by an increase in the demand in the insurance sector.', 'status' => true, 'publish_date' => '0000-00-00' ) ), (int) 39 => array( 'MagazineArticle' => array( 'id' => '1380', 'magazine_issue_id' => '956', 'magazine_category_id' => '63', 'title' => 'Monthly Technical Analysis of Nepse (1 November to 26 November, 2015)', 'image' => null, 'short_content' => 'or the first half of the month, the benchmark index moved sideways, hovering above its immediate support level of 1084. The index then reached a high level of 1109. However, for the second half of the month the index spiraled downwards, losing 48.03 points (or down 4.43%).', 'status' => true, 'publish_date' => '0000-00-00' ) ), (int) 40 => array( 'MagazineArticle' => array( 'id' => '1363', 'magazine_issue_id' => '955', 'magazine_category_id' => '63', 'title' => 'Why S&P 500 is expected to make an important low on 26th November, 2015 at 13:43 NEWYORK TIME ?', 'image' => '20151125121943_st.jpg', 'short_content' => 'You will see every time when the planet Venus travels the sign of Libra at 19.48 degree, the S&P makes an important low there. Not once or twice or thrice, but in year 2010, 2011, 2012, 2013 and 2014 – five years in a row - it was right on the spot and the next date is 26th November,2015.', 'status' => true, 'publish_date' => '0000-00-00' ) ), (int) 41 => array( 'MagazineArticle' => array( 'id' => '1324', 'magazine_issue_id' => '954', 'magazine_category_id' => '63', 'title' => 'Forecasting Gold Prices with Astrology’s Help ', 'image' => null, 'short_content' => 'Gold is ruled by the planet Sun and the sign Leo. When a benefic planet transits Leo and at the same time casts good aspects to the Sun or when it casts a good aspect to Leo from other signs the value of gold rises. ', 'status' => true, 'publish_date' => '0000-00-00' ) ), (int) 42 => array( 'MagazineArticle' => array( 'id' => '1338', 'magazine_issue_id' => '954', 'magazine_category_id' => '63', 'title' => 'Market Gone Flat after Breaching Record (Review for 25 August to 24 September, 2015)', 'image' => null, 'short_content' => 'The secondary market touched the historic high during the review period ahead of the promulgation of the long awaited new constitution. But after the constitution was promulgated, it shed some of the gains and remains flat then after. ', 'status' => true, 'publish_date' => '0000-00-00' ) ), (int) 43 => array( 'MagazineArticle' => array( 'id' => '1346', 'magazine_issue_id' => '954', 'magazine_category_id' => '63', 'title' => 'Monthly Technical Analysis of Nepse (23 August to 24 September, 2015)', 'image' => null, 'short_content' => 'Nepse index followed a sideways movement for most of last month. The benchmark index tested the 1200 mark three times in the course of previous month. On 15th September, Nepse reached its all time high of 1205.84 level. The current trend shows Nepse to be falling faintly, creating lower low in the support zone. ', 'status' => true, 'publish_date' => '0000-00-00' ) ), (int) 44 => array( 'MagazineArticle' => array( 'id' => '1294', 'magazine_issue_id' => '953', 'magazine_category_id' => '63', 'title' => 'The Most Awaited Trade of 2015', 'image' => null, 'short_content' => 'This trade is probably the most awaited trade of 2015. The entire world is anxious to know when the US stock indices are going to stop their unstoppable bull rally which started in 2009.', 'status' => true, 'publish_date' => '0000-00-00' ) ), (int) 45 => array( 'MagazineArticle' => array( 'id' => '1312', 'magazine_issue_id' => '953', 'magazine_category_id' => '63', 'title' => 'Rise and Rise of Nepse (Review for 23 July to 20 August, 2015)', 'image' => null, 'short_content' => 'Nepal’s Capital Market set the history’s new high during the review period as positive sentiments towards banking stocks led all the sectors. The benchmark Nepse index touched 1200.92 adding 197.54 points in the review period while the session’s low was at the opening (23 July) with 1003.38.', 'status' => true, 'publish_date' => '0000-00-00' ) ), (int) 46 => array( 'MagazineArticle' => array( 'id' => '1313', 'magazine_issue_id' => '953', 'magazine_category_id' => '63', 'title' => 'Monthly Technical Analysis of Nepse (26 July to 20 August, 2015) ', 'image' => null, 'short_content' => 'Nepse witnessed remarkable gains in the course of last month. The benchmark index rose by 197.54 points (or up 18.31%). It surpassed its previous resistance levels of 1036.98 and 1100 points and is moving well above the 50-day and 200-day moving average, and at a much higher rate, indicating a bullish outlook.', 'status' => true, 'publish_date' => '0000-00-00' ) ), (int) 47 => array( 'MagazineArticle' => array( 'id' => '1265', 'magazine_issue_id' => '952', 'magazine_category_id' => '63', 'title' => 'Stay Alert from September 14 to October 14', 'image' => null, 'short_content' => 'In our article, “Millionaires don’t use astrology but billionaires do” written on March 31 2015 and published in the May, 2015 issue of New Business Age we forecasted that: ', 'status' => true, 'publish_date' => '0000-00-00' ) ), (int) 48 => array( 'MagazineArticle' => array( 'id' => '1244', 'magazine_issue_id' => '928', 'magazine_category_id' => '63', 'title' => 'Moving Sideways', 'image' => null, 'short_content' => 'As the earthquake has destroyed property and hampered trade, consumption, investment and living patterns of the people, business activities have been hampered. However, the exact loss can be assesses only after the coming quarterly reports of the listed companies.', 'status' => true, 'publish_date' => '0000-00-00' ) ), (int) 49 => array( 'MagazineArticle' => array( 'id' => '1245', 'magazine_issue_id' => '928', 'magazine_category_id' => '63', 'title' => 'Are We Ready for the Next Stock Market Crash?', 'image' => null, 'short_content' => 'In US stock market history, so far we have seen three big crashes. The first crash was on 28th October 1929, followed by the second on 19th October 1987 and the last crash was on 6th October 2008.', 'status' => true, 'publish_date' => '0000-00-00' ) ), (int) 50 => array( 'MagazineArticle' => array( 'id' => '1246', 'magazine_issue_id' => '928', 'magazine_category_id' => '63', 'title' => 'Smarten Your Approach to the Secondary Market', 'image' => null, 'short_content' => 'Before investing in the secondary market, take a breather and evaluate yourself. What is your type? Are you an investor or a trader?', 'status' => true, 'publish_date' => '0000-00-00' ) ), (int) 51 => array( 'MagazineArticle' => array( 'id' => '1247', 'magazine_issue_id' => '928', 'magazine_category_id' => '63', 'title' => 'Monthly Technical Analysis of Nepse (May 24 to June 23, 2015)', 'image' => null, 'short_content' => 'The aftermath of the earthquake caused Nepse index to fall by 10.70%. Nevertheless, the index increased soon enough, rising by 15.43% halfway through last month. Currently, Nepse is at a correction period.', 'status' => true, 'publish_date' => '0000-00-00' ) ), (int) 52 => array( 'MagazineArticle' => array( 'id' => '1193', 'magazine_issue_id' => '889', 'magazine_category_id' => '63', 'title' => '11.47 Points Fall Ahead of Q3 Results', 'image' => null, 'short_content' => 'Most of the stocks turned red during the review period (Feb 18 - March 19) pushing the index to nearly two months low. The Nepse index closed in red losing 15.03 points or 1.53% to settle at 967.62. The index touched highest level on 9 March with 988.77 and the lowest was 959.14 on 16 March. ', 'status' => true, 'publish_date' => '0000-00-00' ) ), (int) 53 => array( 'MagazineArticle' => array( 'id' => '1194', 'magazine_issue_id' => '889', 'magazine_category_id' => '63', 'title' => 'Monthly Technical Analysis of Nepse (March 19 to April 23, 2015) : At Lowest Volatility of the Year', 'image' => null, 'short_content' => 'RSI is a form of leading indicator that is believed to be most effective during periods of sideways movement. Such indicators may create numerous buy and sell signals that are useful when the market is not clearly trending upwards or downwards. ', 'status' => true, 'publish_date' => '0000-00-00' ) ), (int) 54 => array( 'MagazineArticle' => array( 'id' => '1166', 'magazine_issue_id' => '863', 'magazine_category_id' => '63', 'title' => 'Market @ Two Months’ Low', 'image' => null, 'short_content' => 'Most of the stocks turned red during the review period (Feb 18 - March 19) pushing the index to nearly two months low. The Nepse index closed in red losing 15.03 points or 1.53% to settle at 967.62. The index touched highest level on 9 March with 988.77 and the lowest was 959.14 on 16 March. ', 'status' => true, 'publish_date' => '0000-00-00' ) ), (int) 55 => array( 'MagazineArticle' => array( 'id' => '1167', 'magazine_issue_id' => '863', 'magazine_category_id' => '63', 'title' => 'Technical Analysis Monthly (February 19 to March 19, 2015) Bearish Signals', 'image' => null, 'short_content' => ' Nepse has not made much improvement in the past 30 days as compared to the growth witnessed in the previous months. Nepse decreased by -19.43 points (or -1.95%) to close at 967.62 points. It fell below its support level of 972.17, which is now its new resistance level. ', 'status' => true, 'publish_date' => '0000-00-00' ) ), (int) 56 => array( 'MagazineArticle' => array( 'id' => '1139', 'magazine_issue_id' => '839', 'magazine_category_id' => '63', 'title' => 'Nepse Slows Down', 'image' => null, 'short_content' => 'The secondary market of Nepal stalled after reaching nearly six months high while political uncertainties compelled the investors to wait-and-watch. The benchmark Nepse index added 7.20 points or 0.74 per cent to rest at 982.62. ', 'status' => true, 'publish_date' => '0000-00-00' ) ), (int) 57 => array( 'MagazineArticle' => array( 'id' => '1140', 'magazine_issue_id' => '839', 'magazine_category_id' => '63', 'title' => 'Technical Analysis Monthly (Jan 20, 14 – Feb 19, 15) : Bullish Signal for Long Term', 'image' => null, 'short_content' => 'After the huge gains witnessed in the previous periods, Nepse remained almost flat during the past 30 days. However, there was an overall positive gain in the market as Nepse increased by 7.2 points (or 0.74%) to close at 982.65 points.', 'status' => true, 'publish_date' => '0000-00-00' ) ), (int) 58 => array( 'MagazineArticle' => array( 'id' => '1108', 'magazine_issue_id' => '811', 'magazine_category_id' => '63', 'title' => 'Waiting for Confirmation Signal', 'image' => null, 'short_content' => 'Nepal’s secondary market turned little green with hopes that agreement between major political parties on contentious issues of new constitution was underway. The Nepse index accelerated 66.19 points or 7.38 per cent to close at 962.80. ', 'status' => true, 'publish_date' => '0000-00-00' ) ), (int) 59 => array( 'MagazineArticle' => array( 'id' => '1109', 'magazine_issue_id' => '811', 'magazine_category_id' => '63', 'title' => 'Technical Analysis Monthly (Dec 21, 2014 to Jan 20, 2015)', 'image' => null, 'short_content' => 'Giving continuity to the previous period’s positive momentum, Nepse has been able to make remarkable gains during this period. The stock market moved past its strong resistance level of 938.41 to close at 962.8 points – an increase of 58.91 points or 6.52 per cent.', 'status' => true, 'publish_date' => '0000-00-00' ) ), (int) 60 => array( 'MagazineArticle' => array( 'id' => '1064', 'magazine_issue_id' => '783', 'magazine_category_id' => '63', 'title' => 'Politics Still a Factor', 'image' => null, 'short_content' => 'Most of the listed companies have declared their dividends and few others are about to make these announcements. This means that the price adjustment of the stock after dividend declaration has also played role in driving the prices lower for such few companies. ', 'status' => true, 'publish_date' => '0000-00-00' ) ), (int) 61 => array( 'MagazineArticle' => array( 'id' => '1065', 'magazine_issue_id' => '783', 'magazine_category_id' => '63', 'title' => 'Technical Analysis Monthly (Nov 21 – Dec 20) : Fighting 916 Resistance', 'image' => null, 'short_content' => 'There was significant sideways movement in Nepse in the period between Nov 21, 2014 and Dec 20, 2014. The immediate support level of 844.42 was tested three times while the imme-diate resistance level of 875.56 was tested once in the review period.', 'status' => true, 'publish_date' => '0000-00-00' ) ), (int) 62 => array( 'MagazineArticle' => array( 'id' => '1036', 'magazine_issue_id' => '756', 'magazine_category_id' => '63', 'title' => 'Market Dips to 6 Months Low', 'image' => null, 'short_content' => 'The stock market of Nepal plunged to 6 months low in the review period as gloomy political winter cooled investors’ sentiment. The Nepse index lost 61.84 points or 6.69% to rest at 862.5 while the session’s high was on 27 Oct with 935.01 and lowest was on 18 Nov with 844.06. ', 'status' => true, 'publish_date' => '0000-00-00' ) ), (int) 63 => array( 'MagazineArticle' => array( 'id' => '1037', 'magazine_issue_id' => '756', 'magazine_category_id' => '63', 'title' => 'Technical Analysis Monthly (Oct 20 – Nov 20)', 'image' => null, 'short_content' => 'Since Nepse peaked at 1083.55 points on July 21, 2014, the stock market has been following a bearish pattern. Though the markets stabilized and saw a 2.88% rebound during the last trading period, overall Nepse has continued its downward trend', 'status' => true, 'publish_date' => '0000-00-00' ) ), (int) 64 => array( 'MagazineArticle' => array( 'id' => '1038', 'magazine_issue_id' => '756', 'magazine_category_id' => '63', 'title' => 'Ups and Downs in Nepali Stock Market', 'image' => null, 'short_content' => 'Ups and downs in the indicators of the stock market are a regular phenomenon. The market goes up when more investors exercise for buying stocks and slips down when more investors are in the mood to sell their shares. If they quickly want to exit from the market,', 'status' => true, 'publish_date' => '0000-00-00' ) ), (int) 65 => array( 'MagazineArticle' => array( 'id' => '992', 'magazine_issue_id' => '730', 'magazine_category_id' => '63', 'title' => 'Market Stalled after Losing Steam', 'image' => null, 'short_content' => 'The Nepali stock market remained stable during the review period despite the recent sharp fall. The benchmark Nepse index added 3.71 points or 0.40% to reach 923.59 while the session’s high was on 30 September with 937.99 and lowest was on 22 September with 881.87. ', 'status' => true, 'publish_date' => '0000-00-00' ) ), (int) 66 => array( 'MagazineArticle' => array( 'id' => '993', 'magazine_issue_id' => '730', 'magazine_category_id' => '63', 'title' => 'Monthly Technical Analysis of Nepse November 2014', 'image' => null, 'short_content' => 'After two continuous trading periods of huge declines, Nepse has stabilized in recent times. Compared to the previous period, Nepse made an upward gain of 25.96 points (or 2.88%) closing at 925.85 points. ', 'status' => true, 'publish_date' => '0000-00-00' ) ), (int) 67 => array( 'MagazineArticle' => array( 'id' => '994', 'magazine_issue_id' => '730', 'magazine_category_id' => '63', 'title' => 'Privatization, Corporatization and Strategic Partner for NEPSE', 'image' => null, 'short_content' => 'Historically stock exchanges started as a mutually governed, non-profit making, self-regulated cooperative like structures. Mostly brokers were the owners of such exchanges. However, due to the change in the technology and the concept of securities commission as apex regulator', 'status' => true, 'publish_date' => '0000-00-00' ) ), (int) 68 => array( 'MagazineArticle' => array( 'id' => '920', 'magazine_issue_id' => '678', 'magazine_category_id' => '63', 'title' => 'The Big Retreat', 'image' => null, 'short_content' => 'The Nepali bourse cooled down after reaching a high of 1083.55 as selling pressure ruled the market. The benchmark Nepse index plummeted 61.35 points or 5.71% to close at 1013.6 while session’s high was on 21st July with 1083.55 and lowest on 18th August with 1013.25. ', 'status' => true, 'publish_date' => '0000-00-00' ) ), (int) 69 => array( 'MagazineArticle' => array( 'id' => '921', 'magazine_issue_id' => '678', 'magazine_category_id' => '63', 'title' => 'Monthly Technical Analysis of Nepse (July 21 - August 14, 2014)', 'image' => null, 'short_content' => 'On the first trading day of the review period the secondary market had witnessed the highest rise as the benchmark index settled at 1083.55 points, a new high since the last 6 years. On the same day Nepse had attained the highest turnover of NPR 1.20 billion on a single trading day in its history.', 'status' => true, 'publish_date' => '0000-00-00' ) ), (int) 70 => array( 'MagazineArticle' => array( 'id' => '952', 'magazine_issue_id' => '704', 'magazine_category_id' => '63', 'title' => 'The End of Bull Run', 'image' => null, 'short_content' => 'The stock market of Nepal which was predicted to break the previous historic high level of 1175.38 points pulled back from 1083.55 and witnessed a nose dive sessions. ', 'status' => true, 'publish_date' => '0000-00-00' ) ), (int) 71 => array( 'MagazineArticle' => array( 'id' => '953', 'magazine_issue_id' => '704', 'magazine_category_id' => '63', 'title' => 'Monthly Technical Analysis of Nepse October 2014', 'image' => null, 'short_content' => 'Nepal Stock Exchange (Nepse) index continued spiralling downwards during the August 19 to September 18, 2014 period, just like the preceding period. During the review period, Nepse fell by 134.5 points (-13 per cent) to close at 899.89 points.', 'status' => true, 'publish_date' => '0000-00-00' ) ), (int) 72 => array( 'MagazineArticle' => array( 'id' => '954', 'magazine_issue_id' => '704', 'magazine_category_id' => '63', 'title' => 'NRN Investment through Capital Market', 'image' => null, 'short_content' => '‘Economic Roadmap for Prosperous Nepal’ was the main theme of 8th NRN regional conference held on Nagano, Japan from September 18 to 19. About three hundred NRNs had participated from different part of the globe to discuss on the given theme. ', 'status' => true, 'publish_date' => '0000-00-00' ) ), (int) 73 => array( 'MagazineArticle' => array( 'id' => '1405', 'magazine_issue_id' => '957', 'magazine_category_id' => '63', 'title' => 'Monthly Technical Analysis of Nepse (29 November to 24 December, 2015)', 'image' => null, 'short_content' => 'The benchmark index saw huge changes in the course of last month. Despite all the difficulties and political unrest in the country, Nepse gained a staggering 114.26 points (or up 11.17%) to close at 1137.03. It seems that the monetary policy is still playing a major role in causing the market to be bullish.', 'status' => true, 'publish_date' => '0000-00-00' ) ) ) $magazineCategory = array( 'MagazineCategory' => array( 'id' => '63', 'title' => 'Stock Taking', 'sortorder' => '516', 'status' => true, 'created' => '0000-00-00 00:00:00', 'homepage' => true, 'modified' => '2013-04-01 00:00:00' ) ) $magazineArticle = array( 'MagazineArticle' => array( 'id' => '953', 'magazine_issue_id' => '704', 'magazine_category_id' => '63', 'title' => 'Monthly Technical Analysis of Nepse October 2014', 'image' => null, 'short_content' => 'Nepal Stock Exchange (Nepse) index continued spiralling downwards during the August 19 to September 18, 2014 period, just like the preceding period. During the review period, Nepse fell by 134.5 points (-13 per cent) to close at 899.89 points.', 'status' => true, 'publish_date' => '0000-00-00' ) ) $issue_title = array() $width = (int) 400 $height = (int) 230 $ratio = (float) 1.7391304347826 $img_width = (int) 160 $img_height = (float) 92include - APP/View/MagazineArticles/category.ctp, line 86 View::_evaluate() - CORE/Cake/View/View.php, line 971 View::_render() - CORE/Cake/View/View.php, line 933 View::render() - CORE/Cake/View/View.php, line 473 Controller::render() - CORE/Cake/Controller/Controller.php, line 968 Dispatcher::_invoke() - CORE/Cake/Routing/Dispatcher.php, line 200 Dispatcher::dispatch() - CORE/Cake/Routing/Dispatcher.php, line 167 [main] - APP/webroot/index.php, line 117
Notice (8): Trying to access array offset on value of type null [APP/View/MagazineArticles/category.ctp, line 86]Code Context<div class="category"><span class="label label-danger"><?php echo $this->Html->link($issue_title['MagazineIssue']['title'],$viewFile = '/var/www/html/newbusinessage.com/app/View/MagazineArticles/category.ctp' $dataForView = array( 'current_user' => null, 'logged_in' => false ) $current_user = null $logged_in = false $cat_id = '63' $magazineArticles = array( (int) 0 => array( 'MagazineArticle' => array( 'id' => '2742', 'magazine_issue_id' => '1006', 'magazine_category_id' => '63', 'title' => 'Monthly Technical Analysis (November 24th -December 19th 2019)', 'image' => '20201010020410_Clipboard30.jpg', 'short_content' => 'NEPSE index gained 39.57 points (or up 3.56 %) to close at 1149.65 last month. Last month 50 days moving average of NEPSE was crossed from below which showed short term bull. However, NEPSE is trading below 200 days moving average which shows that overall long term sentiment is still bearish.', 'status' => true, 'publish_date' => null ) ), (int) 1 => array( 'MagazineArticle' => array( 'id' => '2508', 'magazine_issue_id' => '998', 'magazine_category_id' => '63', 'title' => 'Monthly Technical Analysis of Nepse March 24th 2019 – April 22th 2019', 'image' => '20190511100832_Clipboard24.jpg', 'short_content' => 'NEPSE gained 116.34 points (or up 10.20%) to close at 1250.94 last month that ended on April 22. Last month, NEPSE showed a bullish momentum breaking the resistance level of 200 days moving average. Currently, NEPSE is trading above the 50 days moving average and 200 days moving average. The average daily volume turnover has increased to NPR 53.01 crores from NPR 30.26 crores', 'status' => true, 'publish_date' => null ) ), (int) 2 => array( 'MagazineArticle' => array( 'id' => '2464', 'magazine_issue_id' => '997', 'magazine_category_id' => '63', 'title' => 'Monthly Technical Analysis of Nepse (February 27th 2019 – March 21th 2019)', 'image' => '20190403054014_1111.jpg', 'short_content' => 'NEPSE gained 38.04 points (or up 3.45%) to close at 1140.6 last month. At the beginning of month, NEPSE showed a bullish momentum breaking the resistance level of 50 days moving average.', 'status' => true, 'publish_date' => null ) ), (int) 3 => array( 'MagazineArticle' => array( 'id' => '2429', 'magazine_issue_id' => '996', 'magazine_category_id' => '63', 'title' => 'Monthly Technical Analysis of Nepse (January 26rd 2019 – February 16th 2019)', 'image' => '20190307122140_Clipboard04.jpg', 'short_content' => 'NEPSE index lost 85.21 points (or down 7.17%) to close at 1102.56 last month. Currently, NEPSE is trading below the 200 days moving average. At the beginning of the month, NEPSE breached the support level of 50 days moving average and traded below the 50 days moving average. ', 'status' => true, 'publish_date' => null ) ), (int) 4 => array( 'MagazineArticle' => array( 'id' => '2403', 'magazine_issue_id' => '995', 'magazine_category_id' => '63', 'title' => 'Monthly Technical Analysis of Nepse (December 23rd 2018 – January 17th 2019)', 'image' => '20190215124248_Clipboard07.jpg', 'short_content' => 'NEPSE index gained 21.8 (or up 1.87%) to close at 1187.77 last month. At the beginning of last month, NEPSE index showed bullish momentum by breaching the resistance of 50 days moving average. However, NEPSE index could not breach the 200 days moving average and retraced back forming a shooting star candle. Currently, NEPSE is trading above 50 days moving average and below 200 days moving says average.', 'status' => true, 'publish_date' => null ) ), (int) 5 => array( 'MagazineArticle' => array( 'id' => '2359', 'magazine_issue_id' => '993', 'magazine_category_id' => '63', 'title' => 'Monthly Technical Analysis of Nepse (November 25, 2018 – December 20, 2018)', 'image' => '20190110065454_Clipboard10.jpg', 'short_content' => 'NEPSE index lost 15.27 (or down 1.293%) to close at 1165.97 last month. Currently, the index is trading below the 50 days moving average and 200 days moving average. During the course of last month, NEPSE index breached the support level of 1150, reached the low level of 1120.84 forming a spinning bottom and bounced back to close at 1165.97.', 'status' => true, 'publish_date' => '2019-01-10' ) ), (int) 6 => array( 'MagazineArticle' => array( 'id' => '2325', 'magazine_issue_id' => '992', 'magazine_category_id' => '63', 'title' => 'Monthly Technical Analysis of Nepse (October 26, 2018 – November 22, 2018)', 'image' => null, 'short_content' => 'NEPSE index lost 59.70 (or down 4.81%) to close at 1181.41 last month. Currently, the index is trading below the 50 days moving average and 200 days moving average. NEPSE breached the support level of 50 days moving average.', 'status' => true, 'publish_date' => '0000-00-00' ) ), (int) 7 => array( 'MagazineArticle' => array( 'id' => '2294', 'magazine_issue_id' => '991', 'magazine_category_id' => '63', 'title' => 'Monthly Technical Analysis of Nepse (September 26th 2018 – October 25th 2018)', 'image' => null, 'short_content' => 'NEPSE index lost 36.63 (or down 2.867%) to close at 1241.11 last month. Currently, the index is trading above the 50 days moving average. However, the index is still moving below 200 days moving average.', 'status' => true, 'publish_date' => '0000-00-00' ) ), (int) 8 => array( 'MagazineArticle' => array( 'id' => '2264', 'magazine_issue_id' => '990', 'magazine_category_id' => '63', 'title' => 'Monthly Technical Analysis of Nepse (August 26th 2018 – September 26th 2018)', 'image' => null, 'short_content' => 'NEPSE index experienced high volatility in the course of last month. It gained 102.02 (or up 8.68%) to close at 1277.74 last month. Currently, the index is trading above 50 days moving average. However, the index is still moving below 200-day moving average. ', 'status' => true, 'publish_date' => '0000-00-00' ) ), (int) 9 => array( 'MagazineArticle' => array( 'id' => '2232', 'magazine_issue_id' => '989', 'magazine_category_id' => '63', 'title' => 'Monthly Technical Analysis of Nepse (July 22nd 2018 - August 23rd 2018)', 'image' => null, 'short_content' => 'Nepse index lost 3.16 points (or down0.27%) to close at 1178.5 last month. The index continues to trade below50-day moving average and 200-day moving average indicating bearish momentum in the market. The average volume turnover decreased to Rs 22.51crores from Rs 29.66 crores the month prior.', 'status' => true, 'publish_date' => '0000-00-00' ) ), (int) 10 => array( 'MagazineArticle' => array( 'id' => '2220', 'magazine_issue_id' => '988', 'magazine_category_id' => '63', 'title' => 'Monthly Technical Analysis of Nepse (June 24th 2018 - July 22th 2018)', 'image' => null, 'short_content' => 'The benchmark index declined in the course of last month. Nepse decreased by 36.80 points (or down 3.02%) to close at 1181.66. The index continues to trade below 50-day moving average and 200-day moving average indicating bearish momentum in the market.', 'status' => true, 'publish_date' => '0000-00-00' ) ), (int) 11 => array( 'MagazineArticle' => array( 'id' => '2171', 'magazine_issue_id' => '987', 'magazine_category_id' => '63', 'title' => 'Monthly Technical Analysis of Nepse (May25th 2018 - June 21th 2018)', 'image' => null, 'short_content' => 'The benchmark index declined in the course of last month. Nepse decreased by 99.76 points (or down 7.57%) to close at 1218.46. The index breached 50-day moving average and still trading below 200-day moving average indicating bearish momentum in the market. ', 'status' => true, 'publish_date' => '0000-00-00' ) ), (int) 12 => array( 'MagazineArticle' => array( 'id' => '2147', 'magazine_issue_id' => '986', 'magazine_category_id' => '63', 'title' => 'Monthly Technical Analysis of Nepse (April 25th 2018 - May 24th 2018)', 'image' => null, 'short_content' => 'The benchmark index declined in the course of last month. Nepse decreased by 76.64 points (or down 4.90%) to close at 1318.22.The index moved towards 50-day moving average and still remains below the 200-day moving average. ', 'status' => true, 'publish_date' => '0000-00-00' ) ), (int) 13 => array( 'MagazineArticle' => array( 'id' => '2110', 'magazine_issue_id' => '985', 'magazine_category_id' => '63', 'title' => 'Monthly Technical Analysis of Nepse (March 22nd 2018 – April 24th 2018)', 'image' => null, 'short_content' => 'The benchmark index surged up in the course of last month. Nepse increased by a staggering 163.79 points (or up 12.97%) to close at 1394.86. The index crossed above the 50-day moving average, giving a bullish signal. However, the index still remains below the 200-day MA. New investors entering the market, as well as optimism regarding the implementation of online trading platform, has created this bullish trigger. ', 'status' => true, 'publish_date' => '0000-00-00' ) ), (int) 14 => array( 'MagazineArticle' => array( 'id' => '2089', 'magazine_issue_id' => '984', 'magazine_category_id' => '63', 'title' => 'Monthly Technical Analysis of Nepse (25 February to 21 March 2018)', 'image' => null, 'short_content' => 'The benchmark index continued its downfall in the course of last month. Nepse declined by a staggering 115.97 points (or down 11.78%) to close at 1231.01. The index moving below the 50-day and the 200-day moving average indicates bearish momentum in the market. ', 'status' => true, 'publish_date' => '0000-00-00' ) ), (int) 15 => array( 'MagazineArticle' => array( 'id' => '2062', 'magazine_issue_id' => '983', 'magazine_category_id' => '63', 'title' => 'Monthly Technical Analysis of Nepse (23 January to 22 February 2018)', 'image' => null, 'short_content' => 'The benchmark index continued its downfall in the course of last month. Nepse declined by 15.11 points (or down 1.02%) to close at 1386.98. The index moving below the 50-day and the 200-day moving average indicates bearish momentum in the market.', 'status' => true, 'publish_date' => '0000-00-00' ) ), (int) 16 => array( 'MagazineArticle' => array( 'id' => '2035', 'magazine_issue_id' => '982', 'magazine_category_id' => '63', 'title' => 'Monthly Technical Analysis of Nepse (24 December 2017 to 22 January 2018)', 'image' => null, 'short_content' => 'The benchmark index fell by 70.06 points (or down 4.75%) to close at 1402.09 last month. The index continued to move below the 50-day and the 200-day moving average, indicating a bearish momentum in the market. The market will likely remain bearish as the banks continue to face liquidity crunch.', 'status' => true, 'publish_date' => '0000-00-00' ) ), (int) 17 => array( 'MagazineArticle' => array( 'id' => '2011', 'magazine_issue_id' => '981', 'magazine_category_id' => '63', 'title' => 'Monthly Technical Analysis of Nepse (26 November to 21 December 2017)', 'image' => null, 'short_content' => 'The benchmark index fell by 21.14 points (or down 1.38%) to close at 1472.15 last month. The index has moved below the 50-day, as well as 200-day moving average, giving a bearish signal. Completion of the election at the beginning of the month did little to create bullish sentiment in the market.', 'status' => true, 'publish_date' => '0000-00-00' ) ), (int) 18 => array( 'MagazineArticle' => array( 'id' => '1982', 'magazine_issue_id' => '980', 'magazine_category_id' => '63', 'title' => 'Monthly Technical Analysis of Nepse (22 October to 23 November 2017)', 'image' => null, 'short_content' => 'The benchmark index fell by 75.06 points (or down 4.83%) to close at 1493.29 last month. The index is hovering below the 50-day, as well as the 200-day moving average. This shows the market to be in a bearish mode in the course of last month.', 'status' => true, 'publish_date' => '0000-00-00' ) ), (int) 19 => array( 'MagazineArticle' => array( 'id' => '1950', 'magazine_issue_id' => '979', 'magazine_category_id' => '63', 'title' => 'Monthly Technical Analysis of Nepse (20 September to 18 October 2017)', 'image' => null, 'short_content' => 'The benchmark index gained a modest 24.65 points (or up 1.67%) to close at 1568.35 last month. The index continues to move close to the 200-day moving average, which acts as a support level to the index. Favorable political outlook has triggered a bullish sentiment in the market. ', 'status' => true, 'publish_date' => '0000-00-00' ) ), (int) 20 => array( 'MagazineArticle' => array( 'id' => '1933', 'magazine_issue_id' => '978', 'magazine_category_id' => '63', 'title' => 'Monthly Technical Analysis of Nepse (22 August to 18 September 2017)', 'image' => null, 'short_content' => 'The benchmark index lost 67.87 points (or down 4.20%) to close at 1543.7 last month. The index fell below the 50-day, as well as 200-day moving average, which shows bearish sentiment in the market.', 'status' => true, 'publish_date' => '0000-00-00' ) ), (int) 21 => array( 'MagazineArticle' => array( 'id' => '1897', 'magazine_issue_id' => '977', 'magazine_category_id' => '63', 'title' => 'Monthly Technical Analysis of Nepse (25 July to 21 August 2017)', 'image' => null, 'short_content' => 'The benchmark index lost 17.51 points (or down 1.06%) to close at 1611.57 last month. The index remains above the 50-day, as well as 200 day moving average, signaling the market to be bullish. However, Nepse hovering close to the 50-day MA will test the respective MA for support level.', 'status' => true, 'publish_date' => '0000-00-00' ) ), (int) 22 => array( 'MagazineArticle' => array( 'id' => '1866', 'magazine_issue_id' => '976', 'magazine_category_id' => '63', 'title' => ' Monthly Technical Analysis of Nepse (25 June to 24 July 2017)', 'image' => null, 'short_content' => 'The benchmark index gained 69.59 points (or up 4.44%) to close at 1629.08 last month. Events such as release of monetary policy and talks regarding online trading system were witnessed in the course of last month. ', 'status' => true, 'publish_date' => '0000-00-00' ) ), (int) 23 => array( 'MagazineArticle' => array( 'id' => '1848', 'magazine_issue_id' => '975', 'magazine_category_id' => '63', 'title' => 'Monthly Technical Analysis of Nepse (28 May to 22 June 2017)', 'image' => null, 'short_content' => 'The benchmark index continued to fall in the course of last month. It declined by 70.09 points (or down -4.32%) last month to close at 1559.49. The index fell below the 50-day, as well as the 200-day moving average, giving a bearish signal.', 'status' => true, 'publish_date' => '0000-00-00' ) ), (int) 24 => array( 'MagazineArticle' => array( 'id' => '1801', 'magazine_issue_id' => '974', 'magazine_category_id' => '63', 'title' => 'Monthly Technical Analysis of Nepse (26 April to 24 May 2017)', 'image' => null, 'short_content' => 'The benchmark index declined from 1670.3 to 1629.58 in the course of last month. Its new support and resistance level stands at 1612 and 1780 level respectively. With no new bullish trigger, the index will likely test the new support level', 'status' => true, 'publish_date' => '0000-00-00' ) ), (int) 25 => array( 'MagazineArticle' => array( 'id' => '1780', 'magazine_issue_id' => '973', 'magazine_category_id' => '63', 'title' => 'Monthly Technical Analysis of Nepse (27 March to 25 April 2017)', 'image' => null, 'short_content' => 'The benchmark index continued its bullish run in the course of last month. Nepse gained 138.55 points (or up 9.08%) to close at 1672.38. Several factors supported the bullish momentum in the market. Positive political state of affairs, as well as Insurance Board’s directive to increase insurance capital,', 'status' => true, 'publish_date' => '0000-00-00' ) ), (int) 26 => array( 'MagazineArticle' => array( 'id' => '1753', 'magazine_issue_id' => '972', 'magazine_category_id' => '63', 'title' => 'Monthly Technical Analysis of Nepse (22 February to 26 March 2017)', 'image' => null, 'short_content' => 'The benchmark index experienced a remarkable climb in the course of last month. The index gained a staggering 176.26 points (or up 12.44%) to close at 1533.83. Gradual decrease in interest rates and positive hopes for political scenario seems to have caused a bullish trigger in the market. ', 'status' => true, 'publish_date' => '0000-00-00' ) ), (int) 27 => array( 'MagazineArticle' => array( 'id' => '1732', 'magazine_issue_id' => '971', 'magazine_category_id' => '63', 'title' => 'Monthly Technical Analysis of Nepse (20 January to 21 February 2017)', 'image' => null, 'short_content' => 'The benchmark index took a bearish ride at the beginning of last month, dropping as low as 1252.5 level. In the course of the month, Nepse lost a staggering 104.99 points (or down -6.93%) to close at 1357.57. Uncertain political environment and higher fixed deposit rate by the banks continues to create bearish sentiment in the market.', 'status' => true, 'publish_date' => '0000-00-00' ) ), (int) 28 => array( 'MagazineArticle' => array( 'id' => '1702', 'magazine_issue_id' => '970', 'magazine_category_id' => '63', 'title' => 'Nepse in Consolidation Stage', 'image' => null, 'short_content' => 'The benchmark indexcontinued to decline in the course of last month. The index lost 12.85 points (or down 0.87%) to close at 1462.56. Nepse continues to hover below the 200-day moving ..', 'status' => true, 'publish_date' => '0000-00-00' ) ), (int) 29 => array( 'MagazineArticle' => array( 'id' => '1650', 'magazine_issue_id' => '968', 'magazine_category_id' => '63', 'title' => 'Monthly Technical Analysis of Nepse (3 November to 30 November 2016)', 'image' => null, 'short_content' => 'The benchmark index experienced high volatility and bearish downturn in the course of last month. The index lost a staggering 151.38 points (or down 8.60%) to close at 1608.33. ', 'status' => true, 'publish_date' => '0000-00-00' ) ), (int) 30 => array( 'MagazineArticle' => array( 'id' => '1623', 'magazine_issue_id' => '967', 'magazine_category_id' => '63', 'title' => 'Monthly Technical Analysis of Nepse (23 September to 27 October 2016)', 'image' => null, 'short_content' => 'The benchmark index climbed up during the first half of last month. However, it took a U-turn during the second half of the month, indicating a bearish presence in the market. The index lost 7.2 points (or down 0.34%) last month to close at 1759.71. ', 'status' => true, 'publish_date' => '0000-00-00' ) ), (int) 31 => array( 'MagazineArticle' => array( 'id' => '1598', 'magazine_issue_id' => '966', 'magazine_category_id' => '63', 'title' => 'Monthly Technical Analysis of Nepse (28 August to 22 September 2016)', 'image' => null, 'short_content' => 'The benchmark index experienced a bullish run during the first half of last month. However, the second half of the month was triggered by a bearish momentum. Nepse gained 36.29 points (or up 2.12%) last month to close at 1766.91. ', 'status' => true, 'publish_date' => '0000-00-00' ) ), (int) 32 => array( 'MagazineArticle' => array( 'id' => '1567', 'magazine_issue_id' => '965', 'magazine_category_id' => '63', 'title' => 'Monthly Technical Analysis of Nepse (31 July to 25 August 2016)', 'image' => null, 'short_content' => 'The benchmark index went through high volatility last month. The index lost a staggering 147.31 points (or down -7.72%) to close at 1730.62. Nepse lost 202.02 points during the first half of the month. The index hit a negative, as well as positive circuit break during the middle of the month, as nervousness became apparent in the market. ', 'status' => true, 'publish_date' => '0000-00-00' ) ), (int) 33 => array( 'MagazineArticle' => array( 'id' => '1543', 'magazine_issue_id' => '964', 'magazine_category_id' => '63', 'title' => 'Monthly Technical Analysis of Nepse (28 June to 28 July 2016)', 'image' => null, 'short_content' => 'The benchmark index saw tremendous growth in the course of last month. The index gained 165.09 points (or up 7.86%) to close at 1877.93. Various policies and economic scenarios have supported the bullish sentiment in the market.', 'status' => true, 'publish_date' => '0000-00-00' ) ), (int) 34 => array( 'MagazineArticle' => array( 'id' => '1531', 'magazine_issue_id' => '963', 'magazine_category_id' => '63', 'title' => ' Monthly Technical Analysis of Nepse (26 May to 27 June 2016)', 'image' => null, 'short_content' => 'The benchmark index created history by breaking the 1600 and 1700 mark in the course of last month. The index gained a staggering 197.65 points (or up 12.34%) to close at 1721.77. The Insurance and Hydropower sectors have caused the market to climb further up', 'status' => true, 'publish_date' => '0000-00-00' ) ), (int) 35 => array( 'MagazineArticle' => array( 'id' => '1505', 'magazine_issue_id' => '962', 'magazine_category_id' => '63', 'title' => 'Monthly Technical Analysis of Nepse (2 May to 25 May 2016)', 'image' => null, 'short_content' => 'The benchmark index continues to create new heights as the bullish momentum is driving the market upward. The index gained 59.21 points (or up 4.01%) to close at 1524.12 in the course of last month. The market did correct itself during the course of the week. ', 'status' => true, 'publish_date' => '0000-00-00' ) ), (int) 36 => array( 'MagazineArticle' => array( 'id' => '1481', 'magazine_issue_id' => '961', 'magazine_category_id' => '63', 'title' => 'Monthly Technical Analysis of Nepse (28 March to 28 April 2016)', 'image' => null, 'short_content' => 'The benchmark index continued its upward climb last month as well. Nepse index gained 87.58 points (or up 6.21%) to close at an all time height of 1464.91. The index witnessed some corrections at the beginning of the month, as it declined by 25.79 points.', 'status' => true, 'publish_date' => '0000-00-00' ) ), (int) 37 => array( 'MagazineArticle' => array( 'id' => '1449', 'magazine_issue_id' => '959', 'magazine_category_id' => '63', 'title' => ' Monthly Technical Analysis of Nepse (31 January to 25 February 2016)', 'image' => null, 'short_content' => 'The benchmark index scaled up further in the course of last month. Nepse index gained a staggering 67.41 points (or up 5.43%) to close at 1283.52. The index is moving well above the 50-day moving average (MA) and 200-day MA, indicating that the overall market outlook looks good.', 'status' => true, 'publish_date' => '0000-00-00' ) ), (int) 38 => array( 'MagazineArticle' => array( 'id' => '1432', 'magazine_issue_id' => '958', 'magazine_category_id' => '63', 'title' => ' Monthly Technical Analysis of Nepse (27 December, 2015 to 28 January 2016)', 'image' => null, 'short_content' => 'The benchmark index increased further in the course of last month. The Nepse index gained a staggering 79.08 points (or up 6.77%) to close at 1216.11. Few reasons have caused the market to be bullish last month. Firstly, the bullish momentum was triggered by an increase in the demand in the insurance sector.', 'status' => true, 'publish_date' => '0000-00-00' ) ), (int) 39 => array( 'MagazineArticle' => array( 'id' => '1380', 'magazine_issue_id' => '956', 'magazine_category_id' => '63', 'title' => 'Monthly Technical Analysis of Nepse (1 November to 26 November, 2015)', 'image' => null, 'short_content' => 'or the first half of the month, the benchmark index moved sideways, hovering above its immediate support level of 1084. The index then reached a high level of 1109. However, for the second half of the month the index spiraled downwards, losing 48.03 points (or down 4.43%).', 'status' => true, 'publish_date' => '0000-00-00' ) ), (int) 40 => array( 'MagazineArticle' => array( 'id' => '1363', 'magazine_issue_id' => '955', 'magazine_category_id' => '63', 'title' => 'Why S&P 500 is expected to make an important low on 26th November, 2015 at 13:43 NEWYORK TIME ?', 'image' => '20151125121943_st.jpg', 'short_content' => 'You will see every time when the planet Venus travels the sign of Libra at 19.48 degree, the S&P makes an important low there. Not once or twice or thrice, but in year 2010, 2011, 2012, 2013 and 2014 – five years in a row - it was right on the spot and the next date is 26th November,2015.', 'status' => true, 'publish_date' => '0000-00-00' ) ), (int) 41 => array( 'MagazineArticle' => array( 'id' => '1324', 'magazine_issue_id' => '954', 'magazine_category_id' => '63', 'title' => 'Forecasting Gold Prices with Astrology’s Help ', 'image' => null, 'short_content' => 'Gold is ruled by the planet Sun and the sign Leo. When a benefic planet transits Leo and at the same time casts good aspects to the Sun or when it casts a good aspect to Leo from other signs the value of gold rises. ', 'status' => true, 'publish_date' => '0000-00-00' ) ), (int) 42 => array( 'MagazineArticle' => array( 'id' => '1338', 'magazine_issue_id' => '954', 'magazine_category_id' => '63', 'title' => 'Market Gone Flat after Breaching Record (Review for 25 August to 24 September, 2015)', 'image' => null, 'short_content' => 'The secondary market touched the historic high during the review period ahead of the promulgation of the long awaited new constitution. But after the constitution was promulgated, it shed some of the gains and remains flat then after. ', 'status' => true, 'publish_date' => '0000-00-00' ) ), (int) 43 => array( 'MagazineArticle' => array( 'id' => '1346', 'magazine_issue_id' => '954', 'magazine_category_id' => '63', 'title' => 'Monthly Technical Analysis of Nepse (23 August to 24 September, 2015)', 'image' => null, 'short_content' => 'Nepse index followed a sideways movement for most of last month. The benchmark index tested the 1200 mark three times in the course of previous month. On 15th September, Nepse reached its all time high of 1205.84 level. The current trend shows Nepse to be falling faintly, creating lower low in the support zone. ', 'status' => true, 'publish_date' => '0000-00-00' ) ), (int) 44 => array( 'MagazineArticle' => array( 'id' => '1294', 'magazine_issue_id' => '953', 'magazine_category_id' => '63', 'title' => 'The Most Awaited Trade of 2015', 'image' => null, 'short_content' => 'This trade is probably the most awaited trade of 2015. The entire world is anxious to know when the US stock indices are going to stop their unstoppable bull rally which started in 2009.', 'status' => true, 'publish_date' => '0000-00-00' ) ), (int) 45 => array( 'MagazineArticle' => array( 'id' => '1312', 'magazine_issue_id' => '953', 'magazine_category_id' => '63', 'title' => 'Rise and Rise of Nepse (Review for 23 July to 20 August, 2015)', 'image' => null, 'short_content' => 'Nepal’s Capital Market set the history’s new high during the review period as positive sentiments towards banking stocks led all the sectors. The benchmark Nepse index touched 1200.92 adding 197.54 points in the review period while the session’s low was at the opening (23 July) with 1003.38.', 'status' => true, 'publish_date' => '0000-00-00' ) ), (int) 46 => array( 'MagazineArticle' => array( 'id' => '1313', 'magazine_issue_id' => '953', 'magazine_category_id' => '63', 'title' => 'Monthly Technical Analysis of Nepse (26 July to 20 August, 2015) ', 'image' => null, 'short_content' => 'Nepse witnessed remarkable gains in the course of last month. The benchmark index rose by 197.54 points (or up 18.31%). It surpassed its previous resistance levels of 1036.98 and 1100 points and is moving well above the 50-day and 200-day moving average, and at a much higher rate, indicating a bullish outlook.', 'status' => true, 'publish_date' => '0000-00-00' ) ), (int) 47 => array( 'MagazineArticle' => array( 'id' => '1265', 'magazine_issue_id' => '952', 'magazine_category_id' => '63', 'title' => 'Stay Alert from September 14 to October 14', 'image' => null, 'short_content' => 'In our article, “Millionaires don’t use astrology but billionaires do” written on March 31 2015 and published in the May, 2015 issue of New Business Age we forecasted that: ', 'status' => true, 'publish_date' => '0000-00-00' ) ), (int) 48 => array( 'MagazineArticle' => array( 'id' => '1244', 'magazine_issue_id' => '928', 'magazine_category_id' => '63', 'title' => 'Moving Sideways', 'image' => null, 'short_content' => 'As the earthquake has destroyed property and hampered trade, consumption, investment and living patterns of the people, business activities have been hampered. However, the exact loss can be assesses only after the coming quarterly reports of the listed companies.', 'status' => true, 'publish_date' => '0000-00-00' ) ), (int) 49 => array( 'MagazineArticle' => array( 'id' => '1245', 'magazine_issue_id' => '928', 'magazine_category_id' => '63', 'title' => 'Are We Ready for the Next Stock Market Crash?', 'image' => null, 'short_content' => 'In US stock market history, so far we have seen three big crashes. The first crash was on 28th October 1929, followed by the second on 19th October 1987 and the last crash was on 6th October 2008.', 'status' => true, 'publish_date' => '0000-00-00' ) ), (int) 50 => array( 'MagazineArticle' => array( 'id' => '1246', 'magazine_issue_id' => '928', 'magazine_category_id' => '63', 'title' => 'Smarten Your Approach to the Secondary Market', 'image' => null, 'short_content' => 'Before investing in the secondary market, take a breather and evaluate yourself. What is your type? Are you an investor or a trader?', 'status' => true, 'publish_date' => '0000-00-00' ) ), (int) 51 => array( 'MagazineArticle' => array( 'id' => '1247', 'magazine_issue_id' => '928', 'magazine_category_id' => '63', 'title' => 'Monthly Technical Analysis of Nepse (May 24 to June 23, 2015)', 'image' => null, 'short_content' => 'The aftermath of the earthquake caused Nepse index to fall by 10.70%. Nevertheless, the index increased soon enough, rising by 15.43% halfway through last month. Currently, Nepse is at a correction period.', 'status' => true, 'publish_date' => '0000-00-00' ) ), (int) 52 => array( 'MagazineArticle' => array( 'id' => '1193', 'magazine_issue_id' => '889', 'magazine_category_id' => '63', 'title' => '11.47 Points Fall Ahead of Q3 Results', 'image' => null, 'short_content' => 'Most of the stocks turned red during the review period (Feb 18 - March 19) pushing the index to nearly two months low. The Nepse index closed in red losing 15.03 points or 1.53% to settle at 967.62. The index touched highest level on 9 March with 988.77 and the lowest was 959.14 on 16 March. ', 'status' => true, 'publish_date' => '0000-00-00' ) ), (int) 53 => array( 'MagazineArticle' => array( 'id' => '1194', 'magazine_issue_id' => '889', 'magazine_category_id' => '63', 'title' => 'Monthly Technical Analysis of Nepse (March 19 to April 23, 2015) : At Lowest Volatility of the Year', 'image' => null, 'short_content' => 'RSI is a form of leading indicator that is believed to be most effective during periods of sideways movement. Such indicators may create numerous buy and sell signals that are useful when the market is not clearly trending upwards or downwards. ', 'status' => true, 'publish_date' => '0000-00-00' ) ), (int) 54 => array( 'MagazineArticle' => array( 'id' => '1166', 'magazine_issue_id' => '863', 'magazine_category_id' => '63', 'title' => 'Market @ Two Months’ Low', 'image' => null, 'short_content' => 'Most of the stocks turned red during the review period (Feb 18 - March 19) pushing the index to nearly two months low. The Nepse index closed in red losing 15.03 points or 1.53% to settle at 967.62. The index touched highest level on 9 March with 988.77 and the lowest was 959.14 on 16 March. ', 'status' => true, 'publish_date' => '0000-00-00' ) ), (int) 55 => array( 'MagazineArticle' => array( 'id' => '1167', 'magazine_issue_id' => '863', 'magazine_category_id' => '63', 'title' => 'Technical Analysis Monthly (February 19 to March 19, 2015) Bearish Signals', 'image' => null, 'short_content' => ' Nepse has not made much improvement in the past 30 days as compared to the growth witnessed in the previous months. Nepse decreased by -19.43 points (or -1.95%) to close at 967.62 points. It fell below its support level of 972.17, which is now its new resistance level. ', 'status' => true, 'publish_date' => '0000-00-00' ) ), (int) 56 => array( 'MagazineArticle' => array( 'id' => '1139', 'magazine_issue_id' => '839', 'magazine_category_id' => '63', 'title' => 'Nepse Slows Down', 'image' => null, 'short_content' => 'The secondary market of Nepal stalled after reaching nearly six months high while political uncertainties compelled the investors to wait-and-watch. The benchmark Nepse index added 7.20 points or 0.74 per cent to rest at 982.62. ', 'status' => true, 'publish_date' => '0000-00-00' ) ), (int) 57 => array( 'MagazineArticle' => array( 'id' => '1140', 'magazine_issue_id' => '839', 'magazine_category_id' => '63', 'title' => 'Technical Analysis Monthly (Jan 20, 14 – Feb 19, 15) : Bullish Signal for Long Term', 'image' => null, 'short_content' => 'After the huge gains witnessed in the previous periods, Nepse remained almost flat during the past 30 days. However, there was an overall positive gain in the market as Nepse increased by 7.2 points (or 0.74%) to close at 982.65 points.', 'status' => true, 'publish_date' => '0000-00-00' ) ), (int) 58 => array( 'MagazineArticle' => array( 'id' => '1108', 'magazine_issue_id' => '811', 'magazine_category_id' => '63', 'title' => 'Waiting for Confirmation Signal', 'image' => null, 'short_content' => 'Nepal’s secondary market turned little green with hopes that agreement between major political parties on contentious issues of new constitution was underway. The Nepse index accelerated 66.19 points or 7.38 per cent to close at 962.80. ', 'status' => true, 'publish_date' => '0000-00-00' ) ), (int) 59 => array( 'MagazineArticle' => array( 'id' => '1109', 'magazine_issue_id' => '811', 'magazine_category_id' => '63', 'title' => 'Technical Analysis Monthly (Dec 21, 2014 to Jan 20, 2015)', 'image' => null, 'short_content' => 'Giving continuity to the previous period’s positive momentum, Nepse has been able to make remarkable gains during this period. The stock market moved past its strong resistance level of 938.41 to close at 962.8 points – an increase of 58.91 points or 6.52 per cent.', 'status' => true, 'publish_date' => '0000-00-00' ) ), (int) 60 => array( 'MagazineArticle' => array( 'id' => '1064', 'magazine_issue_id' => '783', 'magazine_category_id' => '63', 'title' => 'Politics Still a Factor', 'image' => null, 'short_content' => 'Most of the listed companies have declared their dividends and few others are about to make these announcements. This means that the price adjustment of the stock after dividend declaration has also played role in driving the prices lower for such few companies. ', 'status' => true, 'publish_date' => '0000-00-00' ) ), (int) 61 => array( 'MagazineArticle' => array( 'id' => '1065', 'magazine_issue_id' => '783', 'magazine_category_id' => '63', 'title' => 'Technical Analysis Monthly (Nov 21 – Dec 20) : Fighting 916 Resistance', 'image' => null, 'short_content' => 'There was significant sideways movement in Nepse in the period between Nov 21, 2014 and Dec 20, 2014. The immediate support level of 844.42 was tested three times while the imme-diate resistance level of 875.56 was tested once in the review period.', 'status' => true, 'publish_date' => '0000-00-00' ) ), (int) 62 => array( 'MagazineArticle' => array( 'id' => '1036', 'magazine_issue_id' => '756', 'magazine_category_id' => '63', 'title' => 'Market Dips to 6 Months Low', 'image' => null, 'short_content' => 'The stock market of Nepal plunged to 6 months low in the review period as gloomy political winter cooled investors’ sentiment. The Nepse index lost 61.84 points or 6.69% to rest at 862.5 while the session’s high was on 27 Oct with 935.01 and lowest was on 18 Nov with 844.06. ', 'status' => true, 'publish_date' => '0000-00-00' ) ), (int) 63 => array( 'MagazineArticle' => array( 'id' => '1037', 'magazine_issue_id' => '756', 'magazine_category_id' => '63', 'title' => 'Technical Analysis Monthly (Oct 20 – Nov 20)', 'image' => null, 'short_content' => 'Since Nepse peaked at 1083.55 points on July 21, 2014, the stock market has been following a bearish pattern. Though the markets stabilized and saw a 2.88% rebound during the last trading period, overall Nepse has continued its downward trend', 'status' => true, 'publish_date' => '0000-00-00' ) ), (int) 64 => array( 'MagazineArticle' => array( 'id' => '1038', 'magazine_issue_id' => '756', 'magazine_category_id' => '63', 'title' => 'Ups and Downs in Nepali Stock Market', 'image' => null, 'short_content' => 'Ups and downs in the indicators of the stock market are a regular phenomenon. The market goes up when more investors exercise for buying stocks and slips down when more investors are in the mood to sell their shares. If they quickly want to exit from the market,', 'status' => true, 'publish_date' => '0000-00-00' ) ), (int) 65 => array( 'MagazineArticle' => array( 'id' => '992', 'magazine_issue_id' => '730', 'magazine_category_id' => '63', 'title' => 'Market Stalled after Losing Steam', 'image' => null, 'short_content' => 'The Nepali stock market remained stable during the review period despite the recent sharp fall. The benchmark Nepse index added 3.71 points or 0.40% to reach 923.59 while the session’s high was on 30 September with 937.99 and lowest was on 22 September with 881.87. ', 'status' => true, 'publish_date' => '0000-00-00' ) ), (int) 66 => array( 'MagazineArticle' => array( 'id' => '993', 'magazine_issue_id' => '730', 'magazine_category_id' => '63', 'title' => 'Monthly Technical Analysis of Nepse November 2014', 'image' => null, 'short_content' => 'After two continuous trading periods of huge declines, Nepse has stabilized in recent times. Compared to the previous period, Nepse made an upward gain of 25.96 points (or 2.88%) closing at 925.85 points. ', 'status' => true, 'publish_date' => '0000-00-00' ) ), (int) 67 => array( 'MagazineArticle' => array( 'id' => '994', 'magazine_issue_id' => '730', 'magazine_category_id' => '63', 'title' => 'Privatization, Corporatization and Strategic Partner for NEPSE', 'image' => null, 'short_content' => 'Historically stock exchanges started as a mutually governed, non-profit making, self-regulated cooperative like structures. Mostly brokers were the owners of such exchanges. However, due to the change in the technology and the concept of securities commission as apex regulator', 'status' => true, 'publish_date' => '0000-00-00' ) ), (int) 68 => array( 'MagazineArticle' => array( 'id' => '920', 'magazine_issue_id' => '678', 'magazine_category_id' => '63', 'title' => 'The Big Retreat', 'image' => null, 'short_content' => 'The Nepali bourse cooled down after reaching a high of 1083.55 as selling pressure ruled the market. The benchmark Nepse index plummeted 61.35 points or 5.71% to close at 1013.6 while session’s high was on 21st July with 1083.55 and lowest on 18th August with 1013.25. ', 'status' => true, 'publish_date' => '0000-00-00' ) ), (int) 69 => array( 'MagazineArticle' => array( 'id' => '921', 'magazine_issue_id' => '678', 'magazine_category_id' => '63', 'title' => 'Monthly Technical Analysis of Nepse (July 21 - August 14, 2014)', 'image' => null, 'short_content' => 'On the first trading day of the review period the secondary market had witnessed the highest rise as the benchmark index settled at 1083.55 points, a new high since the last 6 years. On the same day Nepse had attained the highest turnover of NPR 1.20 billion on a single trading day in its history.', 'status' => true, 'publish_date' => '0000-00-00' ) ), (int) 70 => array( 'MagazineArticle' => array( 'id' => '952', 'magazine_issue_id' => '704', 'magazine_category_id' => '63', 'title' => 'The End of Bull Run', 'image' => null, 'short_content' => 'The stock market of Nepal which was predicted to break the previous historic high level of 1175.38 points pulled back from 1083.55 and witnessed a nose dive sessions. ', 'status' => true, 'publish_date' => '0000-00-00' ) ), (int) 71 => array( 'MagazineArticle' => array( 'id' => '953', 'magazine_issue_id' => '704', 'magazine_category_id' => '63', 'title' => 'Monthly Technical Analysis of Nepse October 2014', 'image' => null, 'short_content' => 'Nepal Stock Exchange (Nepse) index continued spiralling downwards during the August 19 to September 18, 2014 period, just like the preceding period. During the review period, Nepse fell by 134.5 points (-13 per cent) to close at 899.89 points.', 'status' => true, 'publish_date' => '0000-00-00' ) ), (int) 72 => array( 'MagazineArticle' => array( 'id' => '954', 'magazine_issue_id' => '704', 'magazine_category_id' => '63', 'title' => 'NRN Investment through Capital Market', 'image' => null, 'short_content' => '‘Economic Roadmap for Prosperous Nepal’ was the main theme of 8th NRN regional conference held on Nagano, Japan from September 18 to 19. About three hundred NRNs had participated from different part of the globe to discuss on the given theme. ', 'status' => true, 'publish_date' => '0000-00-00' ) ), (int) 73 => array( 'MagazineArticle' => array( 'id' => '1405', 'magazine_issue_id' => '957', 'magazine_category_id' => '63', 'title' => 'Monthly Technical Analysis of Nepse (29 November to 24 December, 2015)', 'image' => null, 'short_content' => 'The benchmark index saw huge changes in the course of last month. Despite all the difficulties and political unrest in the country, Nepse gained a staggering 114.26 points (or up 11.17%) to close at 1137.03. It seems that the monetary policy is still playing a major role in causing the market to be bullish.', 'status' => true, 'publish_date' => '0000-00-00' ) ) ) $magazineCategory = array( 'MagazineCategory' => array( 'id' => '63', 'title' => 'Stock Taking', 'sortorder' => '516', 'status' => true, 'created' => '0000-00-00 00:00:00', 'homepage' => true, 'modified' => '2013-04-01 00:00:00' ) ) $magazineArticle = array( 'MagazineArticle' => array( 'id' => '953', 'magazine_issue_id' => '704', 'magazine_category_id' => '63', 'title' => 'Monthly Technical Analysis of Nepse October 2014', 'image' => null, 'short_content' => 'Nepal Stock Exchange (Nepse) index continued spiralling downwards during the August 19 to September 18, 2014 period, just like the preceding period. During the review period, Nepse fell by 134.5 points (-13 per cent) to close at 899.89 points.', 'status' => true, 'publish_date' => '0000-00-00' ) ) $issue_title = array() $width = (int) 400 $height = (int) 230 $ratio = (float) 1.7391304347826 $img_width = (int) 160 $img_height = (float) 92include - APP/View/MagazineArticles/category.ctp, line 86 View::_evaluate() - CORE/Cake/View/View.php, line 971 View::_render() - CORE/Cake/View/View.php, line 933 View::render() - CORE/Cake/View/View.php, line 473 Controller::render() - CORE/Cake/Controller/Controller.php, line 968 Dispatcher::_invoke() - CORE/Cake/Routing/Dispatcher.php, line 200 Dispatcher::dispatch() - CORE/Cake/Routing/Dispatcher.php, line 167 [main] - APP/webroot/index.php, line 117
Notice (8): Undefined index: MagazineIssue [APP/View/MagazineArticles/category.ctp, line 86]Code Context<div class="category"><span class="label label-danger"><?php echo $this->Html->link($issue_title['MagazineIssue']['title'],$viewFile = '/var/www/html/newbusinessage.com/app/View/MagazineArticles/category.ctp' $dataForView = array( 'current_user' => null, 'logged_in' => false ) $current_user = null $logged_in = false $cat_id = '63' $magazineArticles = array( (int) 0 => array( 'MagazineArticle' => array( 'id' => '2742', 'magazine_issue_id' => '1006', 'magazine_category_id' => '63', 'title' => 'Monthly Technical Analysis (November 24th -December 19th 2019)', 'image' => '20201010020410_Clipboard30.jpg', 'short_content' => 'NEPSE index gained 39.57 points (or up 3.56 %) to close at 1149.65 last month. Last month 50 days moving average of NEPSE was crossed from below which showed short term bull. However, NEPSE is trading below 200 days moving average which shows that overall long term sentiment is still bearish.', 'status' => true, 'publish_date' => null ) ), (int) 1 => array( 'MagazineArticle' => array( 'id' => '2508', 'magazine_issue_id' => '998', 'magazine_category_id' => '63', 'title' => 'Monthly Technical Analysis of Nepse March 24th 2019 – April 22th 2019', 'image' => '20190511100832_Clipboard24.jpg', 'short_content' => 'NEPSE gained 116.34 points (or up 10.20%) to close at 1250.94 last month that ended on April 22. Last month, NEPSE showed a bullish momentum breaking the resistance level of 200 days moving average. Currently, NEPSE is trading above the 50 days moving average and 200 days moving average. The average daily volume turnover has increased to NPR 53.01 crores from NPR 30.26 crores', 'status' => true, 'publish_date' => null ) ), (int) 2 => array( 'MagazineArticle' => array( 'id' => '2464', 'magazine_issue_id' => '997', 'magazine_category_id' => '63', 'title' => 'Monthly Technical Analysis of Nepse (February 27th 2019 – March 21th 2019)', 'image' => '20190403054014_1111.jpg', 'short_content' => 'NEPSE gained 38.04 points (or up 3.45%) to close at 1140.6 last month. At the beginning of month, NEPSE showed a bullish momentum breaking the resistance level of 50 days moving average.', 'status' => true, 'publish_date' => null ) ), (int) 3 => array( 'MagazineArticle' => array( 'id' => '2429', 'magazine_issue_id' => '996', 'magazine_category_id' => '63', 'title' => 'Monthly Technical Analysis of Nepse (January 26rd 2019 – February 16th 2019)', 'image' => '20190307122140_Clipboard04.jpg', 'short_content' => 'NEPSE index lost 85.21 points (or down 7.17%) to close at 1102.56 last month. Currently, NEPSE is trading below the 200 days moving average. At the beginning of the month, NEPSE breached the support level of 50 days moving average and traded below the 50 days moving average. ', 'status' => true, 'publish_date' => null ) ), (int) 4 => array( 'MagazineArticle' => array( 'id' => '2403', 'magazine_issue_id' => '995', 'magazine_category_id' => '63', 'title' => 'Monthly Technical Analysis of Nepse (December 23rd 2018 – January 17th 2019)', 'image' => '20190215124248_Clipboard07.jpg', 'short_content' => 'NEPSE index gained 21.8 (or up 1.87%) to close at 1187.77 last month. At the beginning of last month, NEPSE index showed bullish momentum by breaching the resistance of 50 days moving average. However, NEPSE index could not breach the 200 days moving average and retraced back forming a shooting star candle. Currently, NEPSE is trading above 50 days moving average and below 200 days moving says average.', 'status' => true, 'publish_date' => null ) ), (int) 5 => array( 'MagazineArticle' => array( 'id' => '2359', 'magazine_issue_id' => '993', 'magazine_category_id' => '63', 'title' => 'Monthly Technical Analysis of Nepse (November 25, 2018 – December 20, 2018)', 'image' => '20190110065454_Clipboard10.jpg', 'short_content' => 'NEPSE index lost 15.27 (or down 1.293%) to close at 1165.97 last month. Currently, the index is trading below the 50 days moving average and 200 days moving average. During the course of last month, NEPSE index breached the support level of 1150, reached the low level of 1120.84 forming a spinning bottom and bounced back to close at 1165.97.', 'status' => true, 'publish_date' => '2019-01-10' ) ), (int) 6 => array( 'MagazineArticle' => array( 'id' => '2325', 'magazine_issue_id' => '992', 'magazine_category_id' => '63', 'title' => 'Monthly Technical Analysis of Nepse (October 26, 2018 – November 22, 2018)', 'image' => null, 'short_content' => 'NEPSE index lost 59.70 (or down 4.81%) to close at 1181.41 last month. Currently, the index is trading below the 50 days moving average and 200 days moving average. NEPSE breached the support level of 50 days moving average.', 'status' => true, 'publish_date' => '0000-00-00' ) ), (int) 7 => array( 'MagazineArticle' => array( 'id' => '2294', 'magazine_issue_id' => '991', 'magazine_category_id' => '63', 'title' => 'Monthly Technical Analysis of Nepse (September 26th 2018 – October 25th 2018)', 'image' => null, 'short_content' => 'NEPSE index lost 36.63 (or down 2.867%) to close at 1241.11 last month. Currently, the index is trading above the 50 days moving average. However, the index is still moving below 200 days moving average.', 'status' => true, 'publish_date' => '0000-00-00' ) ), (int) 8 => array( 'MagazineArticle' => array( 'id' => '2264', 'magazine_issue_id' => '990', 'magazine_category_id' => '63', 'title' => 'Monthly Technical Analysis of Nepse (August 26th 2018 – September 26th 2018)', 'image' => null, 'short_content' => 'NEPSE index experienced high volatility in the course of last month. It gained 102.02 (or up 8.68%) to close at 1277.74 last month. Currently, the index is trading above 50 days moving average. However, the index is still moving below 200-day moving average. ', 'status' => true, 'publish_date' => '0000-00-00' ) ), (int) 9 => array( 'MagazineArticle' => array( 'id' => '2232', 'magazine_issue_id' => '989', 'magazine_category_id' => '63', 'title' => 'Monthly Technical Analysis of Nepse (July 22nd 2018 - August 23rd 2018)', 'image' => null, 'short_content' => 'Nepse index lost 3.16 points (or down0.27%) to close at 1178.5 last month. The index continues to trade below50-day moving average and 200-day moving average indicating bearish momentum in the market. The average volume turnover decreased to Rs 22.51crores from Rs 29.66 crores the month prior.', 'status' => true, 'publish_date' => '0000-00-00' ) ), (int) 10 => array( 'MagazineArticle' => array( 'id' => '2220', 'magazine_issue_id' => '988', 'magazine_category_id' => '63', 'title' => 'Monthly Technical Analysis of Nepse (June 24th 2018 - July 22th 2018)', 'image' => null, 'short_content' => 'The benchmark index declined in the course of last month. Nepse decreased by 36.80 points (or down 3.02%) to close at 1181.66. The index continues to trade below 50-day moving average and 200-day moving average indicating bearish momentum in the market.', 'status' => true, 'publish_date' => '0000-00-00' ) ), (int) 11 => array( 'MagazineArticle' => array( 'id' => '2171', 'magazine_issue_id' => '987', 'magazine_category_id' => '63', 'title' => 'Monthly Technical Analysis of Nepse (May25th 2018 - June 21th 2018)', 'image' => null, 'short_content' => 'The benchmark index declined in the course of last month. Nepse decreased by 99.76 points (or down 7.57%) to close at 1218.46. The index breached 50-day moving average and still trading below 200-day moving average indicating bearish momentum in the market. ', 'status' => true, 'publish_date' => '0000-00-00' ) ), (int) 12 => array( 'MagazineArticle' => array( 'id' => '2147', 'magazine_issue_id' => '986', 'magazine_category_id' => '63', 'title' => 'Monthly Technical Analysis of Nepse (April 25th 2018 - May 24th 2018)', 'image' => null, 'short_content' => 'The benchmark index declined in the course of last month. Nepse decreased by 76.64 points (or down 4.90%) to close at 1318.22.The index moved towards 50-day moving average and still remains below the 200-day moving average. ', 'status' => true, 'publish_date' => '0000-00-00' ) ), (int) 13 => array( 'MagazineArticle' => array( 'id' => '2110', 'magazine_issue_id' => '985', 'magazine_category_id' => '63', 'title' => 'Monthly Technical Analysis of Nepse (March 22nd 2018 – April 24th 2018)', 'image' => null, 'short_content' => 'The benchmark index surged up in the course of last month. Nepse increased by a staggering 163.79 points (or up 12.97%) to close at 1394.86. The index crossed above the 50-day moving average, giving a bullish signal. However, the index still remains below the 200-day MA. New investors entering the market, as well as optimism regarding the implementation of online trading platform, has created this bullish trigger. ', 'status' => true, 'publish_date' => '0000-00-00' ) ), (int) 14 => array( 'MagazineArticle' => array( 'id' => '2089', 'magazine_issue_id' => '984', 'magazine_category_id' => '63', 'title' => 'Monthly Technical Analysis of Nepse (25 February to 21 March 2018)', 'image' => null, 'short_content' => 'The benchmark index continued its downfall in the course of last month. Nepse declined by a staggering 115.97 points (or down 11.78%) to close at 1231.01. The index moving below the 50-day and the 200-day moving average indicates bearish momentum in the market. ', 'status' => true, 'publish_date' => '0000-00-00' ) ), (int) 15 => array( 'MagazineArticle' => array( 'id' => '2062', 'magazine_issue_id' => '983', 'magazine_category_id' => '63', 'title' => 'Monthly Technical Analysis of Nepse (23 January to 22 February 2018)', 'image' => null, 'short_content' => 'The benchmark index continued its downfall in the course of last month. Nepse declined by 15.11 points (or down 1.02%) to close at 1386.98. The index moving below the 50-day and the 200-day moving average indicates bearish momentum in the market.', 'status' => true, 'publish_date' => '0000-00-00' ) ), (int) 16 => array( 'MagazineArticle' => array( 'id' => '2035', 'magazine_issue_id' => '982', 'magazine_category_id' => '63', 'title' => 'Monthly Technical Analysis of Nepse (24 December 2017 to 22 January 2018)', 'image' => null, 'short_content' => 'The benchmark index fell by 70.06 points (or down 4.75%) to close at 1402.09 last month. The index continued to move below the 50-day and the 200-day moving average, indicating a bearish momentum in the market. The market will likely remain bearish as the banks continue to face liquidity crunch.', 'status' => true, 'publish_date' => '0000-00-00' ) ), (int) 17 => array( 'MagazineArticle' => array( 'id' => '2011', 'magazine_issue_id' => '981', 'magazine_category_id' => '63', 'title' => 'Monthly Technical Analysis of Nepse (26 November to 21 December 2017)', 'image' => null, 'short_content' => 'The benchmark index fell by 21.14 points (or down 1.38%) to close at 1472.15 last month. The index has moved below the 50-day, as well as 200-day moving average, giving a bearish signal. Completion of the election at the beginning of the month did little to create bullish sentiment in the market.', 'status' => true, 'publish_date' => '0000-00-00' ) ), (int) 18 => array( 'MagazineArticle' => array( 'id' => '1982', 'magazine_issue_id' => '980', 'magazine_category_id' => '63', 'title' => 'Monthly Technical Analysis of Nepse (22 October to 23 November 2017)', 'image' => null, 'short_content' => 'The benchmark index fell by 75.06 points (or down 4.83%) to close at 1493.29 last month. The index is hovering below the 50-day, as well as the 200-day moving average. This shows the market to be in a bearish mode in the course of last month.', 'status' => true, 'publish_date' => '0000-00-00' ) ), (int) 19 => array( 'MagazineArticle' => array( 'id' => '1950', 'magazine_issue_id' => '979', 'magazine_category_id' => '63', 'title' => 'Monthly Technical Analysis of Nepse (20 September to 18 October 2017)', 'image' => null, 'short_content' => 'The benchmark index gained a modest 24.65 points (or up 1.67%) to close at 1568.35 last month. The index continues to move close to the 200-day moving average, which acts as a support level to the index. Favorable political outlook has triggered a bullish sentiment in the market. ', 'status' => true, 'publish_date' => '0000-00-00' ) ), (int) 20 => array( 'MagazineArticle' => array( 'id' => '1933', 'magazine_issue_id' => '978', 'magazine_category_id' => '63', 'title' => 'Monthly Technical Analysis of Nepse (22 August to 18 September 2017)', 'image' => null, 'short_content' => 'The benchmark index lost 67.87 points (or down 4.20%) to close at 1543.7 last month. The index fell below the 50-day, as well as 200-day moving average, which shows bearish sentiment in the market.', 'status' => true, 'publish_date' => '0000-00-00' ) ), (int) 21 => array( 'MagazineArticle' => array( 'id' => '1897', 'magazine_issue_id' => '977', 'magazine_category_id' => '63', 'title' => 'Monthly Technical Analysis of Nepse (25 July to 21 August 2017)', 'image' => null, 'short_content' => 'The benchmark index lost 17.51 points (or down 1.06%) to close at 1611.57 last month. The index remains above the 50-day, as well as 200 day moving average, signaling the market to be bullish. However, Nepse hovering close to the 50-day MA will test the respective MA for support level.', 'status' => true, 'publish_date' => '0000-00-00' ) ), (int) 22 => array( 'MagazineArticle' => array( 'id' => '1866', 'magazine_issue_id' => '976', 'magazine_category_id' => '63', 'title' => ' Monthly Technical Analysis of Nepse (25 June to 24 July 2017)', 'image' => null, 'short_content' => 'The benchmark index gained 69.59 points (or up 4.44%) to close at 1629.08 last month. Events such as release of monetary policy and talks regarding online trading system were witnessed in the course of last month. ', 'status' => true, 'publish_date' => '0000-00-00' ) ), (int) 23 => array( 'MagazineArticle' => array( 'id' => '1848', 'magazine_issue_id' => '975', 'magazine_category_id' => '63', 'title' => 'Monthly Technical Analysis of Nepse (28 May to 22 June 2017)', 'image' => null, 'short_content' => 'The benchmark index continued to fall in the course of last month. It declined by 70.09 points (or down -4.32%) last month to close at 1559.49. The index fell below the 50-day, as well as the 200-day moving average, giving a bearish signal.', 'status' => true, 'publish_date' => '0000-00-00' ) ), (int) 24 => array( 'MagazineArticle' => array( 'id' => '1801', 'magazine_issue_id' => '974', 'magazine_category_id' => '63', 'title' => 'Monthly Technical Analysis of Nepse (26 April to 24 May 2017)', 'image' => null, 'short_content' => 'The benchmark index declined from 1670.3 to 1629.58 in the course of last month. Its new support and resistance level stands at 1612 and 1780 level respectively. With no new bullish trigger, the index will likely test the new support level', 'status' => true, 'publish_date' => '0000-00-00' ) ), (int) 25 => array( 'MagazineArticle' => array( 'id' => '1780', 'magazine_issue_id' => '973', 'magazine_category_id' => '63', 'title' => 'Monthly Technical Analysis of Nepse (27 March to 25 April 2017)', 'image' => null, 'short_content' => 'The benchmark index continued its bullish run in the course of last month. Nepse gained 138.55 points (or up 9.08%) to close at 1672.38. Several factors supported the bullish momentum in the market. Positive political state of affairs, as well as Insurance Board’s directive to increase insurance capital,', 'status' => true, 'publish_date' => '0000-00-00' ) ), (int) 26 => array( 'MagazineArticle' => array( 'id' => '1753', 'magazine_issue_id' => '972', 'magazine_category_id' => '63', 'title' => 'Monthly Technical Analysis of Nepse (22 February to 26 March 2017)', 'image' => null, 'short_content' => 'The benchmark index experienced a remarkable climb in the course of last month. The index gained a staggering 176.26 points (or up 12.44%) to close at 1533.83. Gradual decrease in interest rates and positive hopes for political scenario seems to have caused a bullish trigger in the market. ', 'status' => true, 'publish_date' => '0000-00-00' ) ), (int) 27 => array( 'MagazineArticle' => array( 'id' => '1732', 'magazine_issue_id' => '971', 'magazine_category_id' => '63', 'title' => 'Monthly Technical Analysis of Nepse (20 January to 21 February 2017)', 'image' => null, 'short_content' => 'The benchmark index took a bearish ride at the beginning of last month, dropping as low as 1252.5 level. In the course of the month, Nepse lost a staggering 104.99 points (or down -6.93%) to close at 1357.57. Uncertain political environment and higher fixed deposit rate by the banks continues to create bearish sentiment in the market.', 'status' => true, 'publish_date' => '0000-00-00' ) ), (int) 28 => array( 'MagazineArticle' => array( 'id' => '1702', 'magazine_issue_id' => '970', 'magazine_category_id' => '63', 'title' => 'Nepse in Consolidation Stage', 'image' => null, 'short_content' => 'The benchmark indexcontinued to decline in the course of last month. The index lost 12.85 points (or down 0.87%) to close at 1462.56. Nepse continues to hover below the 200-day moving ..', 'status' => true, 'publish_date' => '0000-00-00' ) ), (int) 29 => array( 'MagazineArticle' => array( 'id' => '1650', 'magazine_issue_id' => '968', 'magazine_category_id' => '63', 'title' => 'Monthly Technical Analysis of Nepse (3 November to 30 November 2016)', 'image' => null, 'short_content' => 'The benchmark index experienced high volatility and bearish downturn in the course of last month. The index lost a staggering 151.38 points (or down 8.60%) to close at 1608.33. ', 'status' => true, 'publish_date' => '0000-00-00' ) ), (int) 30 => array( 'MagazineArticle' => array( 'id' => '1623', 'magazine_issue_id' => '967', 'magazine_category_id' => '63', 'title' => 'Monthly Technical Analysis of Nepse (23 September to 27 October 2016)', 'image' => null, 'short_content' => 'The benchmark index climbed up during the first half of last month. However, it took a U-turn during the second half of the month, indicating a bearish presence in the market. The index lost 7.2 points (or down 0.34%) last month to close at 1759.71. ', 'status' => true, 'publish_date' => '0000-00-00' ) ), (int) 31 => array( 'MagazineArticle' => array( 'id' => '1598', 'magazine_issue_id' => '966', 'magazine_category_id' => '63', 'title' => 'Monthly Technical Analysis of Nepse (28 August to 22 September 2016)', 'image' => null, 'short_content' => 'The benchmark index experienced a bullish run during the first half of last month. However, the second half of the month was triggered by a bearish momentum. Nepse gained 36.29 points (or up 2.12%) last month to close at 1766.91. ', 'status' => true, 'publish_date' => '0000-00-00' ) ), (int) 32 => array( 'MagazineArticle' => array( 'id' => '1567', 'magazine_issue_id' => '965', 'magazine_category_id' => '63', 'title' => 'Monthly Technical Analysis of Nepse (31 July to 25 August 2016)', 'image' => null, 'short_content' => 'The benchmark index went through high volatility last month. The index lost a staggering 147.31 points (or down -7.72%) to close at 1730.62. Nepse lost 202.02 points during the first half of the month. The index hit a negative, as well as positive circuit break during the middle of the month, as nervousness became apparent in the market. ', 'status' => true, 'publish_date' => '0000-00-00' ) ), (int) 33 => array( 'MagazineArticle' => array( 'id' => '1543', 'magazine_issue_id' => '964', 'magazine_category_id' => '63', 'title' => 'Monthly Technical Analysis of Nepse (28 June to 28 July 2016)', 'image' => null, 'short_content' => 'The benchmark index saw tremendous growth in the course of last month. The index gained 165.09 points (or up 7.86%) to close at 1877.93. Various policies and economic scenarios have supported the bullish sentiment in the market.', 'status' => true, 'publish_date' => '0000-00-00' ) ), (int) 34 => array( 'MagazineArticle' => array( 'id' => '1531', 'magazine_issue_id' => '963', 'magazine_category_id' => '63', 'title' => ' Monthly Technical Analysis of Nepse (26 May to 27 June 2016)', 'image' => null, 'short_content' => 'The benchmark index created history by breaking the 1600 and 1700 mark in the course of last month. The index gained a staggering 197.65 points (or up 12.34%) to close at 1721.77. The Insurance and Hydropower sectors have caused the market to climb further up', 'status' => true, 'publish_date' => '0000-00-00' ) ), (int) 35 => array( 'MagazineArticle' => array( 'id' => '1505', 'magazine_issue_id' => '962', 'magazine_category_id' => '63', 'title' => 'Monthly Technical Analysis of Nepse (2 May to 25 May 2016)', 'image' => null, 'short_content' => 'The benchmark index continues to create new heights as the bullish momentum is driving the market upward. The index gained 59.21 points (or up 4.01%) to close at 1524.12 in the course of last month. The market did correct itself during the course of the week. ', 'status' => true, 'publish_date' => '0000-00-00' ) ), (int) 36 => array( 'MagazineArticle' => array( 'id' => '1481', 'magazine_issue_id' => '961', 'magazine_category_id' => '63', 'title' => 'Monthly Technical Analysis of Nepse (28 March to 28 April 2016)', 'image' => null, 'short_content' => 'The benchmark index continued its upward climb last month as well. Nepse index gained 87.58 points (or up 6.21%) to close at an all time height of 1464.91. The index witnessed some corrections at the beginning of the month, as it declined by 25.79 points.', 'status' => true, 'publish_date' => '0000-00-00' ) ), (int) 37 => array( 'MagazineArticle' => array( 'id' => '1449', 'magazine_issue_id' => '959', 'magazine_category_id' => '63', 'title' => ' Monthly Technical Analysis of Nepse (31 January to 25 February 2016)', 'image' => null, 'short_content' => 'The benchmark index scaled up further in the course of last month. Nepse index gained a staggering 67.41 points (or up 5.43%) to close at 1283.52. The index is moving well above the 50-day moving average (MA) and 200-day MA, indicating that the overall market outlook looks good.', 'status' => true, 'publish_date' => '0000-00-00' ) ), (int) 38 => array( 'MagazineArticle' => array( 'id' => '1432', 'magazine_issue_id' => '958', 'magazine_category_id' => '63', 'title' => ' Monthly Technical Analysis of Nepse (27 December, 2015 to 28 January 2016)', 'image' => null, 'short_content' => 'The benchmark index increased further in the course of last month. The Nepse index gained a staggering 79.08 points (or up 6.77%) to close at 1216.11. Few reasons have caused the market to be bullish last month. Firstly, the bullish momentum was triggered by an increase in the demand in the insurance sector.', 'status' => true, 'publish_date' => '0000-00-00' ) ), (int) 39 => array( 'MagazineArticle' => array( 'id' => '1380', 'magazine_issue_id' => '956', 'magazine_category_id' => '63', 'title' => 'Monthly Technical Analysis of Nepse (1 November to 26 November, 2015)', 'image' => null, 'short_content' => 'or the first half of the month, the benchmark index moved sideways, hovering above its immediate support level of 1084. The index then reached a high level of 1109. However, for the second half of the month the index spiraled downwards, losing 48.03 points (or down 4.43%).', 'status' => true, 'publish_date' => '0000-00-00' ) ), (int) 40 => array( 'MagazineArticle' => array( 'id' => '1363', 'magazine_issue_id' => '955', 'magazine_category_id' => '63', 'title' => 'Why S&P 500 is expected to make an important low on 26th November, 2015 at 13:43 NEWYORK TIME ?', 'image' => '20151125121943_st.jpg', 'short_content' => 'You will see every time when the planet Venus travels the sign of Libra at 19.48 degree, the S&P makes an important low there. Not once or twice or thrice, but in year 2010, 2011, 2012, 2013 and 2014 – five years in a row - it was right on the spot and the next date is 26th November,2015.', 'status' => true, 'publish_date' => '0000-00-00' ) ), (int) 41 => array( 'MagazineArticle' => array( 'id' => '1324', 'magazine_issue_id' => '954', 'magazine_category_id' => '63', 'title' => 'Forecasting Gold Prices with Astrology’s Help ', 'image' => null, 'short_content' => 'Gold is ruled by the planet Sun and the sign Leo. When a benefic planet transits Leo and at the same time casts good aspects to the Sun or when it casts a good aspect to Leo from other signs the value of gold rises. ', 'status' => true, 'publish_date' => '0000-00-00' ) ), (int) 42 => array( 'MagazineArticle' => array( 'id' => '1338', 'magazine_issue_id' => '954', 'magazine_category_id' => '63', 'title' => 'Market Gone Flat after Breaching Record (Review for 25 August to 24 September, 2015)', 'image' => null, 'short_content' => 'The secondary market touched the historic high during the review period ahead of the promulgation of the long awaited new constitution. But after the constitution was promulgated, it shed some of the gains and remains flat then after. ', 'status' => true, 'publish_date' => '0000-00-00' ) ), (int) 43 => array( 'MagazineArticle' => array( 'id' => '1346', 'magazine_issue_id' => '954', 'magazine_category_id' => '63', 'title' => 'Monthly Technical Analysis of Nepse (23 August to 24 September, 2015)', 'image' => null, 'short_content' => 'Nepse index followed a sideways movement for most of last month. The benchmark index tested the 1200 mark three times in the course of previous month. On 15th September, Nepse reached its all time high of 1205.84 level. The current trend shows Nepse to be falling faintly, creating lower low in the support zone. ', 'status' => true, 'publish_date' => '0000-00-00' ) ), (int) 44 => array( 'MagazineArticle' => array( 'id' => '1294', 'magazine_issue_id' => '953', 'magazine_category_id' => '63', 'title' => 'The Most Awaited Trade of 2015', 'image' => null, 'short_content' => 'This trade is probably the most awaited trade of 2015. The entire world is anxious to know when the US stock indices are going to stop their unstoppable bull rally which started in 2009.', 'status' => true, 'publish_date' => '0000-00-00' ) ), (int) 45 => array( 'MagazineArticle' => array( 'id' => '1312', 'magazine_issue_id' => '953', 'magazine_category_id' => '63', 'title' => 'Rise and Rise of Nepse (Review for 23 July to 20 August, 2015)', 'image' => null, 'short_content' => 'Nepal’s Capital Market set the history’s new high during the review period as positive sentiments towards banking stocks led all the sectors. The benchmark Nepse index touched 1200.92 adding 197.54 points in the review period while the session’s low was at the opening (23 July) with 1003.38.', 'status' => true, 'publish_date' => '0000-00-00' ) ), (int) 46 => array( 'MagazineArticle' => array( 'id' => '1313', 'magazine_issue_id' => '953', 'magazine_category_id' => '63', 'title' => 'Monthly Technical Analysis of Nepse (26 July to 20 August, 2015) ', 'image' => null, 'short_content' => 'Nepse witnessed remarkable gains in the course of last month. The benchmark index rose by 197.54 points (or up 18.31%). It surpassed its previous resistance levels of 1036.98 and 1100 points and is moving well above the 50-day and 200-day moving average, and at a much higher rate, indicating a bullish outlook.', 'status' => true, 'publish_date' => '0000-00-00' ) ), (int) 47 => array( 'MagazineArticle' => array( 'id' => '1265', 'magazine_issue_id' => '952', 'magazine_category_id' => '63', 'title' => 'Stay Alert from September 14 to October 14', 'image' => null, 'short_content' => 'In our article, “Millionaires don’t use astrology but billionaires do” written on March 31 2015 and published in the May, 2015 issue of New Business Age we forecasted that: ', 'status' => true, 'publish_date' => '0000-00-00' ) ), (int) 48 => array( 'MagazineArticle' => array( 'id' => '1244', 'magazine_issue_id' => '928', 'magazine_category_id' => '63', 'title' => 'Moving Sideways', 'image' => null, 'short_content' => 'As the earthquake has destroyed property and hampered trade, consumption, investment and living patterns of the people, business activities have been hampered. However, the exact loss can be assesses only after the coming quarterly reports of the listed companies.', 'status' => true, 'publish_date' => '0000-00-00' ) ), (int) 49 => array( 'MagazineArticle' => array( 'id' => '1245', 'magazine_issue_id' => '928', 'magazine_category_id' => '63', 'title' => 'Are We Ready for the Next Stock Market Crash?', 'image' => null, 'short_content' => 'In US stock market history, so far we have seen three big crashes. The first crash was on 28th October 1929, followed by the second on 19th October 1987 and the last crash was on 6th October 2008.', 'status' => true, 'publish_date' => '0000-00-00' ) ), (int) 50 => array( 'MagazineArticle' => array( 'id' => '1246', 'magazine_issue_id' => '928', 'magazine_category_id' => '63', 'title' => 'Smarten Your Approach to the Secondary Market', 'image' => null, 'short_content' => 'Before investing in the secondary market, take a breather and evaluate yourself. What is your type? Are you an investor or a trader?', 'status' => true, 'publish_date' => '0000-00-00' ) ), (int) 51 => array( 'MagazineArticle' => array( 'id' => '1247', 'magazine_issue_id' => '928', 'magazine_category_id' => '63', 'title' => 'Monthly Technical Analysis of Nepse (May 24 to June 23, 2015)', 'image' => null, 'short_content' => 'The aftermath of the earthquake caused Nepse index to fall by 10.70%. Nevertheless, the index increased soon enough, rising by 15.43% halfway through last month. Currently, Nepse is at a correction period.', 'status' => true, 'publish_date' => '0000-00-00' ) ), (int) 52 => array( 'MagazineArticle' => array( 'id' => '1193', 'magazine_issue_id' => '889', 'magazine_category_id' => '63', 'title' => '11.47 Points Fall Ahead of Q3 Results', 'image' => null, 'short_content' => 'Most of the stocks turned red during the review period (Feb 18 - March 19) pushing the index to nearly two months low. The Nepse index closed in red losing 15.03 points or 1.53% to settle at 967.62. The index touched highest level on 9 March with 988.77 and the lowest was 959.14 on 16 March. ', 'status' => true, 'publish_date' => '0000-00-00' ) ), (int) 53 => array( 'MagazineArticle' => array( 'id' => '1194', 'magazine_issue_id' => '889', 'magazine_category_id' => '63', 'title' => 'Monthly Technical Analysis of Nepse (March 19 to April 23, 2015) : At Lowest Volatility of the Year', 'image' => null, 'short_content' => 'RSI is a form of leading indicator that is believed to be most effective during periods of sideways movement. Such indicators may create numerous buy and sell signals that are useful when the market is not clearly trending upwards or downwards. ', 'status' => true, 'publish_date' => '0000-00-00' ) ), (int) 54 => array( 'MagazineArticle' => array( 'id' => '1166', 'magazine_issue_id' => '863', 'magazine_category_id' => '63', 'title' => 'Market @ Two Months’ Low', 'image' => null, 'short_content' => 'Most of the stocks turned red during the review period (Feb 18 - March 19) pushing the index to nearly two months low. The Nepse index closed in red losing 15.03 points or 1.53% to settle at 967.62. The index touched highest level on 9 March with 988.77 and the lowest was 959.14 on 16 March. ', 'status' => true, 'publish_date' => '0000-00-00' ) ), (int) 55 => array( 'MagazineArticle' => array( 'id' => '1167', 'magazine_issue_id' => '863', 'magazine_category_id' => '63', 'title' => 'Technical Analysis Monthly (February 19 to March 19, 2015) Bearish Signals', 'image' => null, 'short_content' => ' Nepse has not made much improvement in the past 30 days as compared to the growth witnessed in the previous months. Nepse decreased by -19.43 points (or -1.95%) to close at 967.62 points. It fell below its support level of 972.17, which is now its new resistance level. ', 'status' => true, 'publish_date' => '0000-00-00' ) ), (int) 56 => array( 'MagazineArticle' => array( 'id' => '1139', 'magazine_issue_id' => '839', 'magazine_category_id' => '63', 'title' => 'Nepse Slows Down', 'image' => null, 'short_content' => 'The secondary market of Nepal stalled after reaching nearly six months high while political uncertainties compelled the investors to wait-and-watch. The benchmark Nepse index added 7.20 points or 0.74 per cent to rest at 982.62. ', 'status' => true, 'publish_date' => '0000-00-00' ) ), (int) 57 => array( 'MagazineArticle' => array( 'id' => '1140', 'magazine_issue_id' => '839', 'magazine_category_id' => '63', 'title' => 'Technical Analysis Monthly (Jan 20, 14 – Feb 19, 15) : Bullish Signal for Long Term', 'image' => null, 'short_content' => 'After the huge gains witnessed in the previous periods, Nepse remained almost flat during the past 30 days. However, there was an overall positive gain in the market as Nepse increased by 7.2 points (or 0.74%) to close at 982.65 points.', 'status' => true, 'publish_date' => '0000-00-00' ) ), (int) 58 => array( 'MagazineArticle' => array( 'id' => '1108', 'magazine_issue_id' => '811', 'magazine_category_id' => '63', 'title' => 'Waiting for Confirmation Signal', 'image' => null, 'short_content' => 'Nepal’s secondary market turned little green with hopes that agreement between major political parties on contentious issues of new constitution was underway. The Nepse index accelerated 66.19 points or 7.38 per cent to close at 962.80. ', 'status' => true, 'publish_date' => '0000-00-00' ) ), (int) 59 => array( 'MagazineArticle' => array( 'id' => '1109', 'magazine_issue_id' => '811', 'magazine_category_id' => '63', 'title' => 'Technical Analysis Monthly (Dec 21, 2014 to Jan 20, 2015)', 'image' => null, 'short_content' => 'Giving continuity to the previous period’s positive momentum, Nepse has been able to make remarkable gains during this period. The stock market moved past its strong resistance level of 938.41 to close at 962.8 points – an increase of 58.91 points or 6.52 per cent.', 'status' => true, 'publish_date' => '0000-00-00' ) ), (int) 60 => array( 'MagazineArticle' => array( 'id' => '1064', 'magazine_issue_id' => '783', 'magazine_category_id' => '63', 'title' => 'Politics Still a Factor', 'image' => null, 'short_content' => 'Most of the listed companies have declared their dividends and few others are about to make these announcements. This means that the price adjustment of the stock after dividend declaration has also played role in driving the prices lower for such few companies. ', 'status' => true, 'publish_date' => '0000-00-00' ) ), (int) 61 => array( 'MagazineArticle' => array( 'id' => '1065', 'magazine_issue_id' => '783', 'magazine_category_id' => '63', 'title' => 'Technical Analysis Monthly (Nov 21 – Dec 20) : Fighting 916 Resistance', 'image' => null, 'short_content' => 'There was significant sideways movement in Nepse in the period between Nov 21, 2014 and Dec 20, 2014. The immediate support level of 844.42 was tested three times while the imme-diate resistance level of 875.56 was tested once in the review period.', 'status' => true, 'publish_date' => '0000-00-00' ) ), (int) 62 => array( 'MagazineArticle' => array( 'id' => '1036', 'magazine_issue_id' => '756', 'magazine_category_id' => '63', 'title' => 'Market Dips to 6 Months Low', 'image' => null, 'short_content' => 'The stock market of Nepal plunged to 6 months low in the review period as gloomy political winter cooled investors’ sentiment. The Nepse index lost 61.84 points or 6.69% to rest at 862.5 while the session’s high was on 27 Oct with 935.01 and lowest was on 18 Nov with 844.06. ', 'status' => true, 'publish_date' => '0000-00-00' ) ), (int) 63 => array( 'MagazineArticle' => array( 'id' => '1037', 'magazine_issue_id' => '756', 'magazine_category_id' => '63', 'title' => 'Technical Analysis Monthly (Oct 20 – Nov 20)', 'image' => null, 'short_content' => 'Since Nepse peaked at 1083.55 points on July 21, 2014, the stock market has been following a bearish pattern. Though the markets stabilized and saw a 2.88% rebound during the last trading period, overall Nepse has continued its downward trend', 'status' => true, 'publish_date' => '0000-00-00' ) ), (int) 64 => array( 'MagazineArticle' => array( 'id' => '1038', 'magazine_issue_id' => '756', 'magazine_category_id' => '63', 'title' => 'Ups and Downs in Nepali Stock Market', 'image' => null, 'short_content' => 'Ups and downs in the indicators of the stock market are a regular phenomenon. The market goes up when more investors exercise for buying stocks and slips down when more investors are in the mood to sell their shares. If they quickly want to exit from the market,', 'status' => true, 'publish_date' => '0000-00-00' ) ), (int) 65 => array( 'MagazineArticle' => array( 'id' => '992', 'magazine_issue_id' => '730', 'magazine_category_id' => '63', 'title' => 'Market Stalled after Losing Steam', 'image' => null, 'short_content' => 'The Nepali stock market remained stable during the review period despite the recent sharp fall. The benchmark Nepse index added 3.71 points or 0.40% to reach 923.59 while the session’s high was on 30 September with 937.99 and lowest was on 22 September with 881.87. ', 'status' => true, 'publish_date' => '0000-00-00' ) ), (int) 66 => array( 'MagazineArticle' => array( 'id' => '993', 'magazine_issue_id' => '730', 'magazine_category_id' => '63', 'title' => 'Monthly Technical Analysis of Nepse November 2014', 'image' => null, 'short_content' => 'After two continuous trading periods of huge declines, Nepse has stabilized in recent times. Compared to the previous period, Nepse made an upward gain of 25.96 points (or 2.88%) closing at 925.85 points. ', 'status' => true, 'publish_date' => '0000-00-00' ) ), (int) 67 => array( 'MagazineArticle' => array( 'id' => '994', 'magazine_issue_id' => '730', 'magazine_category_id' => '63', 'title' => 'Privatization, Corporatization and Strategic Partner for NEPSE', 'image' => null, 'short_content' => 'Historically stock exchanges started as a mutually governed, non-profit making, self-regulated cooperative like structures. Mostly brokers were the owners of such exchanges. However, due to the change in the technology and the concept of securities commission as apex regulator', 'status' => true, 'publish_date' => '0000-00-00' ) ), (int) 68 => array( 'MagazineArticle' => array( 'id' => '920', 'magazine_issue_id' => '678', 'magazine_category_id' => '63', 'title' => 'The Big Retreat', 'image' => null, 'short_content' => 'The Nepali bourse cooled down after reaching a high of 1083.55 as selling pressure ruled the market. The benchmark Nepse index plummeted 61.35 points or 5.71% to close at 1013.6 while session’s high was on 21st July with 1083.55 and lowest on 18th August with 1013.25. ', 'status' => true, 'publish_date' => '0000-00-00' ) ), (int) 69 => array( 'MagazineArticle' => array( 'id' => '921', 'magazine_issue_id' => '678', 'magazine_category_id' => '63', 'title' => 'Monthly Technical Analysis of Nepse (July 21 - August 14, 2014)', 'image' => null, 'short_content' => 'On the first trading day of the review period the secondary market had witnessed the highest rise as the benchmark index settled at 1083.55 points, a new high since the last 6 years. On the same day Nepse had attained the highest turnover of NPR 1.20 billion on a single trading day in its history.', 'status' => true, 'publish_date' => '0000-00-00' ) ), (int) 70 => array( 'MagazineArticle' => array( 'id' => '952', 'magazine_issue_id' => '704', 'magazine_category_id' => '63', 'title' => 'The End of Bull Run', 'image' => null, 'short_content' => 'The stock market of Nepal which was predicted to break the previous historic high level of 1175.38 points pulled back from 1083.55 and witnessed a nose dive sessions. ', 'status' => true, 'publish_date' => '0000-00-00' ) ), (int) 71 => array( 'MagazineArticle' => array( 'id' => '953', 'magazine_issue_id' => '704', 'magazine_category_id' => '63', 'title' => 'Monthly Technical Analysis of Nepse October 2014', 'image' => null, 'short_content' => 'Nepal Stock Exchange (Nepse) index continued spiralling downwards during the August 19 to September 18, 2014 period, just like the preceding period. During the review period, Nepse fell by 134.5 points (-13 per cent) to close at 899.89 points.', 'status' => true, 'publish_date' => '0000-00-00' ) ), (int) 72 => array( 'MagazineArticle' => array( 'id' => '954', 'magazine_issue_id' => '704', 'magazine_category_id' => '63', 'title' => 'NRN Investment through Capital Market', 'image' => null, 'short_content' => '‘Economic Roadmap for Prosperous Nepal’ was the main theme of 8th NRN regional conference held on Nagano, Japan from September 18 to 19. About three hundred NRNs had participated from different part of the globe to discuss on the given theme. ', 'status' => true, 'publish_date' => '0000-00-00' ) ), (int) 73 => array( 'MagazineArticle' => array( 'id' => '1405', 'magazine_issue_id' => '957', 'magazine_category_id' => '63', 'title' => 'Monthly Technical Analysis of Nepse (29 November to 24 December, 2015)', 'image' => null, 'short_content' => 'The benchmark index saw huge changes in the course of last month. Despite all the difficulties and political unrest in the country, Nepse gained a staggering 114.26 points (or up 11.17%) to close at 1137.03. It seems that the monetary policy is still playing a major role in causing the market to be bullish.', 'status' => true, 'publish_date' => '0000-00-00' ) ) ) $magazineCategory = array( 'MagazineCategory' => array( 'id' => '63', 'title' => 'Stock Taking', 'sortorder' => '516', 'status' => true, 'created' => '0000-00-00 00:00:00', 'homepage' => true, 'modified' => '2013-04-01 00:00:00' ) ) $magazineArticle = array( 'MagazineArticle' => array( 'id' => '954', 'magazine_issue_id' => '704', 'magazine_category_id' => '63', 'title' => 'NRN Investment through Capital Market', 'image' => null, 'short_content' => '‘Economic Roadmap for Prosperous Nepal’ was the main theme of 8th NRN regional conference held on Nagano, Japan from September 18 to 19. About three hundred NRNs had participated from different part of the globe to discuss on the given theme. ', 'status' => true, 'publish_date' => '0000-00-00' ) ) $issue_title = array() $width = (int) 400 $height = (int) 230 $ratio = (float) 1.7391304347826 $img_width = (int) 160 $img_height = (float) 92include - APP/View/MagazineArticles/category.ctp, line 86 View::_evaluate() - CORE/Cake/View/View.php, line 971 View::_render() - CORE/Cake/View/View.php, line 933 View::render() - CORE/Cake/View/View.php, line 473 Controller::render() - CORE/Cake/Controller/Controller.php, line 968 Dispatcher::_invoke() - CORE/Cake/Routing/Dispatcher.php, line 200 Dispatcher::dispatch() - CORE/Cake/Routing/Dispatcher.php, line 167 [main] - APP/webroot/index.php, line 117
Notice (8): Trying to access array offset on value of type null [APP/View/MagazineArticles/category.ctp, line 86]Code Context<div class="category"><span class="label label-danger"><?php echo $this->Html->link($issue_title['MagazineIssue']['title'],$viewFile = '/var/www/html/newbusinessage.com/app/View/MagazineArticles/category.ctp' $dataForView = array( 'current_user' => null, 'logged_in' => false ) $current_user = null $logged_in = false $cat_id = '63' $magazineArticles = array( (int) 0 => array( 'MagazineArticle' => array( 'id' => '2742', 'magazine_issue_id' => '1006', 'magazine_category_id' => '63', 'title' => 'Monthly Technical Analysis (November 24th -December 19th 2019)', 'image' => '20201010020410_Clipboard30.jpg', 'short_content' => 'NEPSE index gained 39.57 points (or up 3.56 %) to close at 1149.65 last month. Last month 50 days moving average of NEPSE was crossed from below which showed short term bull. However, NEPSE is trading below 200 days moving average which shows that overall long term sentiment is still bearish.', 'status' => true, 'publish_date' => null ) ), (int) 1 => array( 'MagazineArticle' => array( 'id' => '2508', 'magazine_issue_id' => '998', 'magazine_category_id' => '63', 'title' => 'Monthly Technical Analysis of Nepse March 24th 2019 – April 22th 2019', 'image' => '20190511100832_Clipboard24.jpg', 'short_content' => 'NEPSE gained 116.34 points (or up 10.20%) to close at 1250.94 last month that ended on April 22. Last month, NEPSE showed a bullish momentum breaking the resistance level of 200 days moving average. Currently, NEPSE is trading above the 50 days moving average and 200 days moving average. The average daily volume turnover has increased to NPR 53.01 crores from NPR 30.26 crores', 'status' => true, 'publish_date' => null ) ), (int) 2 => array( 'MagazineArticle' => array( 'id' => '2464', 'magazine_issue_id' => '997', 'magazine_category_id' => '63', 'title' => 'Monthly Technical Analysis of Nepse (February 27th 2019 – March 21th 2019)', 'image' => '20190403054014_1111.jpg', 'short_content' => 'NEPSE gained 38.04 points (or up 3.45%) to close at 1140.6 last month. At the beginning of month, NEPSE showed a bullish momentum breaking the resistance level of 50 days moving average.', 'status' => true, 'publish_date' => null ) ), (int) 3 => array( 'MagazineArticle' => array( 'id' => '2429', 'magazine_issue_id' => '996', 'magazine_category_id' => '63', 'title' => 'Monthly Technical Analysis of Nepse (January 26rd 2019 – February 16th 2019)', 'image' => '20190307122140_Clipboard04.jpg', 'short_content' => 'NEPSE index lost 85.21 points (or down 7.17%) to close at 1102.56 last month. Currently, NEPSE is trading below the 200 days moving average. At the beginning of the month, NEPSE breached the support level of 50 days moving average and traded below the 50 days moving average. ', 'status' => true, 'publish_date' => null ) ), (int) 4 => array( 'MagazineArticle' => array( 'id' => '2403', 'magazine_issue_id' => '995', 'magazine_category_id' => '63', 'title' => 'Monthly Technical Analysis of Nepse (December 23rd 2018 – January 17th 2019)', 'image' => '20190215124248_Clipboard07.jpg', 'short_content' => 'NEPSE index gained 21.8 (or up 1.87%) to close at 1187.77 last month. At the beginning of last month, NEPSE index showed bullish momentum by breaching the resistance of 50 days moving average. However, NEPSE index could not breach the 200 days moving average and retraced back forming a shooting star candle. Currently, NEPSE is trading above 50 days moving average and below 200 days moving says average.', 'status' => true, 'publish_date' => null ) ), (int) 5 => array( 'MagazineArticle' => array( 'id' => '2359', 'magazine_issue_id' => '993', 'magazine_category_id' => '63', 'title' => 'Monthly Technical Analysis of Nepse (November 25, 2018 – December 20, 2018)', 'image' => '20190110065454_Clipboard10.jpg', 'short_content' => 'NEPSE index lost 15.27 (or down 1.293%) to close at 1165.97 last month. Currently, the index is trading below the 50 days moving average and 200 days moving average. During the course of last month, NEPSE index breached the support level of 1150, reached the low level of 1120.84 forming a spinning bottom and bounced back to close at 1165.97.', 'status' => true, 'publish_date' => '2019-01-10' ) ), (int) 6 => array( 'MagazineArticle' => array( 'id' => '2325', 'magazine_issue_id' => '992', 'magazine_category_id' => '63', 'title' => 'Monthly Technical Analysis of Nepse (October 26, 2018 – November 22, 2018)', 'image' => null, 'short_content' => 'NEPSE index lost 59.70 (or down 4.81%) to close at 1181.41 last month. Currently, the index is trading below the 50 days moving average and 200 days moving average. NEPSE breached the support level of 50 days moving average.', 'status' => true, 'publish_date' => '0000-00-00' ) ), (int) 7 => array( 'MagazineArticle' => array( 'id' => '2294', 'magazine_issue_id' => '991', 'magazine_category_id' => '63', 'title' => 'Monthly Technical Analysis of Nepse (September 26th 2018 – October 25th 2018)', 'image' => null, 'short_content' => 'NEPSE index lost 36.63 (or down 2.867%) to close at 1241.11 last month. Currently, the index is trading above the 50 days moving average. However, the index is still moving below 200 days moving average.', 'status' => true, 'publish_date' => '0000-00-00' ) ), (int) 8 => array( 'MagazineArticle' => array( 'id' => '2264', 'magazine_issue_id' => '990', 'magazine_category_id' => '63', 'title' => 'Monthly Technical Analysis of Nepse (August 26th 2018 – September 26th 2018)', 'image' => null, 'short_content' => 'NEPSE index experienced high volatility in the course of last month. It gained 102.02 (or up 8.68%) to close at 1277.74 last month. Currently, the index is trading above 50 days moving average. However, the index is still moving below 200-day moving average. ', 'status' => true, 'publish_date' => '0000-00-00' ) ), (int) 9 => array( 'MagazineArticle' => array( 'id' => '2232', 'magazine_issue_id' => '989', 'magazine_category_id' => '63', 'title' => 'Monthly Technical Analysis of Nepse (July 22nd 2018 - August 23rd 2018)', 'image' => null, 'short_content' => 'Nepse index lost 3.16 points (or down0.27%) to close at 1178.5 last month. The index continues to trade below50-day moving average and 200-day moving average indicating bearish momentum in the market. The average volume turnover decreased to Rs 22.51crores from Rs 29.66 crores the month prior.', 'status' => true, 'publish_date' => '0000-00-00' ) ), (int) 10 => array( 'MagazineArticle' => array( 'id' => '2220', 'magazine_issue_id' => '988', 'magazine_category_id' => '63', 'title' => 'Monthly Technical Analysis of Nepse (June 24th 2018 - July 22th 2018)', 'image' => null, 'short_content' => 'The benchmark index declined in the course of last month. Nepse decreased by 36.80 points (or down 3.02%) to close at 1181.66. The index continues to trade below 50-day moving average and 200-day moving average indicating bearish momentum in the market.', 'status' => true, 'publish_date' => '0000-00-00' ) ), (int) 11 => array( 'MagazineArticle' => array( 'id' => '2171', 'magazine_issue_id' => '987', 'magazine_category_id' => '63', 'title' => 'Monthly Technical Analysis of Nepse (May25th 2018 - June 21th 2018)', 'image' => null, 'short_content' => 'The benchmark index declined in the course of last month. Nepse decreased by 99.76 points (or down 7.57%) to close at 1218.46. The index breached 50-day moving average and still trading below 200-day moving average indicating bearish momentum in the market. ', 'status' => true, 'publish_date' => '0000-00-00' ) ), (int) 12 => array( 'MagazineArticle' => array( 'id' => '2147', 'magazine_issue_id' => '986', 'magazine_category_id' => '63', 'title' => 'Monthly Technical Analysis of Nepse (April 25th 2018 - May 24th 2018)', 'image' => null, 'short_content' => 'The benchmark index declined in the course of last month. Nepse decreased by 76.64 points (or down 4.90%) to close at 1318.22.The index moved towards 50-day moving average and still remains below the 200-day moving average. ', 'status' => true, 'publish_date' => '0000-00-00' ) ), (int) 13 => array( 'MagazineArticle' => array( 'id' => '2110', 'magazine_issue_id' => '985', 'magazine_category_id' => '63', 'title' => 'Monthly Technical Analysis of Nepse (March 22nd 2018 – April 24th 2018)', 'image' => null, 'short_content' => 'The benchmark index surged up in the course of last month. Nepse increased by a staggering 163.79 points (or up 12.97%) to close at 1394.86. The index crossed above the 50-day moving average, giving a bullish signal. However, the index still remains below the 200-day MA. New investors entering the market, as well as optimism regarding the implementation of online trading platform, has created this bullish trigger. ', 'status' => true, 'publish_date' => '0000-00-00' ) ), (int) 14 => array( 'MagazineArticle' => array( 'id' => '2089', 'magazine_issue_id' => '984', 'magazine_category_id' => '63', 'title' => 'Monthly Technical Analysis of Nepse (25 February to 21 March 2018)', 'image' => null, 'short_content' => 'The benchmark index continued its downfall in the course of last month. Nepse declined by a staggering 115.97 points (or down 11.78%) to close at 1231.01. The index moving below the 50-day and the 200-day moving average indicates bearish momentum in the market. ', 'status' => true, 'publish_date' => '0000-00-00' ) ), (int) 15 => array( 'MagazineArticle' => array( 'id' => '2062', 'magazine_issue_id' => '983', 'magazine_category_id' => '63', 'title' => 'Monthly Technical Analysis of Nepse (23 January to 22 February 2018)', 'image' => null, 'short_content' => 'The benchmark index continued its downfall in the course of last month. Nepse declined by 15.11 points (or down 1.02%) to close at 1386.98. The index moving below the 50-day and the 200-day moving average indicates bearish momentum in the market.', 'status' => true, 'publish_date' => '0000-00-00' ) ), (int) 16 => array( 'MagazineArticle' => array( 'id' => '2035', 'magazine_issue_id' => '982', 'magazine_category_id' => '63', 'title' => 'Monthly Technical Analysis of Nepse (24 December 2017 to 22 January 2018)', 'image' => null, 'short_content' => 'The benchmark index fell by 70.06 points (or down 4.75%) to close at 1402.09 last month. The index continued to move below the 50-day and the 200-day moving average, indicating a bearish momentum in the market. The market will likely remain bearish as the banks continue to face liquidity crunch.', 'status' => true, 'publish_date' => '0000-00-00' ) ), (int) 17 => array( 'MagazineArticle' => array( 'id' => '2011', 'magazine_issue_id' => '981', 'magazine_category_id' => '63', 'title' => 'Monthly Technical Analysis of Nepse (26 November to 21 December 2017)', 'image' => null, 'short_content' => 'The benchmark index fell by 21.14 points (or down 1.38%) to close at 1472.15 last month. The index has moved below the 50-day, as well as 200-day moving average, giving a bearish signal. Completion of the election at the beginning of the month did little to create bullish sentiment in the market.', 'status' => true, 'publish_date' => '0000-00-00' ) ), (int) 18 => array( 'MagazineArticle' => array( 'id' => '1982', 'magazine_issue_id' => '980', 'magazine_category_id' => '63', 'title' => 'Monthly Technical Analysis of Nepse (22 October to 23 November 2017)', 'image' => null, 'short_content' => 'The benchmark index fell by 75.06 points (or down 4.83%) to close at 1493.29 last month. The index is hovering below the 50-day, as well as the 200-day moving average. This shows the market to be in a bearish mode in the course of last month.', 'status' => true, 'publish_date' => '0000-00-00' ) ), (int) 19 => array( 'MagazineArticle' => array( 'id' => '1950', 'magazine_issue_id' => '979', 'magazine_category_id' => '63', 'title' => 'Monthly Technical Analysis of Nepse (20 September to 18 October 2017)', 'image' => null, 'short_content' => 'The benchmark index gained a modest 24.65 points (or up 1.67%) to close at 1568.35 last month. The index continues to move close to the 200-day moving average, which acts as a support level to the index. Favorable political outlook has triggered a bullish sentiment in the market. ', 'status' => true, 'publish_date' => '0000-00-00' ) ), (int) 20 => array( 'MagazineArticle' => array( 'id' => '1933', 'magazine_issue_id' => '978', 'magazine_category_id' => '63', 'title' => 'Monthly Technical Analysis of Nepse (22 August to 18 September 2017)', 'image' => null, 'short_content' => 'The benchmark index lost 67.87 points (or down 4.20%) to close at 1543.7 last month. The index fell below the 50-day, as well as 200-day moving average, which shows bearish sentiment in the market.', 'status' => true, 'publish_date' => '0000-00-00' ) ), (int) 21 => array( 'MagazineArticle' => array( 'id' => '1897', 'magazine_issue_id' => '977', 'magazine_category_id' => '63', 'title' => 'Monthly Technical Analysis of Nepse (25 July to 21 August 2017)', 'image' => null, 'short_content' => 'The benchmark index lost 17.51 points (or down 1.06%) to close at 1611.57 last month. The index remains above the 50-day, as well as 200 day moving average, signaling the market to be bullish. However, Nepse hovering close to the 50-day MA will test the respective MA for support level.', 'status' => true, 'publish_date' => '0000-00-00' ) ), (int) 22 => array( 'MagazineArticle' => array( 'id' => '1866', 'magazine_issue_id' => '976', 'magazine_category_id' => '63', 'title' => ' Monthly Technical Analysis of Nepse (25 June to 24 July 2017)', 'image' => null, 'short_content' => 'The benchmark index gained 69.59 points (or up 4.44%) to close at 1629.08 last month. Events such as release of monetary policy and talks regarding online trading system were witnessed in the course of last month. ', 'status' => true, 'publish_date' => '0000-00-00' ) ), (int) 23 => array( 'MagazineArticle' => array( 'id' => '1848', 'magazine_issue_id' => '975', 'magazine_category_id' => '63', 'title' => 'Monthly Technical Analysis of Nepse (28 May to 22 June 2017)', 'image' => null, 'short_content' => 'The benchmark index continued to fall in the course of last month. It declined by 70.09 points (or down -4.32%) last month to close at 1559.49. The index fell below the 50-day, as well as the 200-day moving average, giving a bearish signal.', 'status' => true, 'publish_date' => '0000-00-00' ) ), (int) 24 => array( 'MagazineArticle' => array( 'id' => '1801', 'magazine_issue_id' => '974', 'magazine_category_id' => '63', 'title' => 'Monthly Technical Analysis of Nepse (26 April to 24 May 2017)', 'image' => null, 'short_content' => 'The benchmark index declined from 1670.3 to 1629.58 in the course of last month. Its new support and resistance level stands at 1612 and 1780 level respectively. With no new bullish trigger, the index will likely test the new support level', 'status' => true, 'publish_date' => '0000-00-00' ) ), (int) 25 => array( 'MagazineArticle' => array( 'id' => '1780', 'magazine_issue_id' => '973', 'magazine_category_id' => '63', 'title' => 'Monthly Technical Analysis of Nepse (27 March to 25 April 2017)', 'image' => null, 'short_content' => 'The benchmark index continued its bullish run in the course of last month. Nepse gained 138.55 points (or up 9.08%) to close at 1672.38. Several factors supported the bullish momentum in the market. Positive political state of affairs, as well as Insurance Board’s directive to increase insurance capital,', 'status' => true, 'publish_date' => '0000-00-00' ) ), (int) 26 => array( 'MagazineArticle' => array( 'id' => '1753', 'magazine_issue_id' => '972', 'magazine_category_id' => '63', 'title' => 'Monthly Technical Analysis of Nepse (22 February to 26 March 2017)', 'image' => null, 'short_content' => 'The benchmark index experienced a remarkable climb in the course of last month. The index gained a staggering 176.26 points (or up 12.44%) to close at 1533.83. Gradual decrease in interest rates and positive hopes for political scenario seems to have caused a bullish trigger in the market. ', 'status' => true, 'publish_date' => '0000-00-00' ) ), (int) 27 => array( 'MagazineArticle' => array( 'id' => '1732', 'magazine_issue_id' => '971', 'magazine_category_id' => '63', 'title' => 'Monthly Technical Analysis of Nepse (20 January to 21 February 2017)', 'image' => null, 'short_content' => 'The benchmark index took a bearish ride at the beginning of last month, dropping as low as 1252.5 level. In the course of the month, Nepse lost a staggering 104.99 points (or down -6.93%) to close at 1357.57. Uncertain political environment and higher fixed deposit rate by the banks continues to create bearish sentiment in the market.', 'status' => true, 'publish_date' => '0000-00-00' ) ), (int) 28 => array( 'MagazineArticle' => array( 'id' => '1702', 'magazine_issue_id' => '970', 'magazine_category_id' => '63', 'title' => 'Nepse in Consolidation Stage', 'image' => null, 'short_content' => 'The benchmark indexcontinued to decline in the course of last month. The index lost 12.85 points (or down 0.87%) to close at 1462.56. Nepse continues to hover below the 200-day moving ..', 'status' => true, 'publish_date' => '0000-00-00' ) ), (int) 29 => array( 'MagazineArticle' => array( 'id' => '1650', 'magazine_issue_id' => '968', 'magazine_category_id' => '63', 'title' => 'Monthly Technical Analysis of Nepse (3 November to 30 November 2016)', 'image' => null, 'short_content' => 'The benchmark index experienced high volatility and bearish downturn in the course of last month. The index lost a staggering 151.38 points (or down 8.60%) to close at 1608.33. ', 'status' => true, 'publish_date' => '0000-00-00' ) ), (int) 30 => array( 'MagazineArticle' => array( 'id' => '1623', 'magazine_issue_id' => '967', 'magazine_category_id' => '63', 'title' => 'Monthly Technical Analysis of Nepse (23 September to 27 October 2016)', 'image' => null, 'short_content' => 'The benchmark index climbed up during the first half of last month. However, it took a U-turn during the second half of the month, indicating a bearish presence in the market. The index lost 7.2 points (or down 0.34%) last month to close at 1759.71. ', 'status' => true, 'publish_date' => '0000-00-00' ) ), (int) 31 => array( 'MagazineArticle' => array( 'id' => '1598', 'magazine_issue_id' => '966', 'magazine_category_id' => '63', 'title' => 'Monthly Technical Analysis of Nepse (28 August to 22 September 2016)', 'image' => null, 'short_content' => 'The benchmark index experienced a bullish run during the first half of last month. However, the second half of the month was triggered by a bearish momentum. Nepse gained 36.29 points (or up 2.12%) last month to close at 1766.91. ', 'status' => true, 'publish_date' => '0000-00-00' ) ), (int) 32 => array( 'MagazineArticle' => array( 'id' => '1567', 'magazine_issue_id' => '965', 'magazine_category_id' => '63', 'title' => 'Monthly Technical Analysis of Nepse (31 July to 25 August 2016)', 'image' => null, 'short_content' => 'The benchmark index went through high volatility last month. The index lost a staggering 147.31 points (or down -7.72%) to close at 1730.62. Nepse lost 202.02 points during the first half of the month. The index hit a negative, as well as positive circuit break during the middle of the month, as nervousness became apparent in the market. ', 'status' => true, 'publish_date' => '0000-00-00' ) ), (int) 33 => array( 'MagazineArticle' => array( 'id' => '1543', 'magazine_issue_id' => '964', 'magazine_category_id' => '63', 'title' => 'Monthly Technical Analysis of Nepse (28 June to 28 July 2016)', 'image' => null, 'short_content' => 'The benchmark index saw tremendous growth in the course of last month. The index gained 165.09 points (or up 7.86%) to close at 1877.93. Various policies and economic scenarios have supported the bullish sentiment in the market.', 'status' => true, 'publish_date' => '0000-00-00' ) ), (int) 34 => array( 'MagazineArticle' => array( 'id' => '1531', 'magazine_issue_id' => '963', 'magazine_category_id' => '63', 'title' => ' Monthly Technical Analysis of Nepse (26 May to 27 June 2016)', 'image' => null, 'short_content' => 'The benchmark index created history by breaking the 1600 and 1700 mark in the course of last month. The index gained a staggering 197.65 points (or up 12.34%) to close at 1721.77. The Insurance and Hydropower sectors have caused the market to climb further up', 'status' => true, 'publish_date' => '0000-00-00' ) ), (int) 35 => array( 'MagazineArticle' => array( 'id' => '1505', 'magazine_issue_id' => '962', 'magazine_category_id' => '63', 'title' => 'Monthly Technical Analysis of Nepse (2 May to 25 May 2016)', 'image' => null, 'short_content' => 'The benchmark index continues to create new heights as the bullish momentum is driving the market upward. The index gained 59.21 points (or up 4.01%) to close at 1524.12 in the course of last month. The market did correct itself during the course of the week. ', 'status' => true, 'publish_date' => '0000-00-00' ) ), (int) 36 => array( 'MagazineArticle' => array( 'id' => '1481', 'magazine_issue_id' => '961', 'magazine_category_id' => '63', 'title' => 'Monthly Technical Analysis of Nepse (28 March to 28 April 2016)', 'image' => null, 'short_content' => 'The benchmark index continued its upward climb last month as well. Nepse index gained 87.58 points (or up 6.21%) to close at an all time height of 1464.91. The index witnessed some corrections at the beginning of the month, as it declined by 25.79 points.', 'status' => true, 'publish_date' => '0000-00-00' ) ), (int) 37 => array( 'MagazineArticle' => array( 'id' => '1449', 'magazine_issue_id' => '959', 'magazine_category_id' => '63', 'title' => ' Monthly Technical Analysis of Nepse (31 January to 25 February 2016)', 'image' => null, 'short_content' => 'The benchmark index scaled up further in the course of last month. Nepse index gained a staggering 67.41 points (or up 5.43%) to close at 1283.52. The index is moving well above the 50-day moving average (MA) and 200-day MA, indicating that the overall market outlook looks good.', 'status' => true, 'publish_date' => '0000-00-00' ) ), (int) 38 => array( 'MagazineArticle' => array( 'id' => '1432', 'magazine_issue_id' => '958', 'magazine_category_id' => '63', 'title' => ' Monthly Technical Analysis of Nepse (27 December, 2015 to 28 January 2016)', 'image' => null, 'short_content' => 'The benchmark index increased further in the course of last month. The Nepse index gained a staggering 79.08 points (or up 6.77%) to close at 1216.11. Few reasons have caused the market to be bullish last month. Firstly, the bullish momentum was triggered by an increase in the demand in the insurance sector.', 'status' => true, 'publish_date' => '0000-00-00' ) ), (int) 39 => array( 'MagazineArticle' => array( 'id' => '1380', 'magazine_issue_id' => '956', 'magazine_category_id' => '63', 'title' => 'Monthly Technical Analysis of Nepse (1 November to 26 November, 2015)', 'image' => null, 'short_content' => 'or the first half of the month, the benchmark index moved sideways, hovering above its immediate support level of 1084. The index then reached a high level of 1109. However, for the second half of the month the index spiraled downwards, losing 48.03 points (or down 4.43%).', 'status' => true, 'publish_date' => '0000-00-00' ) ), (int) 40 => array( 'MagazineArticle' => array( 'id' => '1363', 'magazine_issue_id' => '955', 'magazine_category_id' => '63', 'title' => 'Why S&P 500 is expected to make an important low on 26th November, 2015 at 13:43 NEWYORK TIME ?', 'image' => '20151125121943_st.jpg', 'short_content' => 'You will see every time when the planet Venus travels the sign of Libra at 19.48 degree, the S&P makes an important low there. Not once or twice or thrice, but in year 2010, 2011, 2012, 2013 and 2014 – five years in a row - it was right on the spot and the next date is 26th November,2015.', 'status' => true, 'publish_date' => '0000-00-00' ) ), (int) 41 => array( 'MagazineArticle' => array( 'id' => '1324', 'magazine_issue_id' => '954', 'magazine_category_id' => '63', 'title' => 'Forecasting Gold Prices with Astrology’s Help ', 'image' => null, 'short_content' => 'Gold is ruled by the planet Sun and the sign Leo. When a benefic planet transits Leo and at the same time casts good aspects to the Sun or when it casts a good aspect to Leo from other signs the value of gold rises. ', 'status' => true, 'publish_date' => '0000-00-00' ) ), (int) 42 => array( 'MagazineArticle' => array( 'id' => '1338', 'magazine_issue_id' => '954', 'magazine_category_id' => '63', 'title' => 'Market Gone Flat after Breaching Record (Review for 25 August to 24 September, 2015)', 'image' => null, 'short_content' => 'The secondary market touched the historic high during the review period ahead of the promulgation of the long awaited new constitution. But after the constitution was promulgated, it shed some of the gains and remains flat then after. ', 'status' => true, 'publish_date' => '0000-00-00' ) ), (int) 43 => array( 'MagazineArticle' => array( 'id' => '1346', 'magazine_issue_id' => '954', 'magazine_category_id' => '63', 'title' => 'Monthly Technical Analysis of Nepse (23 August to 24 September, 2015)', 'image' => null, 'short_content' => 'Nepse index followed a sideways movement for most of last month. The benchmark index tested the 1200 mark three times in the course of previous month. On 15th September, Nepse reached its all time high of 1205.84 level. The current trend shows Nepse to be falling faintly, creating lower low in the support zone. ', 'status' => true, 'publish_date' => '0000-00-00' ) ), (int) 44 => array( 'MagazineArticle' => array( 'id' => '1294', 'magazine_issue_id' => '953', 'magazine_category_id' => '63', 'title' => 'The Most Awaited Trade of 2015', 'image' => null, 'short_content' => 'This trade is probably the most awaited trade of 2015. The entire world is anxious to know when the US stock indices are going to stop their unstoppable bull rally which started in 2009.', 'status' => true, 'publish_date' => '0000-00-00' ) ), (int) 45 => array( 'MagazineArticle' => array( 'id' => '1312', 'magazine_issue_id' => '953', 'magazine_category_id' => '63', 'title' => 'Rise and Rise of Nepse (Review for 23 July to 20 August, 2015)', 'image' => null, 'short_content' => 'Nepal’s Capital Market set the history’s new high during the review period as positive sentiments towards banking stocks led all the sectors. The benchmark Nepse index touched 1200.92 adding 197.54 points in the review period while the session’s low was at the opening (23 July) with 1003.38.', 'status' => true, 'publish_date' => '0000-00-00' ) ), (int) 46 => array( 'MagazineArticle' => array( 'id' => '1313', 'magazine_issue_id' => '953', 'magazine_category_id' => '63', 'title' => 'Monthly Technical Analysis of Nepse (26 July to 20 August, 2015) ', 'image' => null, 'short_content' => 'Nepse witnessed remarkable gains in the course of last month. The benchmark index rose by 197.54 points (or up 18.31%). It surpassed its previous resistance levels of 1036.98 and 1100 points and is moving well above the 50-day and 200-day moving average, and at a much higher rate, indicating a bullish outlook.', 'status' => true, 'publish_date' => '0000-00-00' ) ), (int) 47 => array( 'MagazineArticle' => array( 'id' => '1265', 'magazine_issue_id' => '952', 'magazine_category_id' => '63', 'title' => 'Stay Alert from September 14 to October 14', 'image' => null, 'short_content' => 'In our article, “Millionaires don’t use astrology but billionaires do” written on March 31 2015 and published in the May, 2015 issue of New Business Age we forecasted that: ', 'status' => true, 'publish_date' => '0000-00-00' ) ), (int) 48 => array( 'MagazineArticle' => array( 'id' => '1244', 'magazine_issue_id' => '928', 'magazine_category_id' => '63', 'title' => 'Moving Sideways', 'image' => null, 'short_content' => 'As the earthquake has destroyed property and hampered trade, consumption, investment and living patterns of the people, business activities have been hampered. However, the exact loss can be assesses only after the coming quarterly reports of the listed companies.', 'status' => true, 'publish_date' => '0000-00-00' ) ), (int) 49 => array( 'MagazineArticle' => array( 'id' => '1245', 'magazine_issue_id' => '928', 'magazine_category_id' => '63', 'title' => 'Are We Ready for the Next Stock Market Crash?', 'image' => null, 'short_content' => 'In US stock market history, so far we have seen three big crashes. The first crash was on 28th October 1929, followed by the second on 19th October 1987 and the last crash was on 6th October 2008.', 'status' => true, 'publish_date' => '0000-00-00' ) ), (int) 50 => array( 'MagazineArticle' => array( 'id' => '1246', 'magazine_issue_id' => '928', 'magazine_category_id' => '63', 'title' => 'Smarten Your Approach to the Secondary Market', 'image' => null, 'short_content' => 'Before investing in the secondary market, take a breather and evaluate yourself. What is your type? Are you an investor or a trader?', 'status' => true, 'publish_date' => '0000-00-00' ) ), (int) 51 => array( 'MagazineArticle' => array( 'id' => '1247', 'magazine_issue_id' => '928', 'magazine_category_id' => '63', 'title' => 'Monthly Technical Analysis of Nepse (May 24 to June 23, 2015)', 'image' => null, 'short_content' => 'The aftermath of the earthquake caused Nepse index to fall by 10.70%. Nevertheless, the index increased soon enough, rising by 15.43% halfway through last month. Currently, Nepse is at a correction period.', 'status' => true, 'publish_date' => '0000-00-00' ) ), (int) 52 => array( 'MagazineArticle' => array( 'id' => '1193', 'magazine_issue_id' => '889', 'magazine_category_id' => '63', 'title' => '11.47 Points Fall Ahead of Q3 Results', 'image' => null, 'short_content' => 'Most of the stocks turned red during the review period (Feb 18 - March 19) pushing the index to nearly two months low. The Nepse index closed in red losing 15.03 points or 1.53% to settle at 967.62. The index touched highest level on 9 March with 988.77 and the lowest was 959.14 on 16 March. ', 'status' => true, 'publish_date' => '0000-00-00' ) ), (int) 53 => array( 'MagazineArticle' => array( 'id' => '1194', 'magazine_issue_id' => '889', 'magazine_category_id' => '63', 'title' => 'Monthly Technical Analysis of Nepse (March 19 to April 23, 2015) : At Lowest Volatility of the Year', 'image' => null, 'short_content' => 'RSI is a form of leading indicator that is believed to be most effective during periods of sideways movement. Such indicators may create numerous buy and sell signals that are useful when the market is not clearly trending upwards or downwards. ', 'status' => true, 'publish_date' => '0000-00-00' ) ), (int) 54 => array( 'MagazineArticle' => array( 'id' => '1166', 'magazine_issue_id' => '863', 'magazine_category_id' => '63', 'title' => 'Market @ Two Months’ Low', 'image' => null, 'short_content' => 'Most of the stocks turned red during the review period (Feb 18 - March 19) pushing the index to nearly two months low. The Nepse index closed in red losing 15.03 points or 1.53% to settle at 967.62. The index touched highest level on 9 March with 988.77 and the lowest was 959.14 on 16 March. ', 'status' => true, 'publish_date' => '0000-00-00' ) ), (int) 55 => array( 'MagazineArticle' => array( 'id' => '1167', 'magazine_issue_id' => '863', 'magazine_category_id' => '63', 'title' => 'Technical Analysis Monthly (February 19 to March 19, 2015) Bearish Signals', 'image' => null, 'short_content' => ' Nepse has not made much improvement in the past 30 days as compared to the growth witnessed in the previous months. Nepse decreased by -19.43 points (or -1.95%) to close at 967.62 points. It fell below its support level of 972.17, which is now its new resistance level. ', 'status' => true, 'publish_date' => '0000-00-00' ) ), (int) 56 => array( 'MagazineArticle' => array( 'id' => '1139', 'magazine_issue_id' => '839', 'magazine_category_id' => '63', 'title' => 'Nepse Slows Down', 'image' => null, 'short_content' => 'The secondary market of Nepal stalled after reaching nearly six months high while political uncertainties compelled the investors to wait-and-watch. The benchmark Nepse index added 7.20 points or 0.74 per cent to rest at 982.62. ', 'status' => true, 'publish_date' => '0000-00-00' ) ), (int) 57 => array( 'MagazineArticle' => array( 'id' => '1140', 'magazine_issue_id' => '839', 'magazine_category_id' => '63', 'title' => 'Technical Analysis Monthly (Jan 20, 14 – Feb 19, 15) : Bullish Signal for Long Term', 'image' => null, 'short_content' => 'After the huge gains witnessed in the previous periods, Nepse remained almost flat during the past 30 days. However, there was an overall positive gain in the market as Nepse increased by 7.2 points (or 0.74%) to close at 982.65 points.', 'status' => true, 'publish_date' => '0000-00-00' ) ), (int) 58 => array( 'MagazineArticle' => array( 'id' => '1108', 'magazine_issue_id' => '811', 'magazine_category_id' => '63', 'title' => 'Waiting for Confirmation Signal', 'image' => null, 'short_content' => 'Nepal’s secondary market turned little green with hopes that agreement between major political parties on contentious issues of new constitution was underway. The Nepse index accelerated 66.19 points or 7.38 per cent to close at 962.80. ', 'status' => true, 'publish_date' => '0000-00-00' ) ), (int) 59 => array( 'MagazineArticle' => array( 'id' => '1109', 'magazine_issue_id' => '811', 'magazine_category_id' => '63', 'title' => 'Technical Analysis Monthly (Dec 21, 2014 to Jan 20, 2015)', 'image' => null, 'short_content' => 'Giving continuity to the previous period’s positive momentum, Nepse has been able to make remarkable gains during this period. The stock market moved past its strong resistance level of 938.41 to close at 962.8 points – an increase of 58.91 points or 6.52 per cent.', 'status' => true, 'publish_date' => '0000-00-00' ) ), (int) 60 => array( 'MagazineArticle' => array( 'id' => '1064', 'magazine_issue_id' => '783', 'magazine_category_id' => '63', 'title' => 'Politics Still a Factor', 'image' => null, 'short_content' => 'Most of the listed companies have declared their dividends and few others are about to make these announcements. This means that the price adjustment of the stock after dividend declaration has also played role in driving the prices lower for such few companies. ', 'status' => true, 'publish_date' => '0000-00-00' ) ), (int) 61 => array( 'MagazineArticle' => array( 'id' => '1065', 'magazine_issue_id' => '783', 'magazine_category_id' => '63', 'title' => 'Technical Analysis Monthly (Nov 21 – Dec 20) : Fighting 916 Resistance', 'image' => null, 'short_content' => 'There was significant sideways movement in Nepse in the period between Nov 21, 2014 and Dec 20, 2014. The immediate support level of 844.42 was tested three times while the imme-diate resistance level of 875.56 was tested once in the review period.', 'status' => true, 'publish_date' => '0000-00-00' ) ), (int) 62 => array( 'MagazineArticle' => array( 'id' => '1036', 'magazine_issue_id' => '756', 'magazine_category_id' => '63', 'title' => 'Market Dips to 6 Months Low', 'image' => null, 'short_content' => 'The stock market of Nepal plunged to 6 months low in the review period as gloomy political winter cooled investors’ sentiment. The Nepse index lost 61.84 points or 6.69% to rest at 862.5 while the session’s high was on 27 Oct with 935.01 and lowest was on 18 Nov with 844.06. ', 'status' => true, 'publish_date' => '0000-00-00' ) ), (int) 63 => array( 'MagazineArticle' => array( 'id' => '1037', 'magazine_issue_id' => '756', 'magazine_category_id' => '63', 'title' => 'Technical Analysis Monthly (Oct 20 – Nov 20)', 'image' => null, 'short_content' => 'Since Nepse peaked at 1083.55 points on July 21, 2014, the stock market has been following a bearish pattern. Though the markets stabilized and saw a 2.88% rebound during the last trading period, overall Nepse has continued its downward trend', 'status' => true, 'publish_date' => '0000-00-00' ) ), (int) 64 => array( 'MagazineArticle' => array( 'id' => '1038', 'magazine_issue_id' => '756', 'magazine_category_id' => '63', 'title' => 'Ups and Downs in Nepali Stock Market', 'image' => null, 'short_content' => 'Ups and downs in the indicators of the stock market are a regular phenomenon. The market goes up when more investors exercise for buying stocks and slips down when more investors are in the mood to sell their shares. If they quickly want to exit from the market,', 'status' => true, 'publish_date' => '0000-00-00' ) ), (int) 65 => array( 'MagazineArticle' => array( 'id' => '992', 'magazine_issue_id' => '730', 'magazine_category_id' => '63', 'title' => 'Market Stalled after Losing Steam', 'image' => null, 'short_content' => 'The Nepali stock market remained stable during the review period despite the recent sharp fall. The benchmark Nepse index added 3.71 points or 0.40% to reach 923.59 while the session’s high was on 30 September with 937.99 and lowest was on 22 September with 881.87. ', 'status' => true, 'publish_date' => '0000-00-00' ) ), (int) 66 => array( 'MagazineArticle' => array( 'id' => '993', 'magazine_issue_id' => '730', 'magazine_category_id' => '63', 'title' => 'Monthly Technical Analysis of Nepse November 2014', 'image' => null, 'short_content' => 'After two continuous trading periods of huge declines, Nepse has stabilized in recent times. Compared to the previous period, Nepse made an upward gain of 25.96 points (or 2.88%) closing at 925.85 points. ', 'status' => true, 'publish_date' => '0000-00-00' ) ), (int) 67 => array( 'MagazineArticle' => array( 'id' => '994', 'magazine_issue_id' => '730', 'magazine_category_id' => '63', 'title' => 'Privatization, Corporatization and Strategic Partner for NEPSE', 'image' => null, 'short_content' => 'Historically stock exchanges started as a mutually governed, non-profit making, self-regulated cooperative like structures. Mostly brokers were the owners of such exchanges. However, due to the change in the technology and the concept of securities commission as apex regulator', 'status' => true, 'publish_date' => '0000-00-00' ) ), (int) 68 => array( 'MagazineArticle' => array( 'id' => '920', 'magazine_issue_id' => '678', 'magazine_category_id' => '63', 'title' => 'The Big Retreat', 'image' => null, 'short_content' => 'The Nepali bourse cooled down after reaching a high of 1083.55 as selling pressure ruled the market. The benchmark Nepse index plummeted 61.35 points or 5.71% to close at 1013.6 while session’s high was on 21st July with 1083.55 and lowest on 18th August with 1013.25. ', 'status' => true, 'publish_date' => '0000-00-00' ) ), (int) 69 => array( 'MagazineArticle' => array( 'id' => '921', 'magazine_issue_id' => '678', 'magazine_category_id' => '63', 'title' => 'Monthly Technical Analysis of Nepse (July 21 - August 14, 2014)', 'image' => null, 'short_content' => 'On the first trading day of the review period the secondary market had witnessed the highest rise as the benchmark index settled at 1083.55 points, a new high since the last 6 years. On the same day Nepse had attained the highest turnover of NPR 1.20 billion on a single trading day in its history.', 'status' => true, 'publish_date' => '0000-00-00' ) ), (int) 70 => array( 'MagazineArticle' => array( 'id' => '952', 'magazine_issue_id' => '704', 'magazine_category_id' => '63', 'title' => 'The End of Bull Run', 'image' => null, 'short_content' => 'The stock market of Nepal which was predicted to break the previous historic high level of 1175.38 points pulled back from 1083.55 and witnessed a nose dive sessions. ', 'status' => true, 'publish_date' => '0000-00-00' ) ), (int) 71 => array( 'MagazineArticle' => array( 'id' => '953', 'magazine_issue_id' => '704', 'magazine_category_id' => '63', 'title' => 'Monthly Technical Analysis of Nepse October 2014', 'image' => null, 'short_content' => 'Nepal Stock Exchange (Nepse) index continued spiralling downwards during the August 19 to September 18, 2014 period, just like the preceding period. During the review period, Nepse fell by 134.5 points (-13 per cent) to close at 899.89 points.', 'status' => true, 'publish_date' => '0000-00-00' ) ), (int) 72 => array( 'MagazineArticle' => array( 'id' => '954', 'magazine_issue_id' => '704', 'magazine_category_id' => '63', 'title' => 'NRN Investment through Capital Market', 'image' => null, 'short_content' => '‘Economic Roadmap for Prosperous Nepal’ was the main theme of 8th NRN regional conference held on Nagano, Japan from September 18 to 19. About three hundred NRNs had participated from different part of the globe to discuss on the given theme. ', 'status' => true, 'publish_date' => '0000-00-00' ) ), (int) 73 => array( 'MagazineArticle' => array( 'id' => '1405', 'magazine_issue_id' => '957', 'magazine_category_id' => '63', 'title' => 'Monthly Technical Analysis of Nepse (29 November to 24 December, 2015)', 'image' => null, 'short_content' => 'The benchmark index saw huge changes in the course of last month. Despite all the difficulties and political unrest in the country, Nepse gained a staggering 114.26 points (or up 11.17%) to close at 1137.03. It seems that the monetary policy is still playing a major role in causing the market to be bullish.', 'status' => true, 'publish_date' => '0000-00-00' ) ) ) $magazineCategory = array( 'MagazineCategory' => array( 'id' => '63', 'title' => 'Stock Taking', 'sortorder' => '516', 'status' => true, 'created' => '0000-00-00 00:00:00', 'homepage' => true, 'modified' => '2013-04-01 00:00:00' ) ) $magazineArticle = array( 'MagazineArticle' => array( 'id' => '954', 'magazine_issue_id' => '704', 'magazine_category_id' => '63', 'title' => 'NRN Investment through Capital Market', 'image' => null, 'short_content' => '‘Economic Roadmap for Prosperous Nepal’ was the main theme of 8th NRN regional conference held on Nagano, Japan from September 18 to 19. About three hundred NRNs had participated from different part of the globe to discuss on the given theme. ', 'status' => true, 'publish_date' => '0000-00-00' ) ) $issue_title = array() $width = (int) 400 $height = (int) 230 $ratio = (float) 1.7391304347826 $img_width = (int) 160 $img_height = (float) 92include - APP/View/MagazineArticles/category.ctp, line 86 View::_evaluate() - CORE/Cake/View/View.php, line 971 View::_render() - CORE/Cake/View/View.php, line 933 View::render() - CORE/Cake/View/View.php, line 473 Controller::render() - CORE/Cake/Controller/Controller.php, line 968 Dispatcher::_invoke() - CORE/Cake/Routing/Dispatcher.php, line 200 Dispatcher::dispatch() - CORE/Cake/Routing/Dispatcher.php, line 167 [main] - APP/webroot/index.php, line 117
Notice (8): Undefined index: MagazineIssue [APP/View/MagazineArticles/category.ctp, line 86]Code Context<div class="category"><span class="label label-danger"><?php echo $this->Html->link($issue_title['MagazineIssue']['title'],$viewFile = '/var/www/html/newbusinessage.com/app/View/MagazineArticles/category.ctp' $dataForView = array( 'current_user' => null, 'logged_in' => false ) $current_user = null $logged_in = false $cat_id = '63' $magazineArticles = array( (int) 0 => array( 'MagazineArticle' => array( 'id' => '2742', 'magazine_issue_id' => '1006', 'magazine_category_id' => '63', 'title' => 'Monthly Technical Analysis (November 24th -December 19th 2019)', 'image' => '20201010020410_Clipboard30.jpg', 'short_content' => 'NEPSE index gained 39.57 points (or up 3.56 %) to close at 1149.65 last month. Last month 50 days moving average of NEPSE was crossed from below which showed short term bull. However, NEPSE is trading below 200 days moving average which shows that overall long term sentiment is still bearish.', 'status' => true, 'publish_date' => null ) ), (int) 1 => array( 'MagazineArticle' => array( 'id' => '2508', 'magazine_issue_id' => '998', 'magazine_category_id' => '63', 'title' => 'Monthly Technical Analysis of Nepse March 24th 2019 – April 22th 2019', 'image' => '20190511100832_Clipboard24.jpg', 'short_content' => 'NEPSE gained 116.34 points (or up 10.20%) to close at 1250.94 last month that ended on April 22. Last month, NEPSE showed a bullish momentum breaking the resistance level of 200 days moving average. Currently, NEPSE is trading above the 50 days moving average and 200 days moving average. The average daily volume turnover has increased to NPR 53.01 crores from NPR 30.26 crores', 'status' => true, 'publish_date' => null ) ), (int) 2 => array( 'MagazineArticle' => array( 'id' => '2464', 'magazine_issue_id' => '997', 'magazine_category_id' => '63', 'title' => 'Monthly Technical Analysis of Nepse (February 27th 2019 – March 21th 2019)', 'image' => '20190403054014_1111.jpg', 'short_content' => 'NEPSE gained 38.04 points (or up 3.45%) to close at 1140.6 last month. At the beginning of month, NEPSE showed a bullish momentum breaking the resistance level of 50 days moving average.', 'status' => true, 'publish_date' => null ) ), (int) 3 => array( 'MagazineArticle' => array( 'id' => '2429', 'magazine_issue_id' => '996', 'magazine_category_id' => '63', 'title' => 'Monthly Technical Analysis of Nepse (January 26rd 2019 – February 16th 2019)', 'image' => '20190307122140_Clipboard04.jpg', 'short_content' => 'NEPSE index lost 85.21 points (or down 7.17%) to close at 1102.56 last month. Currently, NEPSE is trading below the 200 days moving average. At the beginning of the month, NEPSE breached the support level of 50 days moving average and traded below the 50 days moving average. ', 'status' => true, 'publish_date' => null ) ), (int) 4 => array( 'MagazineArticle' => array( 'id' => '2403', 'magazine_issue_id' => '995', 'magazine_category_id' => '63', 'title' => 'Monthly Technical Analysis of Nepse (December 23rd 2018 – January 17th 2019)', 'image' => '20190215124248_Clipboard07.jpg', 'short_content' => 'NEPSE index gained 21.8 (or up 1.87%) to close at 1187.77 last month. At the beginning of last month, NEPSE index showed bullish momentum by breaching the resistance of 50 days moving average. However, NEPSE index could not breach the 200 days moving average and retraced back forming a shooting star candle. Currently, NEPSE is trading above 50 days moving average and below 200 days moving says average.', 'status' => true, 'publish_date' => null ) ), (int) 5 => array( 'MagazineArticle' => array( 'id' => '2359', 'magazine_issue_id' => '993', 'magazine_category_id' => '63', 'title' => 'Monthly Technical Analysis of Nepse (November 25, 2018 – December 20, 2018)', 'image' => '20190110065454_Clipboard10.jpg', 'short_content' => 'NEPSE index lost 15.27 (or down 1.293%) to close at 1165.97 last month. Currently, the index is trading below the 50 days moving average and 200 days moving average. During the course of last month, NEPSE index breached the support level of 1150, reached the low level of 1120.84 forming a spinning bottom and bounced back to close at 1165.97.', 'status' => true, 'publish_date' => '2019-01-10' ) ), (int) 6 => array( 'MagazineArticle' => array( 'id' => '2325', 'magazine_issue_id' => '992', 'magazine_category_id' => '63', 'title' => 'Monthly Technical Analysis of Nepse (October 26, 2018 – November 22, 2018)', 'image' => null, 'short_content' => 'NEPSE index lost 59.70 (or down 4.81%) to close at 1181.41 last month. Currently, the index is trading below the 50 days moving average and 200 days moving average. NEPSE breached the support level of 50 days moving average.', 'status' => true, 'publish_date' => '0000-00-00' ) ), (int) 7 => array( 'MagazineArticle' => array( 'id' => '2294', 'magazine_issue_id' => '991', 'magazine_category_id' => '63', 'title' => 'Monthly Technical Analysis of Nepse (September 26th 2018 – October 25th 2018)', 'image' => null, 'short_content' => 'NEPSE index lost 36.63 (or down 2.867%) to close at 1241.11 last month. Currently, the index is trading above the 50 days moving average. However, the index is still moving below 200 days moving average.', 'status' => true, 'publish_date' => '0000-00-00' ) ), (int) 8 => array( 'MagazineArticle' => array( 'id' => '2264', 'magazine_issue_id' => '990', 'magazine_category_id' => '63', 'title' => 'Monthly Technical Analysis of Nepse (August 26th 2018 – September 26th 2018)', 'image' => null, 'short_content' => 'NEPSE index experienced high volatility in the course of last month. It gained 102.02 (or up 8.68%) to close at 1277.74 last month. Currently, the index is trading above 50 days moving average. However, the index is still moving below 200-day moving average. ', 'status' => true, 'publish_date' => '0000-00-00' ) ), (int) 9 => array( 'MagazineArticle' => array( 'id' => '2232', 'magazine_issue_id' => '989', 'magazine_category_id' => '63', 'title' => 'Monthly Technical Analysis of Nepse (July 22nd 2018 - August 23rd 2018)', 'image' => null, 'short_content' => 'Nepse index lost 3.16 points (or down0.27%) to close at 1178.5 last month. The index continues to trade below50-day moving average and 200-day moving average indicating bearish momentum in the market. The average volume turnover decreased to Rs 22.51crores from Rs 29.66 crores the month prior.', 'status' => true, 'publish_date' => '0000-00-00' ) ), (int) 10 => array( 'MagazineArticle' => array( 'id' => '2220', 'magazine_issue_id' => '988', 'magazine_category_id' => '63', 'title' => 'Monthly Technical Analysis of Nepse (June 24th 2018 - July 22th 2018)', 'image' => null, 'short_content' => 'The benchmark index declined in the course of last month. Nepse decreased by 36.80 points (or down 3.02%) to close at 1181.66. The index continues to trade below 50-day moving average and 200-day moving average indicating bearish momentum in the market.', 'status' => true, 'publish_date' => '0000-00-00' ) ), (int) 11 => array( 'MagazineArticle' => array( 'id' => '2171', 'magazine_issue_id' => '987', 'magazine_category_id' => '63', 'title' => 'Monthly Technical Analysis of Nepse (May25th 2018 - June 21th 2018)', 'image' => null, 'short_content' => 'The benchmark index declined in the course of last month. Nepse decreased by 99.76 points (or down 7.57%) to close at 1218.46. The index breached 50-day moving average and still trading below 200-day moving average indicating bearish momentum in the market. ', 'status' => true, 'publish_date' => '0000-00-00' ) ), (int) 12 => array( 'MagazineArticle' => array( 'id' => '2147', 'magazine_issue_id' => '986', 'magazine_category_id' => '63', 'title' => 'Monthly Technical Analysis of Nepse (April 25th 2018 - May 24th 2018)', 'image' => null, 'short_content' => 'The benchmark index declined in the course of last month. Nepse decreased by 76.64 points (or down 4.90%) to close at 1318.22.The index moved towards 50-day moving average and still remains below the 200-day moving average. ', 'status' => true, 'publish_date' => '0000-00-00' ) ), (int) 13 => array( 'MagazineArticle' => array( 'id' => '2110', 'magazine_issue_id' => '985', 'magazine_category_id' => '63', 'title' => 'Monthly Technical Analysis of Nepse (March 22nd 2018 – April 24th 2018)', 'image' => null, 'short_content' => 'The benchmark index surged up in the course of last month. Nepse increased by a staggering 163.79 points (or up 12.97%) to close at 1394.86. The index crossed above the 50-day moving average, giving a bullish signal. However, the index still remains below the 200-day MA. New investors entering the market, as well as optimism regarding the implementation of online trading platform, has created this bullish trigger. ', 'status' => true, 'publish_date' => '0000-00-00' ) ), (int) 14 => array( 'MagazineArticle' => array( 'id' => '2089', 'magazine_issue_id' => '984', 'magazine_category_id' => '63', 'title' => 'Monthly Technical Analysis of Nepse (25 February to 21 March 2018)', 'image' => null, 'short_content' => 'The benchmark index continued its downfall in the course of last month. Nepse declined by a staggering 115.97 points (or down 11.78%) to close at 1231.01. The index moving below the 50-day and the 200-day moving average indicates bearish momentum in the market. ', 'status' => true, 'publish_date' => '0000-00-00' ) ), (int) 15 => array( 'MagazineArticle' => array( 'id' => '2062', 'magazine_issue_id' => '983', 'magazine_category_id' => '63', 'title' => 'Monthly Technical Analysis of Nepse (23 January to 22 February 2018)', 'image' => null, 'short_content' => 'The benchmark index continued its downfall in the course of last month. Nepse declined by 15.11 points (or down 1.02%) to close at 1386.98. The index moving below the 50-day and the 200-day moving average indicates bearish momentum in the market.', 'status' => true, 'publish_date' => '0000-00-00' ) ), (int) 16 => array( 'MagazineArticle' => array( 'id' => '2035', 'magazine_issue_id' => '982', 'magazine_category_id' => '63', 'title' => 'Monthly Technical Analysis of Nepse (24 December 2017 to 22 January 2018)', 'image' => null, 'short_content' => 'The benchmark index fell by 70.06 points (or down 4.75%) to close at 1402.09 last month. The index continued to move below the 50-day and the 200-day moving average, indicating a bearish momentum in the market. The market will likely remain bearish as the banks continue to face liquidity crunch.', 'status' => true, 'publish_date' => '0000-00-00' ) ), (int) 17 => array( 'MagazineArticle' => array( 'id' => '2011', 'magazine_issue_id' => '981', 'magazine_category_id' => '63', 'title' => 'Monthly Technical Analysis of Nepse (26 November to 21 December 2017)', 'image' => null, 'short_content' => 'The benchmark index fell by 21.14 points (or down 1.38%) to close at 1472.15 last month. The index has moved below the 50-day, as well as 200-day moving average, giving a bearish signal. Completion of the election at the beginning of the month did little to create bullish sentiment in the market.', 'status' => true, 'publish_date' => '0000-00-00' ) ), (int) 18 => array( 'MagazineArticle' => array( 'id' => '1982', 'magazine_issue_id' => '980', 'magazine_category_id' => '63', 'title' => 'Monthly Technical Analysis of Nepse (22 October to 23 November 2017)', 'image' => null, 'short_content' => 'The benchmark index fell by 75.06 points (or down 4.83%) to close at 1493.29 last month. The index is hovering below the 50-day, as well as the 200-day moving average. This shows the market to be in a bearish mode in the course of last month.', 'status' => true, 'publish_date' => '0000-00-00' ) ), (int) 19 => array( 'MagazineArticle' => array( 'id' => '1950', 'magazine_issue_id' => '979', 'magazine_category_id' => '63', 'title' => 'Monthly Technical Analysis of Nepse (20 September to 18 October 2017)', 'image' => null, 'short_content' => 'The benchmark index gained a modest 24.65 points (or up 1.67%) to close at 1568.35 last month. The index continues to move close to the 200-day moving average, which acts as a support level to the index. Favorable political outlook has triggered a bullish sentiment in the market. ', 'status' => true, 'publish_date' => '0000-00-00' ) ), (int) 20 => array( 'MagazineArticle' => array( 'id' => '1933', 'magazine_issue_id' => '978', 'magazine_category_id' => '63', 'title' => 'Monthly Technical Analysis of Nepse (22 August to 18 September 2017)', 'image' => null, 'short_content' => 'The benchmark index lost 67.87 points (or down 4.20%) to close at 1543.7 last month. The index fell below the 50-day, as well as 200-day moving average, which shows bearish sentiment in the market.', 'status' => true, 'publish_date' => '0000-00-00' ) ), (int) 21 => array( 'MagazineArticle' => array( 'id' => '1897', 'magazine_issue_id' => '977', 'magazine_category_id' => '63', 'title' => 'Monthly Technical Analysis of Nepse (25 July to 21 August 2017)', 'image' => null, 'short_content' => 'The benchmark index lost 17.51 points (or down 1.06%) to close at 1611.57 last month. The index remains above the 50-day, as well as 200 day moving average, signaling the market to be bullish. However, Nepse hovering close to the 50-day MA will test the respective MA for support level.', 'status' => true, 'publish_date' => '0000-00-00' ) ), (int) 22 => array( 'MagazineArticle' => array( 'id' => '1866', 'magazine_issue_id' => '976', 'magazine_category_id' => '63', 'title' => ' Monthly Technical Analysis of Nepse (25 June to 24 July 2017)', 'image' => null, 'short_content' => 'The benchmark index gained 69.59 points (or up 4.44%) to close at 1629.08 last month. Events such as release of monetary policy and talks regarding online trading system were witnessed in the course of last month. ', 'status' => true, 'publish_date' => '0000-00-00' ) ), (int) 23 => array( 'MagazineArticle' => array( 'id' => '1848', 'magazine_issue_id' => '975', 'magazine_category_id' => '63', 'title' => 'Monthly Technical Analysis of Nepse (28 May to 22 June 2017)', 'image' => null, 'short_content' => 'The benchmark index continued to fall in the course of last month. It declined by 70.09 points (or down -4.32%) last month to close at 1559.49. The index fell below the 50-day, as well as the 200-day moving average, giving a bearish signal.', 'status' => true, 'publish_date' => '0000-00-00' ) ), (int) 24 => array( 'MagazineArticle' => array( 'id' => '1801', 'magazine_issue_id' => '974', 'magazine_category_id' => '63', 'title' => 'Monthly Technical Analysis of Nepse (26 April to 24 May 2017)', 'image' => null, 'short_content' => 'The benchmark index declined from 1670.3 to 1629.58 in the course of last month. Its new support and resistance level stands at 1612 and 1780 level respectively. With no new bullish trigger, the index will likely test the new support level', 'status' => true, 'publish_date' => '0000-00-00' ) ), (int) 25 => array( 'MagazineArticle' => array( 'id' => '1780', 'magazine_issue_id' => '973', 'magazine_category_id' => '63', 'title' => 'Monthly Technical Analysis of Nepse (27 March to 25 April 2017)', 'image' => null, 'short_content' => 'The benchmark index continued its bullish run in the course of last month. Nepse gained 138.55 points (or up 9.08%) to close at 1672.38. Several factors supported the bullish momentum in the market. Positive political state of affairs, as well as Insurance Board’s directive to increase insurance capital,', 'status' => true, 'publish_date' => '0000-00-00' ) ), (int) 26 => array( 'MagazineArticle' => array( 'id' => '1753', 'magazine_issue_id' => '972', 'magazine_category_id' => '63', 'title' => 'Monthly Technical Analysis of Nepse (22 February to 26 March 2017)', 'image' => null, 'short_content' => 'The benchmark index experienced a remarkable climb in the course of last month. The index gained a staggering 176.26 points (or up 12.44%) to close at 1533.83. Gradual decrease in interest rates and positive hopes for political scenario seems to have caused a bullish trigger in the market. ', 'status' => true, 'publish_date' => '0000-00-00' ) ), (int) 27 => array( 'MagazineArticle' => array( 'id' => '1732', 'magazine_issue_id' => '971', 'magazine_category_id' => '63', 'title' => 'Monthly Technical Analysis of Nepse (20 January to 21 February 2017)', 'image' => null, 'short_content' => 'The benchmark index took a bearish ride at the beginning of last month, dropping as low as 1252.5 level. In the course of the month, Nepse lost a staggering 104.99 points (or down -6.93%) to close at 1357.57. Uncertain political environment and higher fixed deposit rate by the banks continues to create bearish sentiment in the market.', 'status' => true, 'publish_date' => '0000-00-00' ) ), (int) 28 => array( 'MagazineArticle' => array( 'id' => '1702', 'magazine_issue_id' => '970', 'magazine_category_id' => '63', 'title' => 'Nepse in Consolidation Stage', 'image' => null, 'short_content' => 'The benchmark indexcontinued to decline in the course of last month. The index lost 12.85 points (or down 0.87%) to close at 1462.56. Nepse continues to hover below the 200-day moving ..', 'status' => true, 'publish_date' => '0000-00-00' ) ), (int) 29 => array( 'MagazineArticle' => array( 'id' => '1650', 'magazine_issue_id' => '968', 'magazine_category_id' => '63', 'title' => 'Monthly Technical Analysis of Nepse (3 November to 30 November 2016)', 'image' => null, 'short_content' => 'The benchmark index experienced high volatility and bearish downturn in the course of last month. The index lost a staggering 151.38 points (or down 8.60%) to close at 1608.33. ', 'status' => true, 'publish_date' => '0000-00-00' ) ), (int) 30 => array( 'MagazineArticle' => array( 'id' => '1623', 'magazine_issue_id' => '967', 'magazine_category_id' => '63', 'title' => 'Monthly Technical Analysis of Nepse (23 September to 27 October 2016)', 'image' => null, 'short_content' => 'The benchmark index climbed up during the first half of last month. However, it took a U-turn during the second half of the month, indicating a bearish presence in the market. The index lost 7.2 points (or down 0.34%) last month to close at 1759.71. ', 'status' => true, 'publish_date' => '0000-00-00' ) ), (int) 31 => array( 'MagazineArticle' => array( 'id' => '1598', 'magazine_issue_id' => '966', 'magazine_category_id' => '63', 'title' => 'Monthly Technical Analysis of Nepse (28 August to 22 September 2016)', 'image' => null, 'short_content' => 'The benchmark index experienced a bullish run during the first half of last month. However, the second half of the month was triggered by a bearish momentum. Nepse gained 36.29 points (or up 2.12%) last month to close at 1766.91. ', 'status' => true, 'publish_date' => '0000-00-00' ) ), (int) 32 => array( 'MagazineArticle' => array( 'id' => '1567', 'magazine_issue_id' => '965', 'magazine_category_id' => '63', 'title' => 'Monthly Technical Analysis of Nepse (31 July to 25 August 2016)', 'image' => null, 'short_content' => 'The benchmark index went through high volatility last month. The index lost a staggering 147.31 points (or down -7.72%) to close at 1730.62. Nepse lost 202.02 points during the first half of the month. The index hit a negative, as well as positive circuit break during the middle of the month, as nervousness became apparent in the market. ', 'status' => true, 'publish_date' => '0000-00-00' ) ), (int) 33 => array( 'MagazineArticle' => array( 'id' => '1543', 'magazine_issue_id' => '964', 'magazine_category_id' => '63', 'title' => 'Monthly Technical Analysis of Nepse (28 June to 28 July 2016)', 'image' => null, 'short_content' => 'The benchmark index saw tremendous growth in the course of last month. The index gained 165.09 points (or up 7.86%) to close at 1877.93. Various policies and economic scenarios have supported the bullish sentiment in the market.', 'status' => true, 'publish_date' => '0000-00-00' ) ), (int) 34 => array( 'MagazineArticle' => array( 'id' => '1531', 'magazine_issue_id' => '963', 'magazine_category_id' => '63', 'title' => ' Monthly Technical Analysis of Nepse (26 May to 27 June 2016)', 'image' => null, 'short_content' => 'The benchmark index created history by breaking the 1600 and 1700 mark in the course of last month. The index gained a staggering 197.65 points (or up 12.34%) to close at 1721.77. The Insurance and Hydropower sectors have caused the market to climb further up', 'status' => true, 'publish_date' => '0000-00-00' ) ), (int) 35 => array( 'MagazineArticle' => array( 'id' => '1505', 'magazine_issue_id' => '962', 'magazine_category_id' => '63', 'title' => 'Monthly Technical Analysis of Nepse (2 May to 25 May 2016)', 'image' => null, 'short_content' => 'The benchmark index continues to create new heights as the bullish momentum is driving the market upward. The index gained 59.21 points (or up 4.01%) to close at 1524.12 in the course of last month. The market did correct itself during the course of the week. ', 'status' => true, 'publish_date' => '0000-00-00' ) ), (int) 36 => array( 'MagazineArticle' => array( 'id' => '1481', 'magazine_issue_id' => '961', 'magazine_category_id' => '63', 'title' => 'Monthly Technical Analysis of Nepse (28 March to 28 April 2016)', 'image' => null, 'short_content' => 'The benchmark index continued its upward climb last month as well. Nepse index gained 87.58 points (or up 6.21%) to close at an all time height of 1464.91. The index witnessed some corrections at the beginning of the month, as it declined by 25.79 points.', 'status' => true, 'publish_date' => '0000-00-00' ) ), (int) 37 => array( 'MagazineArticle' => array( 'id' => '1449', 'magazine_issue_id' => '959', 'magazine_category_id' => '63', 'title' => ' Monthly Technical Analysis of Nepse (31 January to 25 February 2016)', 'image' => null, 'short_content' => 'The benchmark index scaled up further in the course of last month. Nepse index gained a staggering 67.41 points (or up 5.43%) to close at 1283.52. The index is moving well above the 50-day moving average (MA) and 200-day MA, indicating that the overall market outlook looks good.', 'status' => true, 'publish_date' => '0000-00-00' ) ), (int) 38 => array( 'MagazineArticle' => array( 'id' => '1432', 'magazine_issue_id' => '958', 'magazine_category_id' => '63', 'title' => ' Monthly Technical Analysis of Nepse (27 December, 2015 to 28 January 2016)', 'image' => null, 'short_content' => 'The benchmark index increased further in the course of last month. The Nepse index gained a staggering 79.08 points (or up 6.77%) to close at 1216.11. Few reasons have caused the market to be bullish last month. Firstly, the bullish momentum was triggered by an increase in the demand in the insurance sector.', 'status' => true, 'publish_date' => '0000-00-00' ) ), (int) 39 => array( 'MagazineArticle' => array( 'id' => '1380', 'magazine_issue_id' => '956', 'magazine_category_id' => '63', 'title' => 'Monthly Technical Analysis of Nepse (1 November to 26 November, 2015)', 'image' => null, 'short_content' => 'or the first half of the month, the benchmark index moved sideways, hovering above its immediate support level of 1084. The index then reached a high level of 1109. However, for the second half of the month the index spiraled downwards, losing 48.03 points (or down 4.43%).', 'status' => true, 'publish_date' => '0000-00-00' ) ), (int) 40 => array( 'MagazineArticle' => array( 'id' => '1363', 'magazine_issue_id' => '955', 'magazine_category_id' => '63', 'title' => 'Why S&P 500 is expected to make an important low on 26th November, 2015 at 13:43 NEWYORK TIME ?', 'image' => '20151125121943_st.jpg', 'short_content' => 'You will see every time when the planet Venus travels the sign of Libra at 19.48 degree, the S&P makes an important low there. Not once or twice or thrice, but in year 2010, 2011, 2012, 2013 and 2014 – five years in a row - it was right on the spot and the next date is 26th November,2015.', 'status' => true, 'publish_date' => '0000-00-00' ) ), (int) 41 => array( 'MagazineArticle' => array( 'id' => '1324', 'magazine_issue_id' => '954', 'magazine_category_id' => '63', 'title' => 'Forecasting Gold Prices with Astrology’s Help ', 'image' => null, 'short_content' => 'Gold is ruled by the planet Sun and the sign Leo. When a benefic planet transits Leo and at the same time casts good aspects to the Sun or when it casts a good aspect to Leo from other signs the value of gold rises. ', 'status' => true, 'publish_date' => '0000-00-00' ) ), (int) 42 => array( 'MagazineArticle' => array( 'id' => '1338', 'magazine_issue_id' => '954', 'magazine_category_id' => '63', 'title' => 'Market Gone Flat after Breaching Record (Review for 25 August to 24 September, 2015)', 'image' => null, 'short_content' => 'The secondary market touched the historic high during the review period ahead of the promulgation of the long awaited new constitution. But after the constitution was promulgated, it shed some of the gains and remains flat then after. ', 'status' => true, 'publish_date' => '0000-00-00' ) ), (int) 43 => array( 'MagazineArticle' => array( 'id' => '1346', 'magazine_issue_id' => '954', 'magazine_category_id' => '63', 'title' => 'Monthly Technical Analysis of Nepse (23 August to 24 September, 2015)', 'image' => null, 'short_content' => 'Nepse index followed a sideways movement for most of last month. The benchmark index tested the 1200 mark three times in the course of previous month. On 15th September, Nepse reached its all time high of 1205.84 level. The current trend shows Nepse to be falling faintly, creating lower low in the support zone. ', 'status' => true, 'publish_date' => '0000-00-00' ) ), (int) 44 => array( 'MagazineArticle' => array( 'id' => '1294', 'magazine_issue_id' => '953', 'magazine_category_id' => '63', 'title' => 'The Most Awaited Trade of 2015', 'image' => null, 'short_content' => 'This trade is probably the most awaited trade of 2015. The entire world is anxious to know when the US stock indices are going to stop their unstoppable bull rally which started in 2009.', 'status' => true, 'publish_date' => '0000-00-00' ) ), (int) 45 => array( 'MagazineArticle' => array( 'id' => '1312', 'magazine_issue_id' => '953', 'magazine_category_id' => '63', 'title' => 'Rise and Rise of Nepse (Review for 23 July to 20 August, 2015)', 'image' => null, 'short_content' => 'Nepal’s Capital Market set the history’s new high during the review period as positive sentiments towards banking stocks led all the sectors. The benchmark Nepse index touched 1200.92 adding 197.54 points in the review period while the session’s low was at the opening (23 July) with 1003.38.', 'status' => true, 'publish_date' => '0000-00-00' ) ), (int) 46 => array( 'MagazineArticle' => array( 'id' => '1313', 'magazine_issue_id' => '953', 'magazine_category_id' => '63', 'title' => 'Monthly Technical Analysis of Nepse (26 July to 20 August, 2015) ', 'image' => null, 'short_content' => 'Nepse witnessed remarkable gains in the course of last month. The benchmark index rose by 197.54 points (or up 18.31%). It surpassed its previous resistance levels of 1036.98 and 1100 points and is moving well above the 50-day and 200-day moving average, and at a much higher rate, indicating a bullish outlook.', 'status' => true, 'publish_date' => '0000-00-00' ) ), (int) 47 => array( 'MagazineArticle' => array( 'id' => '1265', 'magazine_issue_id' => '952', 'magazine_category_id' => '63', 'title' => 'Stay Alert from September 14 to October 14', 'image' => null, 'short_content' => 'In our article, “Millionaires don’t use astrology but billionaires do” written on March 31 2015 and published in the May, 2015 issue of New Business Age we forecasted that: ', 'status' => true, 'publish_date' => '0000-00-00' ) ), (int) 48 => array( 'MagazineArticle' => array( 'id' => '1244', 'magazine_issue_id' => '928', 'magazine_category_id' => '63', 'title' => 'Moving Sideways', 'image' => null, 'short_content' => 'As the earthquake has destroyed property and hampered trade, consumption, investment and living patterns of the people, business activities have been hampered. However, the exact loss can be assesses only after the coming quarterly reports of the listed companies.', 'status' => true, 'publish_date' => '0000-00-00' ) ), (int) 49 => array( 'MagazineArticle' => array( 'id' => '1245', 'magazine_issue_id' => '928', 'magazine_category_id' => '63', 'title' => 'Are We Ready for the Next Stock Market Crash?', 'image' => null, 'short_content' => 'In US stock market history, so far we have seen three big crashes. The first crash was on 28th October 1929, followed by the second on 19th October 1987 and the last crash was on 6th October 2008.', 'status' => true, 'publish_date' => '0000-00-00' ) ), (int) 50 => array( 'MagazineArticle' => array( 'id' => '1246', 'magazine_issue_id' => '928', 'magazine_category_id' => '63', 'title' => 'Smarten Your Approach to the Secondary Market', 'image' => null, 'short_content' => 'Before investing in the secondary market, take a breather and evaluate yourself. What is your type? Are you an investor or a trader?', 'status' => true, 'publish_date' => '0000-00-00' ) ), (int) 51 => array( 'MagazineArticle' => array( 'id' => '1247', 'magazine_issue_id' => '928', 'magazine_category_id' => '63', 'title' => 'Monthly Technical Analysis of Nepse (May 24 to June 23, 2015)', 'image' => null, 'short_content' => 'The aftermath of the earthquake caused Nepse index to fall by 10.70%. Nevertheless, the index increased soon enough, rising by 15.43% halfway through last month. Currently, Nepse is at a correction period.', 'status' => true, 'publish_date' => '0000-00-00' ) ), (int) 52 => array( 'MagazineArticle' => array( 'id' => '1193', 'magazine_issue_id' => '889', 'magazine_category_id' => '63', 'title' => '11.47 Points Fall Ahead of Q3 Results', 'image' => null, 'short_content' => 'Most of the stocks turned red during the review period (Feb 18 - March 19) pushing the index to nearly two months low. The Nepse index closed in red losing 15.03 points or 1.53% to settle at 967.62. The index touched highest level on 9 March with 988.77 and the lowest was 959.14 on 16 March. ', 'status' => true, 'publish_date' => '0000-00-00' ) ), (int) 53 => array( 'MagazineArticle' => array( 'id' => '1194', 'magazine_issue_id' => '889', 'magazine_category_id' => '63', 'title' => 'Monthly Technical Analysis of Nepse (March 19 to April 23, 2015) : At Lowest Volatility of the Year', 'image' => null, 'short_content' => 'RSI is a form of leading indicator that is believed to be most effective during periods of sideways movement. Such indicators may create numerous buy and sell signals that are useful when the market is not clearly trending upwards or downwards. ', 'status' => true, 'publish_date' => '0000-00-00' ) ), (int) 54 => array( 'MagazineArticle' => array( 'id' => '1166', 'magazine_issue_id' => '863', 'magazine_category_id' => '63', 'title' => 'Market @ Two Months’ Low', 'image' => null, 'short_content' => 'Most of the stocks turned red during the review period (Feb 18 - March 19) pushing the index to nearly two months low. The Nepse index closed in red losing 15.03 points or 1.53% to settle at 967.62. The index touched highest level on 9 March with 988.77 and the lowest was 959.14 on 16 March. ', 'status' => true, 'publish_date' => '0000-00-00' ) ), (int) 55 => array( 'MagazineArticle' => array( 'id' => '1167', 'magazine_issue_id' => '863', 'magazine_category_id' => '63', 'title' => 'Technical Analysis Monthly (February 19 to March 19, 2015) Bearish Signals', 'image' => null, 'short_content' => ' Nepse has not made much improvement in the past 30 days as compared to the growth witnessed in the previous months. Nepse decreased by -19.43 points (or -1.95%) to close at 967.62 points. It fell below its support level of 972.17, which is now its new resistance level. ', 'status' => true, 'publish_date' => '0000-00-00' ) ), (int) 56 => array( 'MagazineArticle' => array( 'id' => '1139', 'magazine_issue_id' => '839', 'magazine_category_id' => '63', 'title' => 'Nepse Slows Down', 'image' => null, 'short_content' => 'The secondary market of Nepal stalled after reaching nearly six months high while political uncertainties compelled the investors to wait-and-watch. The benchmark Nepse index added 7.20 points or 0.74 per cent to rest at 982.62. ', 'status' => true, 'publish_date' => '0000-00-00' ) ), (int) 57 => array( 'MagazineArticle' => array( 'id' => '1140', 'magazine_issue_id' => '839', 'magazine_category_id' => '63', 'title' => 'Technical Analysis Monthly (Jan 20, 14 – Feb 19, 15) : Bullish Signal for Long Term', 'image' => null, 'short_content' => 'After the huge gains witnessed in the previous periods, Nepse remained almost flat during the past 30 days. However, there was an overall positive gain in the market as Nepse increased by 7.2 points (or 0.74%) to close at 982.65 points.', 'status' => true, 'publish_date' => '0000-00-00' ) ), (int) 58 => array( 'MagazineArticle' => array( 'id' => '1108', 'magazine_issue_id' => '811', 'magazine_category_id' => '63', 'title' => 'Waiting for Confirmation Signal', 'image' => null, 'short_content' => 'Nepal’s secondary market turned little green with hopes that agreement between major political parties on contentious issues of new constitution was underway. The Nepse index accelerated 66.19 points or 7.38 per cent to close at 962.80. ', 'status' => true, 'publish_date' => '0000-00-00' ) ), (int) 59 => array( 'MagazineArticle' => array( 'id' => '1109', 'magazine_issue_id' => '811', 'magazine_category_id' => '63', 'title' => 'Technical Analysis Monthly (Dec 21, 2014 to Jan 20, 2015)', 'image' => null, 'short_content' => 'Giving continuity to the previous period’s positive momentum, Nepse has been able to make remarkable gains during this period. The stock market moved past its strong resistance level of 938.41 to close at 962.8 points – an increase of 58.91 points or 6.52 per cent.', 'status' => true, 'publish_date' => '0000-00-00' ) ), (int) 60 => array( 'MagazineArticle' => array( 'id' => '1064', 'magazine_issue_id' => '783', 'magazine_category_id' => '63', 'title' => 'Politics Still a Factor', 'image' => null, 'short_content' => 'Most of the listed companies have declared their dividends and few others are about to make these announcements. This means that the price adjustment of the stock after dividend declaration has also played role in driving the prices lower for such few companies. ', 'status' => true, 'publish_date' => '0000-00-00' ) ), (int) 61 => array( 'MagazineArticle' => array( 'id' => '1065', 'magazine_issue_id' => '783', 'magazine_category_id' => '63', 'title' => 'Technical Analysis Monthly (Nov 21 – Dec 20) : Fighting 916 Resistance', 'image' => null, 'short_content' => 'There was significant sideways movement in Nepse in the period between Nov 21, 2014 and Dec 20, 2014. The immediate support level of 844.42 was tested three times while the imme-diate resistance level of 875.56 was tested once in the review period.', 'status' => true, 'publish_date' => '0000-00-00' ) ), (int) 62 => array( 'MagazineArticle' => array( 'id' => '1036', 'magazine_issue_id' => '756', 'magazine_category_id' => '63', 'title' => 'Market Dips to 6 Months Low', 'image' => null, 'short_content' => 'The stock market of Nepal plunged to 6 months low in the review period as gloomy political winter cooled investors’ sentiment. The Nepse index lost 61.84 points or 6.69% to rest at 862.5 while the session’s high was on 27 Oct with 935.01 and lowest was on 18 Nov with 844.06. ', 'status' => true, 'publish_date' => '0000-00-00' ) ), (int) 63 => array( 'MagazineArticle' => array( 'id' => '1037', 'magazine_issue_id' => '756', 'magazine_category_id' => '63', 'title' => 'Technical Analysis Monthly (Oct 20 – Nov 20)', 'image' => null, 'short_content' => 'Since Nepse peaked at 1083.55 points on July 21, 2014, the stock market has been following a bearish pattern. Though the markets stabilized and saw a 2.88% rebound during the last trading period, overall Nepse has continued its downward trend', 'status' => true, 'publish_date' => '0000-00-00' ) ), (int) 64 => array( 'MagazineArticle' => array( 'id' => '1038', 'magazine_issue_id' => '756', 'magazine_category_id' => '63', 'title' => 'Ups and Downs in Nepali Stock Market', 'image' => null, 'short_content' => 'Ups and downs in the indicators of the stock market are a regular phenomenon. The market goes up when more investors exercise for buying stocks and slips down when more investors are in the mood to sell their shares. If they quickly want to exit from the market,', 'status' => true, 'publish_date' => '0000-00-00' ) ), (int) 65 => array( 'MagazineArticle' => array( 'id' => '992', 'magazine_issue_id' => '730', 'magazine_category_id' => '63', 'title' => 'Market Stalled after Losing Steam', 'image' => null, 'short_content' => 'The Nepali stock market remained stable during the review period despite the recent sharp fall. The benchmark Nepse index added 3.71 points or 0.40% to reach 923.59 while the session’s high was on 30 September with 937.99 and lowest was on 22 September with 881.87. ', 'status' => true, 'publish_date' => '0000-00-00' ) ), (int) 66 => array( 'MagazineArticle' => array( 'id' => '993', 'magazine_issue_id' => '730', 'magazine_category_id' => '63', 'title' => 'Monthly Technical Analysis of Nepse November 2014', 'image' => null, 'short_content' => 'After two continuous trading periods of huge declines, Nepse has stabilized in recent times. Compared to the previous period, Nepse made an upward gain of 25.96 points (or 2.88%) closing at 925.85 points. ', 'status' => true, 'publish_date' => '0000-00-00' ) ), (int) 67 => array( 'MagazineArticle' => array( 'id' => '994', 'magazine_issue_id' => '730', 'magazine_category_id' => '63', 'title' => 'Privatization, Corporatization and Strategic Partner for NEPSE', 'image' => null, 'short_content' => 'Historically stock exchanges started as a mutually governed, non-profit making, self-regulated cooperative like structures. Mostly brokers were the owners of such exchanges. However, due to the change in the technology and the concept of securities commission as apex regulator', 'status' => true, 'publish_date' => '0000-00-00' ) ), (int) 68 => array( 'MagazineArticle' => array( 'id' => '920', 'magazine_issue_id' => '678', 'magazine_category_id' => '63', 'title' => 'The Big Retreat', 'image' => null, 'short_content' => 'The Nepali bourse cooled down after reaching a high of 1083.55 as selling pressure ruled the market. The benchmark Nepse index plummeted 61.35 points or 5.71% to close at 1013.6 while session’s high was on 21st July with 1083.55 and lowest on 18th August with 1013.25. ', 'status' => true, 'publish_date' => '0000-00-00' ) ), (int) 69 => array( 'MagazineArticle' => array( 'id' => '921', 'magazine_issue_id' => '678', 'magazine_category_id' => '63', 'title' => 'Monthly Technical Analysis of Nepse (July 21 - August 14, 2014)', 'image' => null, 'short_content' => 'On the first trading day of the review period the secondary market had witnessed the highest rise as the benchmark index settled at 1083.55 points, a new high since the last 6 years. On the same day Nepse had attained the highest turnover of NPR 1.20 billion on a single trading day in its history.', 'status' => true, 'publish_date' => '0000-00-00' ) ), (int) 70 => array( 'MagazineArticle' => array( 'id' => '952', 'magazine_issue_id' => '704', 'magazine_category_id' => '63', 'title' => 'The End of Bull Run', 'image' => null, 'short_content' => 'The stock market of Nepal which was predicted to break the previous historic high level of 1175.38 points pulled back from 1083.55 and witnessed a nose dive sessions. ', 'status' => true, 'publish_date' => '0000-00-00' ) ), (int) 71 => array( 'MagazineArticle' => array( 'id' => '953', 'magazine_issue_id' => '704', 'magazine_category_id' => '63', 'title' => 'Monthly Technical Analysis of Nepse October 2014', 'image' => null, 'short_content' => 'Nepal Stock Exchange (Nepse) index continued spiralling downwards during the August 19 to September 18, 2014 period, just like the preceding period. During the review period, Nepse fell by 134.5 points (-13 per cent) to close at 899.89 points.', 'status' => true, 'publish_date' => '0000-00-00' ) ), (int) 72 => array( 'MagazineArticle' => array( 'id' => '954', 'magazine_issue_id' => '704', 'magazine_category_id' => '63', 'title' => 'NRN Investment through Capital Market', 'image' => null, 'short_content' => '‘Economic Roadmap for Prosperous Nepal’ was the main theme of 8th NRN regional conference held on Nagano, Japan from September 18 to 19. About three hundred NRNs had participated from different part of the globe to discuss on the given theme. ', 'status' => true, 'publish_date' => '0000-00-00' ) ), (int) 73 => array( 'MagazineArticle' => array( 'id' => '1405', 'magazine_issue_id' => '957', 'magazine_category_id' => '63', 'title' => 'Monthly Technical Analysis of Nepse (29 November to 24 December, 2015)', 'image' => null, 'short_content' => 'The benchmark index saw huge changes in the course of last month. Despite all the difficulties and political unrest in the country, Nepse gained a staggering 114.26 points (or up 11.17%) to close at 1137.03. It seems that the monetary policy is still playing a major role in causing the market to be bullish.', 'status' => true, 'publish_date' => '0000-00-00' ) ) ) $magazineCategory = array( 'MagazineCategory' => array( 'id' => '63', 'title' => 'Stock Taking', 'sortorder' => '516', 'status' => true, 'created' => '0000-00-00 00:00:00', 'homepage' => true, 'modified' => '2013-04-01 00:00:00' ) ) $magazineArticle = array( 'MagazineArticle' => array( 'id' => '1405', 'magazine_issue_id' => '957', 'magazine_category_id' => '63', 'title' => 'Monthly Technical Analysis of Nepse (29 November to 24 December, 2015)', 'image' => null, 'short_content' => 'The benchmark index saw huge changes in the course of last month. Despite all the difficulties and political unrest in the country, Nepse gained a staggering 114.26 points (or up 11.17%) to close at 1137.03. It seems that the monetary policy is still playing a major role in causing the market to be bullish.', 'status' => true, 'publish_date' => '0000-00-00' ) ) $issue_title = array() $width = (int) 400 $height = (int) 230 $ratio = (float) 1.7391304347826 $img_width = (int) 160 $img_height = (float) 92include - APP/View/MagazineArticles/category.ctp, line 86 View::_evaluate() - CORE/Cake/View/View.php, line 971 View::_render() - CORE/Cake/View/View.php, line 933 View::render() - CORE/Cake/View/View.php, line 473 Controller::render() - CORE/Cake/Controller/Controller.php, line 968 Dispatcher::_invoke() - CORE/Cake/Routing/Dispatcher.php, line 200 Dispatcher::dispatch() - CORE/Cake/Routing/Dispatcher.php, line 167 [main] - APP/webroot/index.php, line 117
Notice (8): Trying to access array offset on value of type null [APP/View/MagazineArticles/category.ctp, line 86]Code Context<div class="category"><span class="label label-danger"><?php echo $this->Html->link($issue_title['MagazineIssue']['title'],$viewFile = '/var/www/html/newbusinessage.com/app/View/MagazineArticles/category.ctp' $dataForView = array( 'current_user' => null, 'logged_in' => false ) $current_user = null $logged_in = false $cat_id = '63' $magazineArticles = array( (int) 0 => array( 'MagazineArticle' => array( 'id' => '2742', 'magazine_issue_id' => '1006', 'magazine_category_id' => '63', 'title' => 'Monthly Technical Analysis (November 24th -December 19th 2019)', 'image' => '20201010020410_Clipboard30.jpg', 'short_content' => 'NEPSE index gained 39.57 points (or up 3.56 %) to close at 1149.65 last month. Last month 50 days moving average of NEPSE was crossed from below which showed short term bull. However, NEPSE is trading below 200 days moving average which shows that overall long term sentiment is still bearish.', 'status' => true, 'publish_date' => null ) ), (int) 1 => array( 'MagazineArticle' => array( 'id' => '2508', 'magazine_issue_id' => '998', 'magazine_category_id' => '63', 'title' => 'Monthly Technical Analysis of Nepse March 24th 2019 – April 22th 2019', 'image' => '20190511100832_Clipboard24.jpg', 'short_content' => 'NEPSE gained 116.34 points (or up 10.20%) to close at 1250.94 last month that ended on April 22. Last month, NEPSE showed a bullish momentum breaking the resistance level of 200 days moving average. Currently, NEPSE is trading above the 50 days moving average and 200 days moving average. The average daily volume turnover has increased to NPR 53.01 crores from NPR 30.26 crores', 'status' => true, 'publish_date' => null ) ), (int) 2 => array( 'MagazineArticle' => array( 'id' => '2464', 'magazine_issue_id' => '997', 'magazine_category_id' => '63', 'title' => 'Monthly Technical Analysis of Nepse (February 27th 2019 – March 21th 2019)', 'image' => '20190403054014_1111.jpg', 'short_content' => 'NEPSE gained 38.04 points (or up 3.45%) to close at 1140.6 last month. At the beginning of month, NEPSE showed a bullish momentum breaking the resistance level of 50 days moving average.', 'status' => true, 'publish_date' => null ) ), (int) 3 => array( 'MagazineArticle' => array( 'id' => '2429', 'magazine_issue_id' => '996', 'magazine_category_id' => '63', 'title' => 'Monthly Technical Analysis of Nepse (January 26rd 2019 – February 16th 2019)', 'image' => '20190307122140_Clipboard04.jpg', 'short_content' => 'NEPSE index lost 85.21 points (or down 7.17%) to close at 1102.56 last month. Currently, NEPSE is trading below the 200 days moving average. At the beginning of the month, NEPSE breached the support level of 50 days moving average and traded below the 50 days moving average. ', 'status' => true, 'publish_date' => null ) ), (int) 4 => array( 'MagazineArticle' => array( 'id' => '2403', 'magazine_issue_id' => '995', 'magazine_category_id' => '63', 'title' => 'Monthly Technical Analysis of Nepse (December 23rd 2018 – January 17th 2019)', 'image' => '20190215124248_Clipboard07.jpg', 'short_content' => 'NEPSE index gained 21.8 (or up 1.87%) to close at 1187.77 last month. At the beginning of last month, NEPSE index showed bullish momentum by breaching the resistance of 50 days moving average. However, NEPSE index could not breach the 200 days moving average and retraced back forming a shooting star candle. Currently, NEPSE is trading above 50 days moving average and below 200 days moving says average.', 'status' => true, 'publish_date' => null ) ), (int) 5 => array( 'MagazineArticle' => array( 'id' => '2359', 'magazine_issue_id' => '993', 'magazine_category_id' => '63', 'title' => 'Monthly Technical Analysis of Nepse (November 25, 2018 – December 20, 2018)', 'image' => '20190110065454_Clipboard10.jpg', 'short_content' => 'NEPSE index lost 15.27 (or down 1.293%) to close at 1165.97 last month. Currently, the index is trading below the 50 days moving average and 200 days moving average. During the course of last month, NEPSE index breached the support level of 1150, reached the low level of 1120.84 forming a spinning bottom and bounced back to close at 1165.97.', 'status' => true, 'publish_date' => '2019-01-10' ) ), (int) 6 => array( 'MagazineArticle' => array( 'id' => '2325', 'magazine_issue_id' => '992', 'magazine_category_id' => '63', 'title' => 'Monthly Technical Analysis of Nepse (October 26, 2018 – November 22, 2018)', 'image' => null, 'short_content' => 'NEPSE index lost 59.70 (or down 4.81%) to close at 1181.41 last month. Currently, the index is trading below the 50 days moving average and 200 days moving average. NEPSE breached the support level of 50 days moving average.', 'status' => true, 'publish_date' => '0000-00-00' ) ), (int) 7 => array( 'MagazineArticle' => array( 'id' => '2294', 'magazine_issue_id' => '991', 'magazine_category_id' => '63', 'title' => 'Monthly Technical Analysis of Nepse (September 26th 2018 – October 25th 2018)', 'image' => null, 'short_content' => 'NEPSE index lost 36.63 (or down 2.867%) to close at 1241.11 last month. Currently, the index is trading above the 50 days moving average. However, the index is still moving below 200 days moving average.', 'status' => true, 'publish_date' => '0000-00-00' ) ), (int) 8 => array( 'MagazineArticle' => array( 'id' => '2264', 'magazine_issue_id' => '990', 'magazine_category_id' => '63', 'title' => 'Monthly Technical Analysis of Nepse (August 26th 2018 – September 26th 2018)', 'image' => null, 'short_content' => 'NEPSE index experienced high volatility in the course of last month. It gained 102.02 (or up 8.68%) to close at 1277.74 last month. Currently, the index is trading above 50 days moving average. However, the index is still moving below 200-day moving average. ', 'status' => true, 'publish_date' => '0000-00-00' ) ), (int) 9 => array( 'MagazineArticle' => array( 'id' => '2232', 'magazine_issue_id' => '989', 'magazine_category_id' => '63', 'title' => 'Monthly Technical Analysis of Nepse (July 22nd 2018 - August 23rd 2018)', 'image' => null, 'short_content' => 'Nepse index lost 3.16 points (or down0.27%) to close at 1178.5 last month. The index continues to trade below50-day moving average and 200-day moving average indicating bearish momentum in the market. The average volume turnover decreased to Rs 22.51crores from Rs 29.66 crores the month prior.', 'status' => true, 'publish_date' => '0000-00-00' ) ), (int) 10 => array( 'MagazineArticle' => array( 'id' => '2220', 'magazine_issue_id' => '988', 'magazine_category_id' => '63', 'title' => 'Monthly Technical Analysis of Nepse (June 24th 2018 - July 22th 2018)', 'image' => null, 'short_content' => 'The benchmark index declined in the course of last month. Nepse decreased by 36.80 points (or down 3.02%) to close at 1181.66. The index continues to trade below 50-day moving average and 200-day moving average indicating bearish momentum in the market.', 'status' => true, 'publish_date' => '0000-00-00' ) ), (int) 11 => array( 'MagazineArticle' => array( 'id' => '2171', 'magazine_issue_id' => '987', 'magazine_category_id' => '63', 'title' => 'Monthly Technical Analysis of Nepse (May25th 2018 - June 21th 2018)', 'image' => null, 'short_content' => 'The benchmark index declined in the course of last month. Nepse decreased by 99.76 points (or down 7.57%) to close at 1218.46. The index breached 50-day moving average and still trading below 200-day moving average indicating bearish momentum in the market. ', 'status' => true, 'publish_date' => '0000-00-00' ) ), (int) 12 => array( 'MagazineArticle' => array( 'id' => '2147', 'magazine_issue_id' => '986', 'magazine_category_id' => '63', 'title' => 'Monthly Technical Analysis of Nepse (April 25th 2018 - May 24th 2018)', 'image' => null, 'short_content' => 'The benchmark index declined in the course of last month. Nepse decreased by 76.64 points (or down 4.90%) to close at 1318.22.The index moved towards 50-day moving average and still remains below the 200-day moving average. ', 'status' => true, 'publish_date' => '0000-00-00' ) ), (int) 13 => array( 'MagazineArticle' => array( 'id' => '2110', 'magazine_issue_id' => '985', 'magazine_category_id' => '63', 'title' => 'Monthly Technical Analysis of Nepse (March 22nd 2018 – April 24th 2018)', 'image' => null, 'short_content' => 'The benchmark index surged up in the course of last month. Nepse increased by a staggering 163.79 points (or up 12.97%) to close at 1394.86. The index crossed above the 50-day moving average, giving a bullish signal. However, the index still remains below the 200-day MA. New investors entering the market, as well as optimism regarding the implementation of online trading platform, has created this bullish trigger. ', 'status' => true, 'publish_date' => '0000-00-00' ) ), (int) 14 => array( 'MagazineArticle' => array( 'id' => '2089', 'magazine_issue_id' => '984', 'magazine_category_id' => '63', 'title' => 'Monthly Technical Analysis of Nepse (25 February to 21 March 2018)', 'image' => null, 'short_content' => 'The benchmark index continued its downfall in the course of last month. Nepse declined by a staggering 115.97 points (or down 11.78%) to close at 1231.01. The index moving below the 50-day and the 200-day moving average indicates bearish momentum in the market. ', 'status' => true, 'publish_date' => '0000-00-00' ) ), (int) 15 => array( 'MagazineArticle' => array( 'id' => '2062', 'magazine_issue_id' => '983', 'magazine_category_id' => '63', 'title' => 'Monthly Technical Analysis of Nepse (23 January to 22 February 2018)', 'image' => null, 'short_content' => 'The benchmark index continued its downfall in the course of last month. Nepse declined by 15.11 points (or down 1.02%) to close at 1386.98. The index moving below the 50-day and the 200-day moving average indicates bearish momentum in the market.', 'status' => true, 'publish_date' => '0000-00-00' ) ), (int) 16 => array( 'MagazineArticle' => array( 'id' => '2035', 'magazine_issue_id' => '982', 'magazine_category_id' => '63', 'title' => 'Monthly Technical Analysis of Nepse (24 December 2017 to 22 January 2018)', 'image' => null, 'short_content' => 'The benchmark index fell by 70.06 points (or down 4.75%) to close at 1402.09 last month. The index continued to move below the 50-day and the 200-day moving average, indicating a bearish momentum in the market. The market will likely remain bearish as the banks continue to face liquidity crunch.', 'status' => true, 'publish_date' => '0000-00-00' ) ), (int) 17 => array( 'MagazineArticle' => array( 'id' => '2011', 'magazine_issue_id' => '981', 'magazine_category_id' => '63', 'title' => 'Monthly Technical Analysis of Nepse (26 November to 21 December 2017)', 'image' => null, 'short_content' => 'The benchmark index fell by 21.14 points (or down 1.38%) to close at 1472.15 last month. The index has moved below the 50-day, as well as 200-day moving average, giving a bearish signal. Completion of the election at the beginning of the month did little to create bullish sentiment in the market.', 'status' => true, 'publish_date' => '0000-00-00' ) ), (int) 18 => array( 'MagazineArticle' => array( 'id' => '1982', 'magazine_issue_id' => '980', 'magazine_category_id' => '63', 'title' => 'Monthly Technical Analysis of Nepse (22 October to 23 November 2017)', 'image' => null, 'short_content' => 'The benchmark index fell by 75.06 points (or down 4.83%) to close at 1493.29 last month. The index is hovering below the 50-day, as well as the 200-day moving average. This shows the market to be in a bearish mode in the course of last month.', 'status' => true, 'publish_date' => '0000-00-00' ) ), (int) 19 => array( 'MagazineArticle' => array( 'id' => '1950', 'magazine_issue_id' => '979', 'magazine_category_id' => '63', 'title' => 'Monthly Technical Analysis of Nepse (20 September to 18 October 2017)', 'image' => null, 'short_content' => 'The benchmark index gained a modest 24.65 points (or up 1.67%) to close at 1568.35 last month. The index continues to move close to the 200-day moving average, which acts as a support level to the index. Favorable political outlook has triggered a bullish sentiment in the market. ', 'status' => true, 'publish_date' => '0000-00-00' ) ), (int) 20 => array( 'MagazineArticle' => array( 'id' => '1933', 'magazine_issue_id' => '978', 'magazine_category_id' => '63', 'title' => 'Monthly Technical Analysis of Nepse (22 August to 18 September 2017)', 'image' => null, 'short_content' => 'The benchmark index lost 67.87 points (or down 4.20%) to close at 1543.7 last month. The index fell below the 50-day, as well as 200-day moving average, which shows bearish sentiment in the market.', 'status' => true, 'publish_date' => '0000-00-00' ) ), (int) 21 => array( 'MagazineArticle' => array( 'id' => '1897', 'magazine_issue_id' => '977', 'magazine_category_id' => '63', 'title' => 'Monthly Technical Analysis of Nepse (25 July to 21 August 2017)', 'image' => null, 'short_content' => 'The benchmark index lost 17.51 points (or down 1.06%) to close at 1611.57 last month. The index remains above the 50-day, as well as 200 day moving average, signaling the market to be bullish. However, Nepse hovering close to the 50-day MA will test the respective MA for support level.', 'status' => true, 'publish_date' => '0000-00-00' ) ), (int) 22 => array( 'MagazineArticle' => array( 'id' => '1866', 'magazine_issue_id' => '976', 'magazine_category_id' => '63', 'title' => ' Monthly Technical Analysis of Nepse (25 June to 24 July 2017)', 'image' => null, 'short_content' => 'The benchmark index gained 69.59 points (or up 4.44%) to close at 1629.08 last month. Events such as release of monetary policy and talks regarding online trading system were witnessed in the course of last month. ', 'status' => true, 'publish_date' => '0000-00-00' ) ), (int) 23 => array( 'MagazineArticle' => array( 'id' => '1848', 'magazine_issue_id' => '975', 'magazine_category_id' => '63', 'title' => 'Monthly Technical Analysis of Nepse (28 May to 22 June 2017)', 'image' => null, 'short_content' => 'The benchmark index continued to fall in the course of last month. It declined by 70.09 points (or down -4.32%) last month to close at 1559.49. The index fell below the 50-day, as well as the 200-day moving average, giving a bearish signal.', 'status' => true, 'publish_date' => '0000-00-00' ) ), (int) 24 => array( 'MagazineArticle' => array( 'id' => '1801', 'magazine_issue_id' => '974', 'magazine_category_id' => '63', 'title' => 'Monthly Technical Analysis of Nepse (26 April to 24 May 2017)', 'image' => null, 'short_content' => 'The benchmark index declined from 1670.3 to 1629.58 in the course of last month. Its new support and resistance level stands at 1612 and 1780 level respectively. With no new bullish trigger, the index will likely test the new support level', 'status' => true, 'publish_date' => '0000-00-00' ) ), (int) 25 => array( 'MagazineArticle' => array( 'id' => '1780', 'magazine_issue_id' => '973', 'magazine_category_id' => '63', 'title' => 'Monthly Technical Analysis of Nepse (27 March to 25 April 2017)', 'image' => null, 'short_content' => 'The benchmark index continued its bullish run in the course of last month. Nepse gained 138.55 points (or up 9.08%) to close at 1672.38. Several factors supported the bullish momentum in the market. Positive political state of affairs, as well as Insurance Board’s directive to increase insurance capital,', 'status' => true, 'publish_date' => '0000-00-00' ) ), (int) 26 => array( 'MagazineArticle' => array( 'id' => '1753', 'magazine_issue_id' => '972', 'magazine_category_id' => '63', 'title' => 'Monthly Technical Analysis of Nepse (22 February to 26 March 2017)', 'image' => null, 'short_content' => 'The benchmark index experienced a remarkable climb in the course of last month. The index gained a staggering 176.26 points (or up 12.44%) to close at 1533.83. Gradual decrease in interest rates and positive hopes for political scenario seems to have caused a bullish trigger in the market. ', 'status' => true, 'publish_date' => '0000-00-00' ) ), (int) 27 => array( 'MagazineArticle' => array( 'id' => '1732', 'magazine_issue_id' => '971', 'magazine_category_id' => '63', 'title' => 'Monthly Technical Analysis of Nepse (20 January to 21 February 2017)', 'image' => null, 'short_content' => 'The benchmark index took a bearish ride at the beginning of last month, dropping as low as 1252.5 level. In the course of the month, Nepse lost a staggering 104.99 points (or down -6.93%) to close at 1357.57. Uncertain political environment and higher fixed deposit rate by the banks continues to create bearish sentiment in the market.', 'status' => true, 'publish_date' => '0000-00-00' ) ), (int) 28 => array( 'MagazineArticle' => array( 'id' => '1702', 'magazine_issue_id' => '970', 'magazine_category_id' => '63', 'title' => 'Nepse in Consolidation Stage', 'image' => null, 'short_content' => 'The benchmark indexcontinued to decline in the course of last month. The index lost 12.85 points (or down 0.87%) to close at 1462.56. Nepse continues to hover below the 200-day moving ..', 'status' => true, 'publish_date' => '0000-00-00' ) ), (int) 29 => array( 'MagazineArticle' => array( 'id' => '1650', 'magazine_issue_id' => '968', 'magazine_category_id' => '63', 'title' => 'Monthly Technical Analysis of Nepse (3 November to 30 November 2016)', 'image' => null, 'short_content' => 'The benchmark index experienced high volatility and bearish downturn in the course of last month. The index lost a staggering 151.38 points (or down 8.60%) to close at 1608.33. ', 'status' => true, 'publish_date' => '0000-00-00' ) ), (int) 30 => array( 'MagazineArticle' => array( 'id' => '1623', 'magazine_issue_id' => '967', 'magazine_category_id' => '63', 'title' => 'Monthly Technical Analysis of Nepse (23 September to 27 October 2016)', 'image' => null, 'short_content' => 'The benchmark index climbed up during the first half of last month. However, it took a U-turn during the second half of the month, indicating a bearish presence in the market. The index lost 7.2 points (or down 0.34%) last month to close at 1759.71. ', 'status' => true, 'publish_date' => '0000-00-00' ) ), (int) 31 => array( 'MagazineArticle' => array( 'id' => '1598', 'magazine_issue_id' => '966', 'magazine_category_id' => '63', 'title' => 'Monthly Technical Analysis of Nepse (28 August to 22 September 2016)', 'image' => null, 'short_content' => 'The benchmark index experienced a bullish run during the first half of last month. However, the second half of the month was triggered by a bearish momentum. Nepse gained 36.29 points (or up 2.12%) last month to close at 1766.91. ', 'status' => true, 'publish_date' => '0000-00-00' ) ), (int) 32 => array( 'MagazineArticle' => array( 'id' => '1567', 'magazine_issue_id' => '965', 'magazine_category_id' => '63', 'title' => 'Monthly Technical Analysis of Nepse (31 July to 25 August 2016)', 'image' => null, 'short_content' => 'The benchmark index went through high volatility last month. The index lost a staggering 147.31 points (or down -7.72%) to close at 1730.62. Nepse lost 202.02 points during the first half of the month. The index hit a negative, as well as positive circuit break during the middle of the month, as nervousness became apparent in the market. ', 'status' => true, 'publish_date' => '0000-00-00' ) ), (int) 33 => array( 'MagazineArticle' => array( 'id' => '1543', 'magazine_issue_id' => '964', 'magazine_category_id' => '63', 'title' => 'Monthly Technical Analysis of Nepse (28 June to 28 July 2016)', 'image' => null, 'short_content' => 'The benchmark index saw tremendous growth in the course of last month. The index gained 165.09 points (or up 7.86%) to close at 1877.93. Various policies and economic scenarios have supported the bullish sentiment in the market.', 'status' => true, 'publish_date' => '0000-00-00' ) ), (int) 34 => array( 'MagazineArticle' => array( 'id' => '1531', 'magazine_issue_id' => '963', 'magazine_category_id' => '63', 'title' => ' Monthly Technical Analysis of Nepse (26 May to 27 June 2016)', 'image' => null, 'short_content' => 'The benchmark index created history by breaking the 1600 and 1700 mark in the course of last month. The index gained a staggering 197.65 points (or up 12.34%) to close at 1721.77. The Insurance and Hydropower sectors have caused the market to climb further up', 'status' => true, 'publish_date' => '0000-00-00' ) ), (int) 35 => array( 'MagazineArticle' => array( 'id' => '1505', 'magazine_issue_id' => '962', 'magazine_category_id' => '63', 'title' => 'Monthly Technical Analysis of Nepse (2 May to 25 May 2016)', 'image' => null, 'short_content' => 'The benchmark index continues to create new heights as the bullish momentum is driving the market upward. The index gained 59.21 points (or up 4.01%) to close at 1524.12 in the course of last month. The market did correct itself during the course of the week. ', 'status' => true, 'publish_date' => '0000-00-00' ) ), (int) 36 => array( 'MagazineArticle' => array( 'id' => '1481', 'magazine_issue_id' => '961', 'magazine_category_id' => '63', 'title' => 'Monthly Technical Analysis of Nepse (28 March to 28 April 2016)', 'image' => null, 'short_content' => 'The benchmark index continued its upward climb last month as well. Nepse index gained 87.58 points (or up 6.21%) to close at an all time height of 1464.91. The index witnessed some corrections at the beginning of the month, as it declined by 25.79 points.', 'status' => true, 'publish_date' => '0000-00-00' ) ), (int) 37 => array( 'MagazineArticle' => array( 'id' => '1449', 'magazine_issue_id' => '959', 'magazine_category_id' => '63', 'title' => ' Monthly Technical Analysis of Nepse (31 January to 25 February 2016)', 'image' => null, 'short_content' => 'The benchmark index scaled up further in the course of last month. Nepse index gained a staggering 67.41 points (or up 5.43%) to close at 1283.52. The index is moving well above the 50-day moving average (MA) and 200-day MA, indicating that the overall market outlook looks good.', 'status' => true, 'publish_date' => '0000-00-00' ) ), (int) 38 => array( 'MagazineArticle' => array( 'id' => '1432', 'magazine_issue_id' => '958', 'magazine_category_id' => '63', 'title' => ' Monthly Technical Analysis of Nepse (27 December, 2015 to 28 January 2016)', 'image' => null, 'short_content' => 'The benchmark index increased further in the course of last month. The Nepse index gained a staggering 79.08 points (or up 6.77%) to close at 1216.11. Few reasons have caused the market to be bullish last month. Firstly, the bullish momentum was triggered by an increase in the demand in the insurance sector.', 'status' => true, 'publish_date' => '0000-00-00' ) ), (int) 39 => array( 'MagazineArticle' => array( 'id' => '1380', 'magazine_issue_id' => '956', 'magazine_category_id' => '63', 'title' => 'Monthly Technical Analysis of Nepse (1 November to 26 November, 2015)', 'image' => null, 'short_content' => 'or the first half of the month, the benchmark index moved sideways, hovering above its immediate support level of 1084. The index then reached a high level of 1109. However, for the second half of the month the index spiraled downwards, losing 48.03 points (or down 4.43%).', 'status' => true, 'publish_date' => '0000-00-00' ) ), (int) 40 => array( 'MagazineArticle' => array( 'id' => '1363', 'magazine_issue_id' => '955', 'magazine_category_id' => '63', 'title' => 'Why S&P 500 is expected to make an important low on 26th November, 2015 at 13:43 NEWYORK TIME ?', 'image' => '20151125121943_st.jpg', 'short_content' => 'You will see every time when the planet Venus travels the sign of Libra at 19.48 degree, the S&P makes an important low there. Not once or twice or thrice, but in year 2010, 2011, 2012, 2013 and 2014 – five years in a row - it was right on the spot and the next date is 26th November,2015.', 'status' => true, 'publish_date' => '0000-00-00' ) ), (int) 41 => array( 'MagazineArticle' => array( 'id' => '1324', 'magazine_issue_id' => '954', 'magazine_category_id' => '63', 'title' => 'Forecasting Gold Prices with Astrology’s Help ', 'image' => null, 'short_content' => 'Gold is ruled by the planet Sun and the sign Leo. When a benefic planet transits Leo and at the same time casts good aspects to the Sun or when it casts a good aspect to Leo from other signs the value of gold rises. ', 'status' => true, 'publish_date' => '0000-00-00' ) ), (int) 42 => array( 'MagazineArticle' => array( 'id' => '1338', 'magazine_issue_id' => '954', 'magazine_category_id' => '63', 'title' => 'Market Gone Flat after Breaching Record (Review for 25 August to 24 September, 2015)', 'image' => null, 'short_content' => 'The secondary market touched the historic high during the review period ahead of the promulgation of the long awaited new constitution. But after the constitution was promulgated, it shed some of the gains and remains flat then after. ', 'status' => true, 'publish_date' => '0000-00-00' ) ), (int) 43 => array( 'MagazineArticle' => array( 'id' => '1346', 'magazine_issue_id' => '954', 'magazine_category_id' => '63', 'title' => 'Monthly Technical Analysis of Nepse (23 August to 24 September, 2015)', 'image' => null, 'short_content' => 'Nepse index followed a sideways movement for most of last month. The benchmark index tested the 1200 mark three times in the course of previous month. On 15th September, Nepse reached its all time high of 1205.84 level. The current trend shows Nepse to be falling faintly, creating lower low in the support zone. ', 'status' => true, 'publish_date' => '0000-00-00' ) ), (int) 44 => array( 'MagazineArticle' => array( 'id' => '1294', 'magazine_issue_id' => '953', 'magazine_category_id' => '63', 'title' => 'The Most Awaited Trade of 2015', 'image' => null, 'short_content' => 'This trade is probably the most awaited trade of 2015. The entire world is anxious to know when the US stock indices are going to stop their unstoppable bull rally which started in 2009.', 'status' => true, 'publish_date' => '0000-00-00' ) ), (int) 45 => array( 'MagazineArticle' => array( 'id' => '1312', 'magazine_issue_id' => '953', 'magazine_category_id' => '63', 'title' => 'Rise and Rise of Nepse (Review for 23 July to 20 August, 2015)', 'image' => null, 'short_content' => 'Nepal’s Capital Market set the history’s new high during the review period as positive sentiments towards banking stocks led all the sectors. The benchmark Nepse index touched 1200.92 adding 197.54 points in the review period while the session’s low was at the opening (23 July) with 1003.38.', 'status' => true, 'publish_date' => '0000-00-00' ) ), (int) 46 => array( 'MagazineArticle' => array( 'id' => '1313', 'magazine_issue_id' => '953', 'magazine_category_id' => '63', 'title' => 'Monthly Technical Analysis of Nepse (26 July to 20 August, 2015) ', 'image' => null, 'short_content' => 'Nepse witnessed remarkable gains in the course of last month. The benchmark index rose by 197.54 points (or up 18.31%). It surpassed its previous resistance levels of 1036.98 and 1100 points and is moving well above the 50-day and 200-day moving average, and at a much higher rate, indicating a bullish outlook.', 'status' => true, 'publish_date' => '0000-00-00' ) ), (int) 47 => array( 'MagazineArticle' => array( 'id' => '1265', 'magazine_issue_id' => '952', 'magazine_category_id' => '63', 'title' => 'Stay Alert from September 14 to October 14', 'image' => null, 'short_content' => 'In our article, “Millionaires don’t use astrology but billionaires do” written on March 31 2015 and published in the May, 2015 issue of New Business Age we forecasted that: ', 'status' => true, 'publish_date' => '0000-00-00' ) ), (int) 48 => array( 'MagazineArticle' => array( 'id' => '1244', 'magazine_issue_id' => '928', 'magazine_category_id' => '63', 'title' => 'Moving Sideways', 'image' => null, 'short_content' => 'As the earthquake has destroyed property and hampered trade, consumption, investment and living patterns of the people, business activities have been hampered. However, the exact loss can be assesses only after the coming quarterly reports of the listed companies.', 'status' => true, 'publish_date' => '0000-00-00' ) ), (int) 49 => array( 'MagazineArticle' => array( 'id' => '1245', 'magazine_issue_id' => '928', 'magazine_category_id' => '63', 'title' => 'Are We Ready for the Next Stock Market Crash?', 'image' => null, 'short_content' => 'In US stock market history, so far we have seen three big crashes. The first crash was on 28th October 1929, followed by the second on 19th October 1987 and the last crash was on 6th October 2008.', 'status' => true, 'publish_date' => '0000-00-00' ) ), (int) 50 => array( 'MagazineArticle' => array( 'id' => '1246', 'magazine_issue_id' => '928', 'magazine_category_id' => '63', 'title' => 'Smarten Your Approach to the Secondary Market', 'image' => null, 'short_content' => 'Before investing in the secondary market, take a breather and evaluate yourself. What is your type? Are you an investor or a trader?', 'status' => true, 'publish_date' => '0000-00-00' ) ), (int) 51 => array( 'MagazineArticle' => array( 'id' => '1247', 'magazine_issue_id' => '928', 'magazine_category_id' => '63', 'title' => 'Monthly Technical Analysis of Nepse (May 24 to June 23, 2015)', 'image' => null, 'short_content' => 'The aftermath of the earthquake caused Nepse index to fall by 10.70%. Nevertheless, the index increased soon enough, rising by 15.43% halfway through last month. Currently, Nepse is at a correction period.', 'status' => true, 'publish_date' => '0000-00-00' ) ), (int) 52 => array( 'MagazineArticle' => array( 'id' => '1193', 'magazine_issue_id' => '889', 'magazine_category_id' => '63', 'title' => '11.47 Points Fall Ahead of Q3 Results', 'image' => null, 'short_content' => 'Most of the stocks turned red during the review period (Feb 18 - March 19) pushing the index to nearly two months low. The Nepse index closed in red losing 15.03 points or 1.53% to settle at 967.62. The index touched highest level on 9 March with 988.77 and the lowest was 959.14 on 16 March. ', 'status' => true, 'publish_date' => '0000-00-00' ) ), (int) 53 => array( 'MagazineArticle' => array( 'id' => '1194', 'magazine_issue_id' => '889', 'magazine_category_id' => '63', 'title' => 'Monthly Technical Analysis of Nepse (March 19 to April 23, 2015) : At Lowest Volatility of the Year', 'image' => null, 'short_content' => 'RSI is a form of leading indicator that is believed to be most effective during periods of sideways movement. Such indicators may create numerous buy and sell signals that are useful when the market is not clearly trending upwards or downwards. ', 'status' => true, 'publish_date' => '0000-00-00' ) ), (int) 54 => array( 'MagazineArticle' => array( 'id' => '1166', 'magazine_issue_id' => '863', 'magazine_category_id' => '63', 'title' => 'Market @ Two Months’ Low', 'image' => null, 'short_content' => 'Most of the stocks turned red during the review period (Feb 18 - March 19) pushing the index to nearly two months low. The Nepse index closed in red losing 15.03 points or 1.53% to settle at 967.62. The index touched highest level on 9 March with 988.77 and the lowest was 959.14 on 16 March. ', 'status' => true, 'publish_date' => '0000-00-00' ) ), (int) 55 => array( 'MagazineArticle' => array( 'id' => '1167', 'magazine_issue_id' => '863', 'magazine_category_id' => '63', 'title' => 'Technical Analysis Monthly (February 19 to March 19, 2015) Bearish Signals', 'image' => null, 'short_content' => ' Nepse has not made much improvement in the past 30 days as compared to the growth witnessed in the previous months. Nepse decreased by -19.43 points (or -1.95%) to close at 967.62 points. It fell below its support level of 972.17, which is now its new resistance level. ', 'status' => true, 'publish_date' => '0000-00-00' ) ), (int) 56 => array( 'MagazineArticle' => array( 'id' => '1139', 'magazine_issue_id' => '839', 'magazine_category_id' => '63', 'title' => 'Nepse Slows Down', 'image' => null, 'short_content' => 'The secondary market of Nepal stalled after reaching nearly six months high while political uncertainties compelled the investors to wait-and-watch. The benchmark Nepse index added 7.20 points or 0.74 per cent to rest at 982.62. ', 'status' => true, 'publish_date' => '0000-00-00' ) ), (int) 57 => array( 'MagazineArticle' => array( 'id' => '1140', 'magazine_issue_id' => '839', 'magazine_category_id' => '63', 'title' => 'Technical Analysis Monthly (Jan 20, 14 – Feb 19, 15) : Bullish Signal for Long Term', 'image' => null, 'short_content' => 'After the huge gains witnessed in the previous periods, Nepse remained almost flat during the past 30 days. However, there was an overall positive gain in the market as Nepse increased by 7.2 points (or 0.74%) to close at 982.65 points.', 'status' => true, 'publish_date' => '0000-00-00' ) ), (int) 58 => array( 'MagazineArticle' => array( 'id' => '1108', 'magazine_issue_id' => '811', 'magazine_category_id' => '63', 'title' => 'Waiting for Confirmation Signal', 'image' => null, 'short_content' => 'Nepal’s secondary market turned little green with hopes that agreement between major political parties on contentious issues of new constitution was underway. The Nepse index accelerated 66.19 points or 7.38 per cent to close at 962.80. ', 'status' => true, 'publish_date' => '0000-00-00' ) ), (int) 59 => array( 'MagazineArticle' => array( 'id' => '1109', 'magazine_issue_id' => '811', 'magazine_category_id' => '63', 'title' => 'Technical Analysis Monthly (Dec 21, 2014 to Jan 20, 2015)', 'image' => null, 'short_content' => 'Giving continuity to the previous period’s positive momentum, Nepse has been able to make remarkable gains during this period. The stock market moved past its strong resistance level of 938.41 to close at 962.8 points – an increase of 58.91 points or 6.52 per cent.', 'status' => true, 'publish_date' => '0000-00-00' ) ), (int) 60 => array( 'MagazineArticle' => array( 'id' => '1064', 'magazine_issue_id' => '783', 'magazine_category_id' => '63', 'title' => 'Politics Still a Factor', 'image' => null, 'short_content' => 'Most of the listed companies have declared their dividends and few others are about to make these announcements. This means that the price adjustment of the stock after dividend declaration has also played role in driving the prices lower for such few companies. ', 'status' => true, 'publish_date' => '0000-00-00' ) ), (int) 61 => array( 'MagazineArticle' => array( 'id' => '1065', 'magazine_issue_id' => '783', 'magazine_category_id' => '63', 'title' => 'Technical Analysis Monthly (Nov 21 – Dec 20) : Fighting 916 Resistance', 'image' => null, 'short_content' => 'There was significant sideways movement in Nepse in the period between Nov 21, 2014 and Dec 20, 2014. The immediate support level of 844.42 was tested three times while the imme-diate resistance level of 875.56 was tested once in the review period.', 'status' => true, 'publish_date' => '0000-00-00' ) ), (int) 62 => array( 'MagazineArticle' => array( 'id' => '1036', 'magazine_issue_id' => '756', 'magazine_category_id' => '63', 'title' => 'Market Dips to 6 Months Low', 'image' => null, 'short_content' => 'The stock market of Nepal plunged to 6 months low in the review period as gloomy political winter cooled investors’ sentiment. The Nepse index lost 61.84 points or 6.69% to rest at 862.5 while the session’s high was on 27 Oct with 935.01 and lowest was on 18 Nov with 844.06. ', 'status' => true, 'publish_date' => '0000-00-00' ) ), (int) 63 => array( 'MagazineArticle' => array( 'id' => '1037', 'magazine_issue_id' => '756', 'magazine_category_id' => '63', 'title' => 'Technical Analysis Monthly (Oct 20 – Nov 20)', 'image' => null, 'short_content' => 'Since Nepse peaked at 1083.55 points on July 21, 2014, the stock market has been following a bearish pattern. Though the markets stabilized and saw a 2.88% rebound during the last trading period, overall Nepse has continued its downward trend', 'status' => true, 'publish_date' => '0000-00-00' ) ), (int) 64 => array( 'MagazineArticle' => array( 'id' => '1038', 'magazine_issue_id' => '756', 'magazine_category_id' => '63', 'title' => 'Ups and Downs in Nepali Stock Market', 'image' => null, 'short_content' => 'Ups and downs in the indicators of the stock market are a regular phenomenon. The market goes up when more investors exercise for buying stocks and slips down when more investors are in the mood to sell their shares. If they quickly want to exit from the market,', 'status' => true, 'publish_date' => '0000-00-00' ) ), (int) 65 => array( 'MagazineArticle' => array( 'id' => '992', 'magazine_issue_id' => '730', 'magazine_category_id' => '63', 'title' => 'Market Stalled after Losing Steam', 'image' => null, 'short_content' => 'The Nepali stock market remained stable during the review period despite the recent sharp fall. The benchmark Nepse index added 3.71 points or 0.40% to reach 923.59 while the session’s high was on 30 September with 937.99 and lowest was on 22 September with 881.87. ', 'status' => true, 'publish_date' => '0000-00-00' ) ), (int) 66 => array( 'MagazineArticle' => array( 'id' => '993', 'magazine_issue_id' => '730', 'magazine_category_id' => '63', 'title' => 'Monthly Technical Analysis of Nepse November 2014', 'image' => null, 'short_content' => 'After two continuous trading periods of huge declines, Nepse has stabilized in recent times. Compared to the previous period, Nepse made an upward gain of 25.96 points (or 2.88%) closing at 925.85 points. ', 'status' => true, 'publish_date' => '0000-00-00' ) ), (int) 67 => array( 'MagazineArticle' => array( 'id' => '994', 'magazine_issue_id' => '730', 'magazine_category_id' => '63', 'title' => 'Privatization, Corporatization and Strategic Partner for NEPSE', 'image' => null, 'short_content' => 'Historically stock exchanges started as a mutually governed, non-profit making, self-regulated cooperative like structures. Mostly brokers were the owners of such exchanges. However, due to the change in the technology and the concept of securities commission as apex regulator', 'status' => true, 'publish_date' => '0000-00-00' ) ), (int) 68 => array( 'MagazineArticle' => array( 'id' => '920', 'magazine_issue_id' => '678', 'magazine_category_id' => '63', 'title' => 'The Big Retreat', 'image' => null, 'short_content' => 'The Nepali bourse cooled down after reaching a high of 1083.55 as selling pressure ruled the market. The benchmark Nepse index plummeted 61.35 points or 5.71% to close at 1013.6 while session’s high was on 21st July with 1083.55 and lowest on 18th August with 1013.25. ', 'status' => true, 'publish_date' => '0000-00-00' ) ), (int) 69 => array( 'MagazineArticle' => array( 'id' => '921', 'magazine_issue_id' => '678', 'magazine_category_id' => '63', 'title' => 'Monthly Technical Analysis of Nepse (July 21 - August 14, 2014)', 'image' => null, 'short_content' => 'On the first trading day of the review period the secondary market had witnessed the highest rise as the benchmark index settled at 1083.55 points, a new high since the last 6 years. On the same day Nepse had attained the highest turnover of NPR 1.20 billion on a single trading day in its history.', 'status' => true, 'publish_date' => '0000-00-00' ) ), (int) 70 => array( 'MagazineArticle' => array( 'id' => '952', 'magazine_issue_id' => '704', 'magazine_category_id' => '63', 'title' => 'The End of Bull Run', 'image' => null, 'short_content' => 'The stock market of Nepal which was predicted to break the previous historic high level of 1175.38 points pulled back from 1083.55 and witnessed a nose dive sessions. ', 'status' => true, 'publish_date' => '0000-00-00' ) ), (int) 71 => array( 'MagazineArticle' => array( 'id' => '953', 'magazine_issue_id' => '704', 'magazine_category_id' => '63', 'title' => 'Monthly Technical Analysis of Nepse October 2014', 'image' => null, 'short_content' => 'Nepal Stock Exchange (Nepse) index continued spiralling downwards during the August 19 to September 18, 2014 period, just like the preceding period. During the review period, Nepse fell by 134.5 points (-13 per cent) to close at 899.89 points.', 'status' => true, 'publish_date' => '0000-00-00' ) ), (int) 72 => array( 'MagazineArticle' => array( 'id' => '954', 'magazine_issue_id' => '704', 'magazine_category_id' => '63', 'title' => 'NRN Investment through Capital Market', 'image' => null, 'short_content' => '‘Economic Roadmap for Prosperous Nepal’ was the main theme of 8th NRN regional conference held on Nagano, Japan from September 18 to 19. About three hundred NRNs had participated from different part of the globe to discuss on the given theme. ', 'status' => true, 'publish_date' => '0000-00-00' ) ), (int) 73 => array( 'MagazineArticle' => array( 'id' => '1405', 'magazine_issue_id' => '957', 'magazine_category_id' => '63', 'title' => 'Monthly Technical Analysis of Nepse (29 November to 24 December, 2015)', 'image' => null, 'short_content' => 'The benchmark index saw huge changes in the course of last month. Despite all the difficulties and political unrest in the country, Nepse gained a staggering 114.26 points (or up 11.17%) to close at 1137.03. It seems that the monetary policy is still playing a major role in causing the market to be bullish.', 'status' => true, 'publish_date' => '0000-00-00' ) ) ) $magazineCategory = array( 'MagazineCategory' => array( 'id' => '63', 'title' => 'Stock Taking', 'sortorder' => '516', 'status' => true, 'created' => '0000-00-00 00:00:00', 'homepage' => true, 'modified' => '2013-04-01 00:00:00' ) ) $magazineArticle = array( 'MagazineArticle' => array( 'id' => '1405', 'magazine_issue_id' => '957', 'magazine_category_id' => '63', 'title' => 'Monthly Technical Analysis of Nepse (29 November to 24 December, 2015)', 'image' => null, 'short_content' => 'The benchmark index saw huge changes in the course of last month. Despite all the difficulties and political unrest in the country, Nepse gained a staggering 114.26 points (or up 11.17%) to close at 1137.03. It seems that the monetary policy is still playing a major role in causing the market to be bullish.', 'status' => true, 'publish_date' => '0000-00-00' ) ) $issue_title = array() $width = (int) 400 $height = (int) 230 $ratio = (float) 1.7391304347826 $img_width = (int) 160 $img_height = (float) 92include - APP/View/MagazineArticles/category.ctp, line 86 View::_evaluate() - CORE/Cake/View/View.php, line 971 View::_render() - CORE/Cake/View/View.php, line 933 View::render() - CORE/Cake/View/View.php, line 473 Controller::render() - CORE/Cake/Controller/Controller.php, line 968 Dispatcher::_invoke() - CORE/Cake/Routing/Dispatcher.php, line 200 Dispatcher::dispatch() - CORE/Cake/Routing/Dispatcher.php, line 167 [main] - APP/webroot/index.php, line 117

Notice (8): Undefined variable: file [APP/View/Elements/side_bar.ctp, line 60]Code Context// $file = 'http://aabhiyan:QUVLg8Wzs2F7G9N7@nepalstock.com.np/api/indexdata.xml';if(!$xml = simplexml_load_file($file)){$viewFile = '/var/www/html/newbusinessage.com/app/View/Elements/side_bar.ctp' $dataForView = array( 'current_user' => null, 'logged_in' => false ) $current_user = null $logged_in = falseinclude - APP/View/Elements/side_bar.ctp, line 60 View::_evaluate() - CORE/Cake/View/View.php, line 971 View::_render() - CORE/Cake/View/View.php, line 933 View::_renderElement() - CORE/Cake/View/View.php, line 1224 View::element() - CORE/Cake/View/View.php, line 418 include - APP/View/MagazineArticles/category.ctp, line 117 View::_evaluate() - CORE/Cake/View/View.php, line 971 View::_render() - CORE/Cake/View/View.php, line 933 View::render() - CORE/Cake/View/View.php, line 473 Controller::render() - CORE/Cake/Controller/Controller.php, line 968 Dispatcher::_invoke() - CORE/Cake/Routing/Dispatcher.php, line 200 Dispatcher::dispatch() - CORE/Cake/Routing/Dispatcher.php, line 167 [main] - APP/webroot/index.php, line 117
Warning (2): simplexml_load_file() [<a href='http://php.net/function.simplexml-load-file'>function.simplexml-load-file</a>]: I/O warning : failed to load external entity "" [APP/View/Elements/side_bar.ctp, line 60]file not found!Code Context// $file = 'http://aabhiyan:QUVLg8Wzs2F7G9N7@nepalstock.com.np/api/indexdata.xml';if(!$xml = simplexml_load_file($file)){$viewFile = '/var/www/html/newbusinessage.com/app/View/Elements/side_bar.ctp' $dataForView = array( 'current_user' => null, 'logged_in' => false ) $current_user = null $logged_in = falsesimplexml_load_file - [internal], line ?? include - APP/View/Elements/side_bar.ctp, line 60 View::_evaluate() - CORE/Cake/View/View.php, line 971 View::_render() - CORE/Cake/View/View.php, line 933 View::_renderElement() - CORE/Cake/View/View.php, line 1224 View::element() - CORE/Cake/View/View.php, line 418 include - APP/View/MagazineArticles/category.ctp, line 117 View::_evaluate() - CORE/Cake/View/View.php, line 971 View::_render() - CORE/Cake/View/View.php, line 933 View::render() - CORE/Cake/View/View.php, line 473 Controller::render() - CORE/Cake/Controller/Controller.php, line 968 Dispatcher::_invoke() - CORE/Cake/Routing/Dispatcher.php, line 200 Dispatcher::dispatch() - CORE/Cake/Routing/Dispatcher.php, line 167 [main] - APP/webroot/index.php, line 117
Notice (8): Undefined variable: file [APP/View/Elements/side_bar.ctp, line 133]Code Context// $file = 'http://aabhiyan:QUVLg8Wzs2F7G9N7@nepalstock.com.np/api/subindexdata.xml';if(!$xml = simplexml_load_file($file)){$viewFile = '/var/www/html/newbusinessage.com/app/View/Elements/side_bar.ctp' $dataForView = array( 'current_user' => null, 'logged_in' => false ) $current_user = null $logged_in = false $xml = falseinclude - APP/View/Elements/side_bar.ctp, line 133 View::_evaluate() - CORE/Cake/View/View.php, line 971 View::_render() - CORE/Cake/View/View.php, line 933 View::_renderElement() - CORE/Cake/View/View.php, line 1224 View::element() - CORE/Cake/View/View.php, line 418 include - APP/View/MagazineArticles/category.ctp, line 117 View::_evaluate() - CORE/Cake/View/View.php, line 971 View::_render() - CORE/Cake/View/View.php, line 933 View::render() - CORE/Cake/View/View.php, line 473 Controller::render() - CORE/Cake/Controller/Controller.php, line 968 Dispatcher::_invoke() - CORE/Cake/Routing/Dispatcher.php, line 200 Dispatcher::dispatch() - CORE/Cake/Routing/Dispatcher.php, line 167 [main] - APP/webroot/index.php, line 117
Warning (2): simplexml_load_file() [<a href='http://php.net/function.simplexml-load-file'>function.simplexml-load-file</a>]: I/O warning : failed to load external entity "" [APP/View/Elements/side_bar.ctp, line 133]file not found!Code Context// $file = 'http://aabhiyan:QUVLg8Wzs2F7G9N7@nepalstock.com.np/api/subindexdata.xml';if(!$xml = simplexml_load_file($file)){$viewFile = '/var/www/html/newbusinessage.com/app/View/Elements/side_bar.ctp' $dataForView = array( 'current_user' => null, 'logged_in' => false ) $current_user = null $logged_in = false $xml = falsesimplexml_load_file - [internal], line ?? include - APP/View/Elements/side_bar.ctp, line 133 View::_evaluate() - CORE/Cake/View/View.php, line 971 View::_render() - CORE/Cake/View/View.php, line 933 View::_renderElement() - CORE/Cake/View/View.php, line 1224 View::element() - CORE/Cake/View/View.php, line 418 include - APP/View/MagazineArticles/category.ctp, line 117 View::_evaluate() - CORE/Cake/View/View.php, line 971 View::_render() - CORE/Cake/View/View.php, line 933 View::render() - CORE/Cake/View/View.php, line 473 Controller::render() - CORE/Cake/Controller/Controller.php, line 968 Dispatcher::_invoke() - CORE/Cake/Routing/Dispatcher.php, line 200 Dispatcher::dispatch() - CORE/Cake/Routing/Dispatcher.php, line 167 [main] - APP/webroot/index.php, line 117


| Currency | Unit |
Buy | Sell |
| U.S. Dollar | 1 | 121.23 | 121.83 |
| European Euro | 1 | 131.65 | 132.31 |
| UK Pound Sterling | 1 | 142.47 | 143.18 |
| Swiss Franc | 1 | 124.29 | 124.90 |
| Australian Dollar | 1 | 71.69 | 72.05 |
| Canadian Dollar | 1 | 83.90 | 84.32 |
| Japanese Yen | 10 | 10.94 | 11.00 |
| Chinese Yuan | 1 | 17.17 | 17.26 |
| Saudi Arabian Riyal | 1 | 32.27 | 32.43 |
| UAE Dirham | 1 | 33.01 | 33.17 |
| Malaysian Ringgit | 1 | 27.36 | 27.50 |
| South Korean Won | 100 | 9.77 | 9.82 |
Update: 2020-03-25 | Source: Nepal Rastra Bank (NRB)
| Fine Gold | 1 tola | 77000.00 |
| Tejabi Gold | 1 tola | 76700.00 |
| Silver | 1 tola | 720.00 |
Update : 2020-03-25
Source: Federation of Nepal Gold and Silver Dealers' Association
| Petrol | 1 Liter | 106.00 |
| Diesel | 1 Liter | 95.00 |
| Kerosene | 1 Liter | 95.00 |
| LP Gas | 1 Cylinder | 1375.00 |
Update : 2020-03-25