Notice (8): Trying to access array offset on value of type null [APP/View/MagazineArticles/view.ctp, line 54]Code Context $user = $this->Session->read('Auth.User');
//find the group of logged user
$groupId = $user['Group']['id'];
$viewFile = '/var/www/html/newbusinessage.com/app/View/MagazineArticles/view.ctp'
$dataForView = array(
'magazineArticle' => array(
'MagazineArticle' => array(
'id' => '1982',
'magazine_issue_id' => '980',
'magazine_category_id' => '63',
'title' => 'Monthly Technical Analysis of Nepse (22 October to 23 November 2017)',
'image' => null,
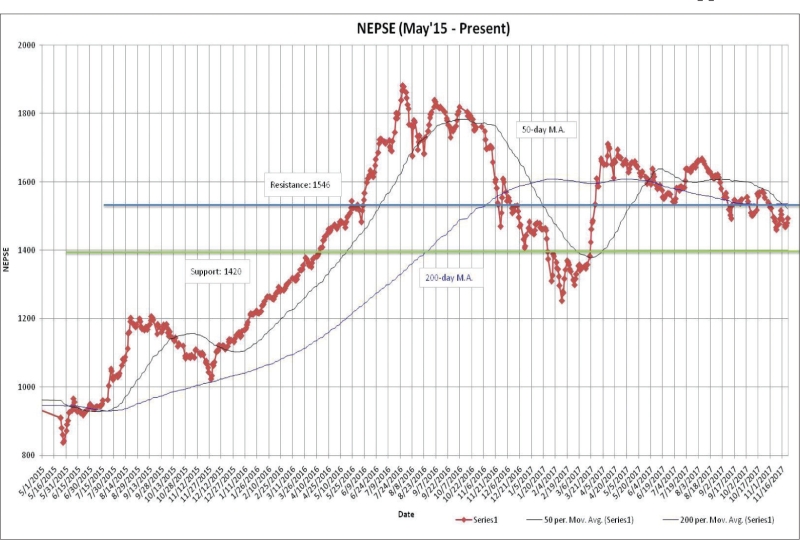
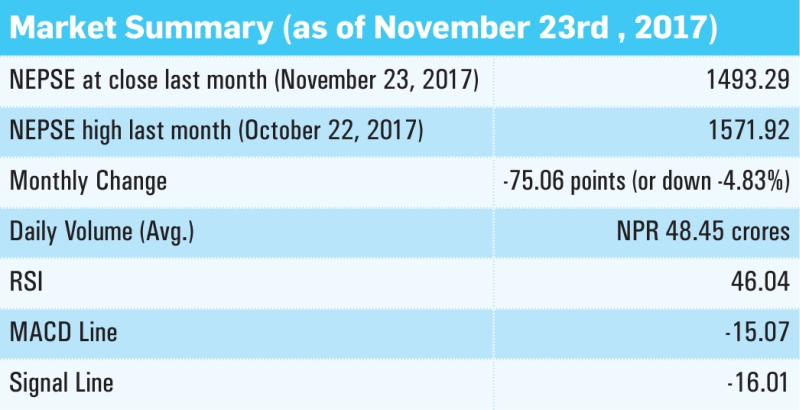
'short_content' => 'The benchmark index fell by 75.06 points (or down 4.83%) to close at 1493.29 last month. The index is hovering below the 50-day, as well as the 200-day moving average. This shows the market to be in a bearish mode in the course of last month.',
'content' => '<div style="text-align: justify;"><span style="font-size:18px"><strong>MACD above Signal Line </strong></span></div>
<div style="text-align: center;"><img alt="" src="/userfiles/images/Clipboard22%283%29.jpg" style="height:540px; width:800px" /></div>
<div style="text-align: center;"><img alt="" src="/userfiles/images/Clipboard21%284%29.jpg" style="height:410px; width:800px" /></div>
<div style="text-align: center;"> </div>
<div style="text-align: justify;"><span style="font-size:16px"><strong>Trend Analysis</strong></span></div>
<div style="text-align: justify;">The benchmark index fell by 75.06 points (or down 4.83%) to close at 1493.29 last month. The index is hovering below the 50-day, as well as the 200-day moving average. This shows the market to be in a bearish mode in the course of last month. Unsatisfactory first quarter reports of the BFIs further supported the bearish sentiment. The average volume turnover increased to NPR 48.45 crores from NPR 38.74 crores the month prior. </div>
<div style="text-align: justify;"> </div>
<div style="text-align: justify;"><span style="font-size:16px"><strong>Resistance and Support</strong></span></div>
<div style="text-align: center;"><img alt="" src="/userfiles/images/Clipboard23%284%29.jpg" style="height:354px; width:700px" /></div>
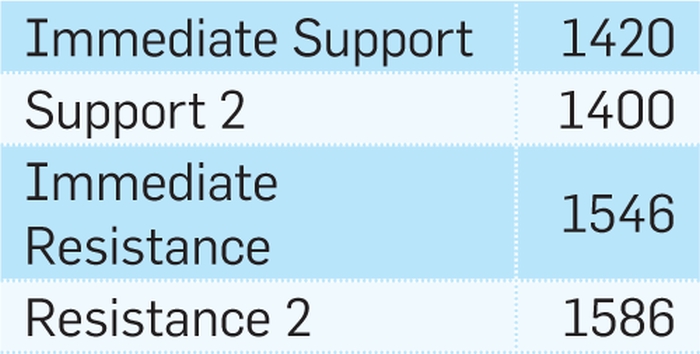
<div style="text-align: justify;">The Nepse index broke the immediate support level of 1480 and fell as low as 1460.73 towards the middle of last month. Currently the immediate support and resistance level stands at 1420 and 1546 respectively. Positive political environment should trigger a bullish sentiment in the coming weeks. </div>
<div style="text-align: justify;"> </div>
<div style="text-align: justify;"><span style="font-size:16px"><strong>Nepse Trend Indicator</strong></span></div>
<div style="text-align: justify;"><strong>a. MACD</strong></div>
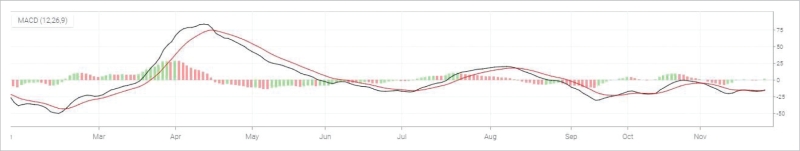
<div style="text-align: justify;">The MACD is a momentum oscillator formed by using two different types of moving averages, which provides specific buying or selling signals. When a MACD line crosses above the signal line, it is considered to be a positive sign and indicates a time to buy, and vice-versa. </div>
<div style="text-align: justify;"> </div>
<div style="text-align: justify;">The MACD and the signal line, at the beginning of last month, stood at -4.83 and -13.67 respectively. In the course of the month, both the MACD and the signal line fell by 10.23 and 2.34 points to close at -15.07 and -16.01 respectively. MACD line crossing above the signal line indicates a bullish trigger. However, both the lines are in the negative territory, which still shows bearish presence in the market.</div>
<div style="text-align: justify;"> </div>
<div style="text-align: center;"><img alt="" src="/userfiles/images/Clipboard24%286%29.jpg" style="height:151px; width:800px" /></div>
<div style="text-align: justify;"> </div>
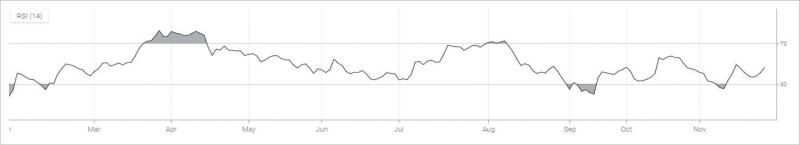
<div style="text-align: justify;"><strong>b. RSI</strong></div>
<div style="text-align: justify;">RSI is a form of leading indicator that is believed to be most effective during periods of sideways movement. Such indicators may create numerous buy and sell signals that are useful when the market is not clearly trending upwards or downwards. </div>
<div style="text-align: justify;"> </div>
<div style="text-align: justify;">The RSI, at the beginning of last month, stood at 57.48 level. In the course of the month, it lost 11.44 points to close at 46.04 level. The RSI fell as low as 25.08 towards the middle of the month, indicating high selling pressure in the market. Currently, the RSI shows a neutral stance. </div>
<div style="text-align: justify;"> </div>
<div style="text-align: center;"><img alt="" src="/userfiles/images/Clipboard25%284%29.jpg" style="height:145px; width:800px" /></div>
<div style="text-align: justify;"> </div>
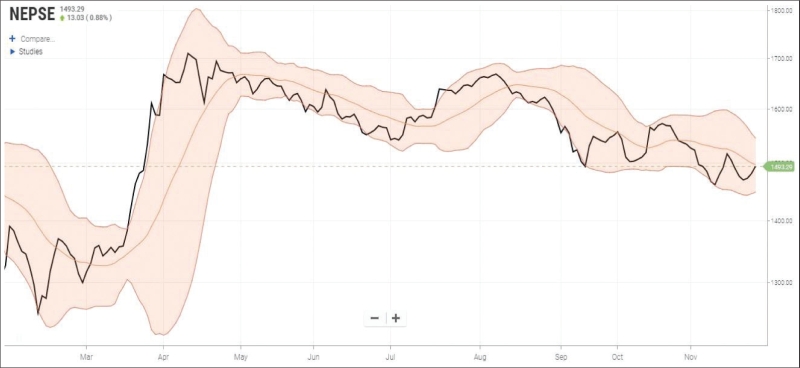
<div style="text-align: justify;"><strong>c. Bollinger Bands</strong></div>
<div style="text-align: justify;">The Bollinger Band is a technical indicator that consists of a moving average (21-day) along with two trading bands above (upper band) and below it (lower band). The bands are an indication of volatility, which are represented by calculating standard deviation. </div>
<div style="text-align: justify;"> </div>
<div style="text-align: justify;">The benchmark index fell as low as the lower Bollinger band middle of last month, indicating high selling pressure in the market. However, towards the second half of the month, the index hovered between the lower and middle bands, which show a decrease in the selling pressure. The market volatility remains high as the distance between the lower and upper band diverged in the course of last month.</div>
<div style="text-align: justify;"> </div>
<div style="text-align: center;"><img alt="" src="/userfiles/images/Clipboard26%281%29.jpg" style="height:368px; width:800px" /></div>
<div style="text-align: justify;"> </div>
<div style="text-align: justify;"><span style="font-size:16px"><strong>Overview</strong></span></div>
<div style="text-align: justify;">The benchmark index declined by 75.06 points (or down 4.83%) to close at 1493.29 last month. The index is hovering below the 50 and 200-day moving average, giving a bearish signal. The MACD indicator has surpassed the signal line, which is a possible bullish trigger. However, both the lines continue to hover in the negative territory. RSI indicator closing at 48.45 level, giving a neutral stance. The Bollinger bands show a decrease in the selling pressure as the index moves close to the middle band. The new support and resistance level stands at 1420 and 1546 respectively. </div>
',
'status' => true,
'publish_date' => '0000-00-00',
'created' => '2017-12-14 11:04:21',
'modified' => '2017-12-14 11:24:37',
'keywords' => '',
'description' => '',
'sortorder' => '1939',
'feature_article' => true,
'user_id' => '11',
'image1' => null,
'image2' => null,
'image3' => null,
'image4' => null
),
'MagazineIssue' => array(
'id' => '980',
'image' => '20171210111009_Clipboard45.jpg',
'sortorder' => '1529',
'published' => true,
'created' => '2017-12-10 11:10:09',
'modified' => '2017-12-13 11:46:15',
'title' => 'December 2017',
'publish_date' => '2017-12-01',
'parent_id' => '0',
'homepage' => true,
'user_id' => '11'
),
'MagazineCategory' => array(
'id' => '63',
'title' => 'Stock Taking',
'sortorder' => '516',
'status' => true,
'created' => '0000-00-00 00:00:00',
'homepage' => true,
'modified' => '2013-04-01 00:00:00'
),
'User' => array(
'password' => '*****',
'id' => '11',
'user_detail_id' => '0',
'group_id' => '24',
'username' => 'nsingha@abhiyan.com.np',
'name' => '',
'email' => 'nsingha@abhiyan.com.np',
'address' => '',
'gender' => '',
'access' => '1',
'phone' => '',
'access_type' => '0',
'activated' => false,
'sortorder' => '0',
'published' => '0',
'created' => '2015-04-08 13:22:59',
'last_login' => '2023-04-16 09:29:47',
'ip' => '172.69.77.43'
),
'MagazineArticleComment' => array(),
'MagazineView' => array(
(int) 0 => array(
[maximum depth reached]
)
)
),
'current_user' => null,
'logged_in' => false
)
$magazineArticle = array(
'MagazineArticle' => array(
'id' => '1982',
'magazine_issue_id' => '980',
'magazine_category_id' => '63',
'title' => 'Monthly Technical Analysis of Nepse (22 October to 23 November 2017)',
'image' => null,
'short_content' => 'The benchmark index fell by 75.06 points (or down 4.83%) to close at 1493.29 last month. The index is hovering below the 50-day, as well as the 200-day moving average. This shows the market to be in a bearish mode in the course of last month.',
'content' => '<div style="text-align: justify;"><span style="font-size:18px"><strong>MACD above Signal Line </strong></span></div>
<div style="text-align: center;"><img alt="" src="/userfiles/images/Clipboard22%283%29.jpg" style="height:540px; width:800px" /></div>
<div style="text-align: center;"><img alt="" src="/userfiles/images/Clipboard21%284%29.jpg" style="height:410px; width:800px" /></div>
<div style="text-align: center;"> </div>
<div style="text-align: justify;"><span style="font-size:16px"><strong>Trend Analysis</strong></span></div>
<div style="text-align: justify;">The benchmark index fell by 75.06 points (or down 4.83%) to close at 1493.29 last month. The index is hovering below the 50-day, as well as the 200-day moving average. This shows the market to be in a bearish mode in the course of last month. Unsatisfactory first quarter reports of the BFIs further supported the bearish sentiment. The average volume turnover increased to NPR 48.45 crores from NPR 38.74 crores the month prior. </div>
<div style="text-align: justify;"> </div>
<div style="text-align: justify;"><span style="font-size:16px"><strong>Resistance and Support</strong></span></div>
<div style="text-align: center;"><img alt="" src="/userfiles/images/Clipboard23%284%29.jpg" style="height:354px; width:700px" /></div>
<div style="text-align: justify;">The Nepse index broke the immediate support level of 1480 and fell as low as 1460.73 towards the middle of last month. Currently the immediate support and resistance level stands at 1420 and 1546 respectively. Positive political environment should trigger a bullish sentiment in the coming weeks. </div>
<div style="text-align: justify;"> </div>
<div style="text-align: justify;"><span style="font-size:16px"><strong>Nepse Trend Indicator</strong></span></div>
<div style="text-align: justify;"><strong>a. MACD</strong></div>
<div style="text-align: justify;">The MACD is a momentum oscillator formed by using two different types of moving averages, which provides specific buying or selling signals. When a MACD line crosses above the signal line, it is considered to be a positive sign and indicates a time to buy, and vice-versa. </div>
<div style="text-align: justify;"> </div>
<div style="text-align: justify;">The MACD and the signal line, at the beginning of last month, stood at -4.83 and -13.67 respectively. In the course of the month, both the MACD and the signal line fell by 10.23 and 2.34 points to close at -15.07 and -16.01 respectively. MACD line crossing above the signal line indicates a bullish trigger. However, both the lines are in the negative territory, which still shows bearish presence in the market.</div>
<div style="text-align: justify;"> </div>
<div style="text-align: center;"><img alt="" src="/userfiles/images/Clipboard24%286%29.jpg" style="height:151px; width:800px" /></div>
<div style="text-align: justify;"> </div>
<div style="text-align: justify;"><strong>b. RSI</strong></div>
<div style="text-align: justify;">RSI is a form of leading indicator that is believed to be most effective during periods of sideways movement. Such indicators may create numerous buy and sell signals that are useful when the market is not clearly trending upwards or downwards. </div>
<div style="text-align: justify;"> </div>
<div style="text-align: justify;">The RSI, at the beginning of last month, stood at 57.48 level. In the course of the month, it lost 11.44 points to close at 46.04 level. The RSI fell as low as 25.08 towards the middle of the month, indicating high selling pressure in the market. Currently, the RSI shows a neutral stance. </div>
<div style="text-align: justify;"> </div>
<div style="text-align: center;"><img alt="" src="/userfiles/images/Clipboard25%284%29.jpg" style="height:145px; width:800px" /></div>
<div style="text-align: justify;"> </div>
<div style="text-align: justify;"><strong>c. Bollinger Bands</strong></div>
<div style="text-align: justify;">The Bollinger Band is a technical indicator that consists of a moving average (21-day) along with two trading bands above (upper band) and below it (lower band). The bands are an indication of volatility, which are represented by calculating standard deviation. </div>
<div style="text-align: justify;"> </div>
<div style="text-align: justify;">The benchmark index fell as low as the lower Bollinger band middle of last month, indicating high selling pressure in the market. However, towards the second half of the month, the index hovered between the lower and middle bands, which show a decrease in the selling pressure. The market volatility remains high as the distance between the lower and upper band diverged in the course of last month.</div>
<div style="text-align: justify;"> </div>
<div style="text-align: center;"><img alt="" src="/userfiles/images/Clipboard26%281%29.jpg" style="height:368px; width:800px" /></div>
<div style="text-align: justify;"> </div>
<div style="text-align: justify;"><span style="font-size:16px"><strong>Overview</strong></span></div>
<div style="text-align: justify;">The benchmark index declined by 75.06 points (or down 4.83%) to close at 1493.29 last month. The index is hovering below the 50 and 200-day moving average, giving a bearish signal. The MACD indicator has surpassed the signal line, which is a possible bullish trigger. However, both the lines continue to hover in the negative territory. RSI indicator closing at 48.45 level, giving a neutral stance. The Bollinger bands show a decrease in the selling pressure as the index moves close to the middle band. The new support and resistance level stands at 1420 and 1546 respectively. </div>
',
'status' => true,
'publish_date' => '0000-00-00',
'created' => '2017-12-14 11:04:21',
'modified' => '2017-12-14 11:24:37',
'keywords' => '',
'description' => '',
'sortorder' => '1939',
'feature_article' => true,
'user_id' => '11',
'image1' => null,
'image2' => null,
'image3' => null,
'image4' => null
),
'MagazineIssue' => array(
'id' => '980',
'image' => '20171210111009_Clipboard45.jpg',
'sortorder' => '1529',
'published' => true,
'created' => '2017-12-10 11:10:09',
'modified' => '2017-12-13 11:46:15',
'title' => 'December 2017',
'publish_date' => '2017-12-01',
'parent_id' => '0',
'homepage' => true,
'user_id' => '11'
),
'MagazineCategory' => array(
'id' => '63',
'title' => 'Stock Taking',
'sortorder' => '516',
'status' => true,
'created' => '0000-00-00 00:00:00',
'homepage' => true,
'modified' => '2013-04-01 00:00:00'
),
'User' => array(
'password' => '*****',
'id' => '11',
'user_detail_id' => '0',
'group_id' => '24',
'username' => 'nsingha@abhiyan.com.np',
'name' => '',
'email' => 'nsingha@abhiyan.com.np',
'address' => '',
'gender' => '',
'access' => '1',
'phone' => '',
'access_type' => '0',
'activated' => false,
'sortorder' => '0',
'published' => '0',
'created' => '2015-04-08 13:22:59',
'last_login' => '2023-04-16 09:29:47',
'ip' => '172.69.77.43'
),
'MagazineArticleComment' => array(),
'MagazineView' => array(
(int) 0 => array(
'magazine_article_id' => '1982',
'hit' => '3162'
)
)
)
$current_user = null
$logged_in = false
$user = null
include - APP/View/MagazineArticles/view.ctp, line 54
View::_evaluate() - CORE/Cake/View/View.php, line 971
View::_render() - CORE/Cake/View/View.php, line 933
View::render() - CORE/Cake/View/View.php, line 473
Controller::render() - CORE/Cake/Controller/Controller.php, line 968
Dispatcher::_invoke() - CORE/Cake/Routing/Dispatcher.php, line 200
Dispatcher::dispatch() - CORE/Cake/Routing/Dispatcher.php, line 167
[main] - APP/webroot/index.php, line 117
Notice (8): Trying to access array offset on value of type null [APP/View/MagazineArticles/view.ctp, line 54]Code Context $user = $this->Session->read('Auth.User');
//find the group of logged user
$groupId = $user['Group']['id'];
$viewFile = '/var/www/html/newbusinessage.com/app/View/MagazineArticles/view.ctp'
$dataForView = array(
'magazineArticle' => array(
'MagazineArticle' => array(
'id' => '1982',
'magazine_issue_id' => '980',
'magazine_category_id' => '63',
'title' => 'Monthly Technical Analysis of Nepse (22 October to 23 November 2017)',
'image' => null,
'short_content' => 'The benchmark index fell by 75.06 points (or down 4.83%) to close at 1493.29 last month. The index is hovering below the 50-day, as well as the 200-day moving average. This shows the market to be in a bearish mode in the course of last month.',
'content' => '<div style="text-align: justify;"><span style="font-size:18px"><strong>MACD above Signal Line </strong></span></div>
<div style="text-align: center;"><img alt="" src="/userfiles/images/Clipboard22%283%29.jpg" style="height:540px; width:800px" /></div>
<div style="text-align: center;"><img alt="" src="/userfiles/images/Clipboard21%284%29.jpg" style="height:410px; width:800px" /></div>
<div style="text-align: center;"> </div>
<div style="text-align: justify;"><span style="font-size:16px"><strong>Trend Analysis</strong></span></div>
<div style="text-align: justify;">The benchmark index fell by 75.06 points (or down 4.83%) to close at 1493.29 last month. The index is hovering below the 50-day, as well as the 200-day moving average. This shows the market to be in a bearish mode in the course of last month. Unsatisfactory first quarter reports of the BFIs further supported the bearish sentiment. The average volume turnover increased to NPR 48.45 crores from NPR 38.74 crores the month prior. </div>
<div style="text-align: justify;"> </div>
<div style="text-align: justify;"><span style="font-size:16px"><strong>Resistance and Support</strong></span></div>
<div style="text-align: center;"><img alt="" src="/userfiles/images/Clipboard23%284%29.jpg" style="height:354px; width:700px" /></div>
<div style="text-align: justify;">The Nepse index broke the immediate support level of 1480 and fell as low as 1460.73 towards the middle of last month. Currently the immediate support and resistance level stands at 1420 and 1546 respectively. Positive political environment should trigger a bullish sentiment in the coming weeks. </div>
<div style="text-align: justify;"> </div>
<div style="text-align: justify;"><span style="font-size:16px"><strong>Nepse Trend Indicator</strong></span></div>
<div style="text-align: justify;"><strong>a. MACD</strong></div>
<div style="text-align: justify;">The MACD is a momentum oscillator formed by using two different types of moving averages, which provides specific buying or selling signals. When a MACD line crosses above the signal line, it is considered to be a positive sign and indicates a time to buy, and vice-versa. </div>
<div style="text-align: justify;"> </div>
<div style="text-align: justify;">The MACD and the signal line, at the beginning of last month, stood at -4.83 and -13.67 respectively. In the course of the month, both the MACD and the signal line fell by 10.23 and 2.34 points to close at -15.07 and -16.01 respectively. MACD line crossing above the signal line indicates a bullish trigger. However, both the lines are in the negative territory, which still shows bearish presence in the market.</div>
<div style="text-align: justify;"> </div>
<div style="text-align: center;"><img alt="" src="/userfiles/images/Clipboard24%286%29.jpg" style="height:151px; width:800px" /></div>
<div style="text-align: justify;"> </div>
<div style="text-align: justify;"><strong>b. RSI</strong></div>
<div style="text-align: justify;">RSI is a form of leading indicator that is believed to be most effective during periods of sideways movement. Such indicators may create numerous buy and sell signals that are useful when the market is not clearly trending upwards or downwards. </div>
<div style="text-align: justify;"> </div>
<div style="text-align: justify;">The RSI, at the beginning of last month, stood at 57.48 level. In the course of the month, it lost 11.44 points to close at 46.04 level. The RSI fell as low as 25.08 towards the middle of the month, indicating high selling pressure in the market. Currently, the RSI shows a neutral stance. </div>
<div style="text-align: justify;"> </div>
<div style="text-align: center;"><img alt="" src="/userfiles/images/Clipboard25%284%29.jpg" style="height:145px; width:800px" /></div>
<div style="text-align: justify;"> </div>
<div style="text-align: justify;"><strong>c. Bollinger Bands</strong></div>
<div style="text-align: justify;">The Bollinger Band is a technical indicator that consists of a moving average (21-day) along with two trading bands above (upper band) and below it (lower band). The bands are an indication of volatility, which are represented by calculating standard deviation. </div>
<div style="text-align: justify;"> </div>
<div style="text-align: justify;">The benchmark index fell as low as the lower Bollinger band middle of last month, indicating high selling pressure in the market. However, towards the second half of the month, the index hovered between the lower and middle bands, which show a decrease in the selling pressure. The market volatility remains high as the distance between the lower and upper band diverged in the course of last month.</div>
<div style="text-align: justify;"> </div>
<div style="text-align: center;"><img alt="" src="/userfiles/images/Clipboard26%281%29.jpg" style="height:368px; width:800px" /></div>
<div style="text-align: justify;"> </div>
<div style="text-align: justify;"><span style="font-size:16px"><strong>Overview</strong></span></div>
<div style="text-align: justify;">The benchmark index declined by 75.06 points (or down 4.83%) to close at 1493.29 last month. The index is hovering below the 50 and 200-day moving average, giving a bearish signal. The MACD indicator has surpassed the signal line, which is a possible bullish trigger. However, both the lines continue to hover in the negative territory. RSI indicator closing at 48.45 level, giving a neutral stance. The Bollinger bands show a decrease in the selling pressure as the index moves close to the middle band. The new support and resistance level stands at 1420 and 1546 respectively. </div>
',
'status' => true,
'publish_date' => '0000-00-00',
'created' => '2017-12-14 11:04:21',
'modified' => '2017-12-14 11:24:37',
'keywords' => '',
'description' => '',
'sortorder' => '1939',
'feature_article' => true,
'user_id' => '11',
'image1' => null,
'image2' => null,
'image3' => null,
'image4' => null
),
'MagazineIssue' => array(
'id' => '980',
'image' => '20171210111009_Clipboard45.jpg',
'sortorder' => '1529',
'published' => true,
'created' => '2017-12-10 11:10:09',
'modified' => '2017-12-13 11:46:15',
'title' => 'December 2017',
'publish_date' => '2017-12-01',
'parent_id' => '0',
'homepage' => true,
'user_id' => '11'
),
'MagazineCategory' => array(
'id' => '63',
'title' => 'Stock Taking',
'sortorder' => '516',
'status' => true,
'created' => '0000-00-00 00:00:00',
'homepage' => true,
'modified' => '2013-04-01 00:00:00'
),
'User' => array(
'password' => '*****',
'id' => '11',
'user_detail_id' => '0',
'group_id' => '24',
'username' => 'nsingha@abhiyan.com.np',
'name' => '',
'email' => 'nsingha@abhiyan.com.np',
'address' => '',
'gender' => '',
'access' => '1',
'phone' => '',
'access_type' => '0',
'activated' => false,
'sortorder' => '0',
'published' => '0',
'created' => '2015-04-08 13:22:59',
'last_login' => '2023-04-16 09:29:47',
'ip' => '172.69.77.43'
),
'MagazineArticleComment' => array(),
'MagazineView' => array(
(int) 0 => array(
[maximum depth reached]
)
)
),
'current_user' => null,
'logged_in' => false
)
$magazineArticle = array(
'MagazineArticle' => array(
'id' => '1982',
'magazine_issue_id' => '980',
'magazine_category_id' => '63',
'title' => 'Monthly Technical Analysis of Nepse (22 October to 23 November 2017)',
'image' => null,
'short_content' => 'The benchmark index fell by 75.06 points (or down 4.83%) to close at 1493.29 last month. The index is hovering below the 50-day, as well as the 200-day moving average. This shows the market to be in a bearish mode in the course of last month.',
'content' => '<div style="text-align: justify;"><span style="font-size:18px"><strong>MACD above Signal Line </strong></span></div>
<div style="text-align: center;"><img alt="" src="/userfiles/images/Clipboard22%283%29.jpg" style="height:540px; width:800px" /></div>
<div style="text-align: center;"><img alt="" src="/userfiles/images/Clipboard21%284%29.jpg" style="height:410px; width:800px" /></div>
<div style="text-align: center;"> </div>
<div style="text-align: justify;"><span style="font-size:16px"><strong>Trend Analysis</strong></span></div>
<div style="text-align: justify;">The benchmark index fell by 75.06 points (or down 4.83%) to close at 1493.29 last month. The index is hovering below the 50-day, as well as the 200-day moving average. This shows the market to be in a bearish mode in the course of last month. Unsatisfactory first quarter reports of the BFIs further supported the bearish sentiment. The average volume turnover increased to NPR 48.45 crores from NPR 38.74 crores the month prior. </div>
<div style="text-align: justify;"> </div>
<div style="text-align: justify;"><span style="font-size:16px"><strong>Resistance and Support</strong></span></div>
<div style="text-align: center;"><img alt="" src="/userfiles/images/Clipboard23%284%29.jpg" style="height:354px; width:700px" /></div>
<div style="text-align: justify;">The Nepse index broke the immediate support level of 1480 and fell as low as 1460.73 towards the middle of last month. Currently the immediate support and resistance level stands at 1420 and 1546 respectively. Positive political environment should trigger a bullish sentiment in the coming weeks. </div>
<div style="text-align: justify;"> </div>
<div style="text-align: justify;"><span style="font-size:16px"><strong>Nepse Trend Indicator</strong></span></div>
<div style="text-align: justify;"><strong>a. MACD</strong></div>
<div style="text-align: justify;">The MACD is a momentum oscillator formed by using two different types of moving averages, which provides specific buying or selling signals. When a MACD line crosses above the signal line, it is considered to be a positive sign and indicates a time to buy, and vice-versa. </div>
<div style="text-align: justify;"> </div>
<div style="text-align: justify;">The MACD and the signal line, at the beginning of last month, stood at -4.83 and -13.67 respectively. In the course of the month, both the MACD and the signal line fell by 10.23 and 2.34 points to close at -15.07 and -16.01 respectively. MACD line crossing above the signal line indicates a bullish trigger. However, both the lines are in the negative territory, which still shows bearish presence in the market.</div>
<div style="text-align: justify;"> </div>
<div style="text-align: center;"><img alt="" src="/userfiles/images/Clipboard24%286%29.jpg" style="height:151px; width:800px" /></div>
<div style="text-align: justify;"> </div>
<div style="text-align: justify;"><strong>b. RSI</strong></div>
<div style="text-align: justify;">RSI is a form of leading indicator that is believed to be most effective during periods of sideways movement. Such indicators may create numerous buy and sell signals that are useful when the market is not clearly trending upwards or downwards. </div>
<div style="text-align: justify;"> </div>
<div style="text-align: justify;">The RSI, at the beginning of last month, stood at 57.48 level. In the course of the month, it lost 11.44 points to close at 46.04 level. The RSI fell as low as 25.08 towards the middle of the month, indicating high selling pressure in the market. Currently, the RSI shows a neutral stance. </div>
<div style="text-align: justify;"> </div>
<div style="text-align: center;"><img alt="" src="/userfiles/images/Clipboard25%284%29.jpg" style="height:145px; width:800px" /></div>
<div style="text-align: justify;"> </div>
<div style="text-align: justify;"><strong>c. Bollinger Bands</strong></div>
<div style="text-align: justify;">The Bollinger Band is a technical indicator that consists of a moving average (21-day) along with two trading bands above (upper band) and below it (lower band). The bands are an indication of volatility, which are represented by calculating standard deviation. </div>
<div style="text-align: justify;"> </div>
<div style="text-align: justify;">The benchmark index fell as low as the lower Bollinger band middle of last month, indicating high selling pressure in the market. However, towards the second half of the month, the index hovered between the lower and middle bands, which show a decrease in the selling pressure. The market volatility remains high as the distance between the lower and upper band diverged in the course of last month.</div>
<div style="text-align: justify;"> </div>
<div style="text-align: center;"><img alt="" src="/userfiles/images/Clipboard26%281%29.jpg" style="height:368px; width:800px" /></div>
<div style="text-align: justify;"> </div>
<div style="text-align: justify;"><span style="font-size:16px"><strong>Overview</strong></span></div>
<div style="text-align: justify;">The benchmark index declined by 75.06 points (or down 4.83%) to close at 1493.29 last month. The index is hovering below the 50 and 200-day moving average, giving a bearish signal. The MACD indicator has surpassed the signal line, which is a possible bullish trigger. However, both the lines continue to hover in the negative territory. RSI indicator closing at 48.45 level, giving a neutral stance. The Bollinger bands show a decrease in the selling pressure as the index moves close to the middle band. The new support and resistance level stands at 1420 and 1546 respectively. </div>
',
'status' => true,
'publish_date' => '0000-00-00',
'created' => '2017-12-14 11:04:21',
'modified' => '2017-12-14 11:24:37',
'keywords' => '',
'description' => '',
'sortorder' => '1939',
'feature_article' => true,
'user_id' => '11',
'image1' => null,
'image2' => null,
'image3' => null,
'image4' => null
),
'MagazineIssue' => array(
'id' => '980',
'image' => '20171210111009_Clipboard45.jpg',
'sortorder' => '1529',
'published' => true,
'created' => '2017-12-10 11:10:09',
'modified' => '2017-12-13 11:46:15',
'title' => 'December 2017',
'publish_date' => '2017-12-01',
'parent_id' => '0',
'homepage' => true,
'user_id' => '11'
),
'MagazineCategory' => array(
'id' => '63',
'title' => 'Stock Taking',
'sortorder' => '516',
'status' => true,
'created' => '0000-00-00 00:00:00',
'homepage' => true,
'modified' => '2013-04-01 00:00:00'
),
'User' => array(
'password' => '*****',
'id' => '11',
'user_detail_id' => '0',
'group_id' => '24',
'username' => 'nsingha@abhiyan.com.np',
'name' => '',
'email' => 'nsingha@abhiyan.com.np',
'address' => '',
'gender' => '',
'access' => '1',
'phone' => '',
'access_type' => '0',
'activated' => false,
'sortorder' => '0',
'published' => '0',
'created' => '2015-04-08 13:22:59',
'last_login' => '2023-04-16 09:29:47',
'ip' => '172.69.77.43'
),
'MagazineArticleComment' => array(),
'MagazineView' => array(
(int) 0 => array(
'magazine_article_id' => '1982',
'hit' => '3162'
)
)
)
$current_user = null
$logged_in = false
$user = null
include - APP/View/MagazineArticles/view.ctp, line 54
View::_evaluate() - CORE/Cake/View/View.php, line 971
View::_render() - CORE/Cake/View/View.php, line 933
View::render() - CORE/Cake/View/View.php, line 473
Controller::render() - CORE/Cake/Controller/Controller.php, line 968
Dispatcher::_invoke() - CORE/Cake/Routing/Dispatcher.php, line 200
Dispatcher::dispatch() - CORE/Cake/Routing/Dispatcher.php, line 167
[main] - APP/webroot/index.php, line 117
Notice (8): Trying to access array offset on value of type null [APP/View/MagazineArticles/view.ctp, line 55]Code Context //find the group of logged user
$groupId = $user['Group']['id'];
$user_id=$user["id"];
$viewFile = '/var/www/html/newbusinessage.com/app/View/MagazineArticles/view.ctp'
$dataForView = array(
'magazineArticle' => array(
'MagazineArticle' => array(
'id' => '1982',
'magazine_issue_id' => '980',
'magazine_category_id' => '63',
'title' => 'Monthly Technical Analysis of Nepse (22 October to 23 November 2017)',
'image' => null,
'short_content' => 'The benchmark index fell by 75.06 points (or down 4.83%) to close at 1493.29 last month. The index is hovering below the 50-day, as well as the 200-day moving average. This shows the market to be in a bearish mode in the course of last month.',
'content' => '<div style="text-align: justify;"><span style="font-size:18px"><strong>MACD above Signal Line </strong></span></div>
<div style="text-align: center;"><img alt="" src="/userfiles/images/Clipboard22%283%29.jpg" style="height:540px; width:800px" /></div>
<div style="text-align: center;"><img alt="" src="/userfiles/images/Clipboard21%284%29.jpg" style="height:410px; width:800px" /></div>
<div style="text-align: center;"> </div>
<div style="text-align: justify;"><span style="font-size:16px"><strong>Trend Analysis</strong></span></div>
<div style="text-align: justify;">The benchmark index fell by 75.06 points (or down 4.83%) to close at 1493.29 last month. The index is hovering below the 50-day, as well as the 200-day moving average. This shows the market to be in a bearish mode in the course of last month. Unsatisfactory first quarter reports of the BFIs further supported the bearish sentiment. The average volume turnover increased to NPR 48.45 crores from NPR 38.74 crores the month prior. </div>
<div style="text-align: justify;"> </div>
<div style="text-align: justify;"><span style="font-size:16px"><strong>Resistance and Support</strong></span></div>
<div style="text-align: center;"><img alt="" src="/userfiles/images/Clipboard23%284%29.jpg" style="height:354px; width:700px" /></div>
<div style="text-align: justify;">The Nepse index broke the immediate support level of 1480 and fell as low as 1460.73 towards the middle of last month. Currently the immediate support and resistance level stands at 1420 and 1546 respectively. Positive political environment should trigger a bullish sentiment in the coming weeks. </div>
<div style="text-align: justify;"> </div>
<div style="text-align: justify;"><span style="font-size:16px"><strong>Nepse Trend Indicator</strong></span></div>
<div style="text-align: justify;"><strong>a. MACD</strong></div>
<div style="text-align: justify;">The MACD is a momentum oscillator formed by using two different types of moving averages, which provides specific buying or selling signals. When a MACD line crosses above the signal line, it is considered to be a positive sign and indicates a time to buy, and vice-versa. </div>
<div style="text-align: justify;"> </div>
<div style="text-align: justify;">The MACD and the signal line, at the beginning of last month, stood at -4.83 and -13.67 respectively. In the course of the month, both the MACD and the signal line fell by 10.23 and 2.34 points to close at -15.07 and -16.01 respectively. MACD line crossing above the signal line indicates a bullish trigger. However, both the lines are in the negative territory, which still shows bearish presence in the market.</div>
<div style="text-align: justify;"> </div>
<div style="text-align: center;"><img alt="" src="/userfiles/images/Clipboard24%286%29.jpg" style="height:151px; width:800px" /></div>
<div style="text-align: justify;"> </div>
<div style="text-align: justify;"><strong>b. RSI</strong></div>
<div style="text-align: justify;">RSI is a form of leading indicator that is believed to be most effective during periods of sideways movement. Such indicators may create numerous buy and sell signals that are useful when the market is not clearly trending upwards or downwards. </div>
<div style="text-align: justify;"> </div>
<div style="text-align: justify;">The RSI, at the beginning of last month, stood at 57.48 level. In the course of the month, it lost 11.44 points to close at 46.04 level. The RSI fell as low as 25.08 towards the middle of the month, indicating high selling pressure in the market. Currently, the RSI shows a neutral stance. </div>
<div style="text-align: justify;"> </div>
<div style="text-align: center;"><img alt="" src="/userfiles/images/Clipboard25%284%29.jpg" style="height:145px; width:800px" /></div>
<div style="text-align: justify;"> </div>
<div style="text-align: justify;"><strong>c. Bollinger Bands</strong></div>
<div style="text-align: justify;">The Bollinger Band is a technical indicator that consists of a moving average (21-day) along with two trading bands above (upper band) and below it (lower band). The bands are an indication of volatility, which are represented by calculating standard deviation. </div>
<div style="text-align: justify;"> </div>
<div style="text-align: justify;">The benchmark index fell as low as the lower Bollinger band middle of last month, indicating high selling pressure in the market. However, towards the second half of the month, the index hovered between the lower and middle bands, which show a decrease in the selling pressure. The market volatility remains high as the distance between the lower and upper band diverged in the course of last month.</div>
<div style="text-align: justify;"> </div>
<div style="text-align: center;"><img alt="" src="/userfiles/images/Clipboard26%281%29.jpg" style="height:368px; width:800px" /></div>
<div style="text-align: justify;"> </div>
<div style="text-align: justify;"><span style="font-size:16px"><strong>Overview</strong></span></div>
<div style="text-align: justify;">The benchmark index declined by 75.06 points (or down 4.83%) to close at 1493.29 last month. The index is hovering below the 50 and 200-day moving average, giving a bearish signal. The MACD indicator has surpassed the signal line, which is a possible bullish trigger. However, both the lines continue to hover in the negative territory. RSI indicator closing at 48.45 level, giving a neutral stance. The Bollinger bands show a decrease in the selling pressure as the index moves close to the middle band. The new support and resistance level stands at 1420 and 1546 respectively. </div>
',
'status' => true,
'publish_date' => '0000-00-00',
'created' => '2017-12-14 11:04:21',
'modified' => '2017-12-14 11:24:37',
'keywords' => '',
'description' => '',
'sortorder' => '1939',
'feature_article' => true,
'user_id' => '11',
'image1' => null,
'image2' => null,
'image3' => null,
'image4' => null
),
'MagazineIssue' => array(
'id' => '980',
'image' => '20171210111009_Clipboard45.jpg',
'sortorder' => '1529',
'published' => true,
'created' => '2017-12-10 11:10:09',
'modified' => '2017-12-13 11:46:15',
'title' => 'December 2017',
'publish_date' => '2017-12-01',
'parent_id' => '0',
'homepage' => true,
'user_id' => '11'
),
'MagazineCategory' => array(
'id' => '63',
'title' => 'Stock Taking',
'sortorder' => '516',
'status' => true,
'created' => '0000-00-00 00:00:00',
'homepage' => true,
'modified' => '2013-04-01 00:00:00'
),
'User' => array(
'password' => '*****',
'id' => '11',
'user_detail_id' => '0',
'group_id' => '24',
'username' => 'nsingha@abhiyan.com.np',
'name' => '',
'email' => 'nsingha@abhiyan.com.np',
'address' => '',
'gender' => '',
'access' => '1',
'phone' => '',
'access_type' => '0',
'activated' => false,
'sortorder' => '0',
'published' => '0',
'created' => '2015-04-08 13:22:59',
'last_login' => '2023-04-16 09:29:47',
'ip' => '172.69.77.43'
),
'MagazineArticleComment' => array(),
'MagazineView' => array(
(int) 0 => array(
[maximum depth reached]
)
)
),
'current_user' => null,
'logged_in' => false
)
$magazineArticle = array(
'MagazineArticle' => array(
'id' => '1982',
'magazine_issue_id' => '980',
'magazine_category_id' => '63',
'title' => 'Monthly Technical Analysis of Nepse (22 October to 23 November 2017)',
'image' => null,
'short_content' => 'The benchmark index fell by 75.06 points (or down 4.83%) to close at 1493.29 last month. The index is hovering below the 50-day, as well as the 200-day moving average. This shows the market to be in a bearish mode in the course of last month.',
'content' => '<div style="text-align: justify;"><span style="font-size:18px"><strong>MACD above Signal Line </strong></span></div>
<div style="text-align: center;"><img alt="" src="/userfiles/images/Clipboard22%283%29.jpg" style="height:540px; width:800px" /></div>
<div style="text-align: center;"><img alt="" src="/userfiles/images/Clipboard21%284%29.jpg" style="height:410px; width:800px" /></div>
<div style="text-align: center;"> </div>
<div style="text-align: justify;"><span style="font-size:16px"><strong>Trend Analysis</strong></span></div>
<div style="text-align: justify;">The benchmark index fell by 75.06 points (or down 4.83%) to close at 1493.29 last month. The index is hovering below the 50-day, as well as the 200-day moving average. This shows the market to be in a bearish mode in the course of last month. Unsatisfactory first quarter reports of the BFIs further supported the bearish sentiment. The average volume turnover increased to NPR 48.45 crores from NPR 38.74 crores the month prior. </div>
<div style="text-align: justify;"> </div>
<div style="text-align: justify;"><span style="font-size:16px"><strong>Resistance and Support</strong></span></div>
<div style="text-align: center;"><img alt="" src="/userfiles/images/Clipboard23%284%29.jpg" style="height:354px; width:700px" /></div>
<div style="text-align: justify;">The Nepse index broke the immediate support level of 1480 and fell as low as 1460.73 towards the middle of last month. Currently the immediate support and resistance level stands at 1420 and 1546 respectively. Positive political environment should trigger a bullish sentiment in the coming weeks. </div>
<div style="text-align: justify;"> </div>
<div style="text-align: justify;"><span style="font-size:16px"><strong>Nepse Trend Indicator</strong></span></div>
<div style="text-align: justify;"><strong>a. MACD</strong></div>
<div style="text-align: justify;">The MACD is a momentum oscillator formed by using two different types of moving averages, which provides specific buying or selling signals. When a MACD line crosses above the signal line, it is considered to be a positive sign and indicates a time to buy, and vice-versa. </div>
<div style="text-align: justify;"> </div>
<div style="text-align: justify;">The MACD and the signal line, at the beginning of last month, stood at -4.83 and -13.67 respectively. In the course of the month, both the MACD and the signal line fell by 10.23 and 2.34 points to close at -15.07 and -16.01 respectively. MACD line crossing above the signal line indicates a bullish trigger. However, both the lines are in the negative territory, which still shows bearish presence in the market.</div>
<div style="text-align: justify;"> </div>
<div style="text-align: center;"><img alt="" src="/userfiles/images/Clipboard24%286%29.jpg" style="height:151px; width:800px" /></div>
<div style="text-align: justify;"> </div>
<div style="text-align: justify;"><strong>b. RSI</strong></div>
<div style="text-align: justify;">RSI is a form of leading indicator that is believed to be most effective during periods of sideways movement. Such indicators may create numerous buy and sell signals that are useful when the market is not clearly trending upwards or downwards. </div>
<div style="text-align: justify;"> </div>
<div style="text-align: justify;">The RSI, at the beginning of last month, stood at 57.48 level. In the course of the month, it lost 11.44 points to close at 46.04 level. The RSI fell as low as 25.08 towards the middle of the month, indicating high selling pressure in the market. Currently, the RSI shows a neutral stance. </div>
<div style="text-align: justify;"> </div>
<div style="text-align: center;"><img alt="" src="/userfiles/images/Clipboard25%284%29.jpg" style="height:145px; width:800px" /></div>
<div style="text-align: justify;"> </div>
<div style="text-align: justify;"><strong>c. Bollinger Bands</strong></div>
<div style="text-align: justify;">The Bollinger Band is a technical indicator that consists of a moving average (21-day) along with two trading bands above (upper band) and below it (lower band). The bands are an indication of volatility, which are represented by calculating standard deviation. </div>
<div style="text-align: justify;"> </div>
<div style="text-align: justify;">The benchmark index fell as low as the lower Bollinger band middle of last month, indicating high selling pressure in the market. However, towards the second half of the month, the index hovered between the lower and middle bands, which show a decrease in the selling pressure. The market volatility remains high as the distance between the lower and upper band diverged in the course of last month.</div>
<div style="text-align: justify;"> </div>
<div style="text-align: center;"><img alt="" src="/userfiles/images/Clipboard26%281%29.jpg" style="height:368px; width:800px" /></div>
<div style="text-align: justify;"> </div>
<div style="text-align: justify;"><span style="font-size:16px"><strong>Overview</strong></span></div>
<div style="text-align: justify;">The benchmark index declined by 75.06 points (or down 4.83%) to close at 1493.29 last month. The index is hovering below the 50 and 200-day moving average, giving a bearish signal. The MACD indicator has surpassed the signal line, which is a possible bullish trigger. However, both the lines continue to hover in the negative territory. RSI indicator closing at 48.45 level, giving a neutral stance. The Bollinger bands show a decrease in the selling pressure as the index moves close to the middle band. The new support and resistance level stands at 1420 and 1546 respectively. </div>
',
'status' => true,
'publish_date' => '0000-00-00',
'created' => '2017-12-14 11:04:21',
'modified' => '2017-12-14 11:24:37',
'keywords' => '',
'description' => '',
'sortorder' => '1939',
'feature_article' => true,
'user_id' => '11',
'image1' => null,
'image2' => null,
'image3' => null,
'image4' => null
),
'MagazineIssue' => array(
'id' => '980',
'image' => '20171210111009_Clipboard45.jpg',
'sortorder' => '1529',
'published' => true,
'created' => '2017-12-10 11:10:09',
'modified' => '2017-12-13 11:46:15',
'title' => 'December 2017',
'publish_date' => '2017-12-01',
'parent_id' => '0',
'homepage' => true,
'user_id' => '11'
),
'MagazineCategory' => array(
'id' => '63',
'title' => 'Stock Taking',
'sortorder' => '516',
'status' => true,
'created' => '0000-00-00 00:00:00',
'homepage' => true,
'modified' => '2013-04-01 00:00:00'
),
'User' => array(
'password' => '*****',
'id' => '11',
'user_detail_id' => '0',
'group_id' => '24',
'username' => 'nsingha@abhiyan.com.np',
'name' => '',
'email' => 'nsingha@abhiyan.com.np',
'address' => '',
'gender' => '',
'access' => '1',
'phone' => '',
'access_type' => '0',
'activated' => false,
'sortorder' => '0',
'published' => '0',
'created' => '2015-04-08 13:22:59',
'last_login' => '2023-04-16 09:29:47',
'ip' => '172.69.77.43'
),
'MagazineArticleComment' => array(),
'MagazineView' => array(
(int) 0 => array(
'magazine_article_id' => '1982',
'hit' => '3162'
)
)
)
$current_user = null
$logged_in = false
$user = null
$groupId = null
include - APP/View/MagazineArticles/view.ctp, line 55
View::_evaluate() - CORE/Cake/View/View.php, line 971
View::_render() - CORE/Cake/View/View.php, line 933
View::render() - CORE/Cake/View/View.php, line 473
Controller::render() - CORE/Cake/Controller/Controller.php, line 968
Dispatcher::_invoke() - CORE/Cake/Routing/Dispatcher.php, line 200
Dispatcher::dispatch() - CORE/Cake/Routing/Dispatcher.php, line 167
[main] - APP/webroot/index.php, line 117
Notice (8): Undefined index: summary [APP/View/MagazineArticles/view.ctp, line 62]Code Context<?php
echo $this->Html->meta(array('name' => 'description', 'type' => 'meta', 'content' => $magazineArticle['MagazineArticle']['summary']), null, array('inline' => false));?>
$viewFile = '/var/www/html/newbusinessage.com/app/View/MagazineArticles/view.ctp'
$dataForView = array(
'magazineArticle' => array(
'MagazineArticle' => array(
'id' => '1982',
'magazine_issue_id' => '980',
'magazine_category_id' => '63',
'title' => 'Monthly Technical Analysis of Nepse (22 October to 23 November 2017)',
'image' => null,
'short_content' => 'The benchmark index fell by 75.06 points (or down 4.83%) to close at 1493.29 last month. The index is hovering below the 50-day, as well as the 200-day moving average. This shows the market to be in a bearish mode in the course of last month.',
'content' => '<div style="text-align: justify;"><span style="font-size:18px"><strong>MACD above Signal Line </strong></span></div>
<div style="text-align: center;"><img alt="" src="/userfiles/images/Clipboard22%283%29.jpg" style="height:540px; width:800px" /></div>
<div style="text-align: center;"><img alt="" src="/userfiles/images/Clipboard21%284%29.jpg" style="height:410px; width:800px" /></div>
<div style="text-align: center;"> </div>
<div style="text-align: justify;"><span style="font-size:16px"><strong>Trend Analysis</strong></span></div>
<div style="text-align: justify;">The benchmark index fell by 75.06 points (or down 4.83%) to close at 1493.29 last month. The index is hovering below the 50-day, as well as the 200-day moving average. This shows the market to be in a bearish mode in the course of last month. Unsatisfactory first quarter reports of the BFIs further supported the bearish sentiment. The average volume turnover increased to NPR 48.45 crores from NPR 38.74 crores the month prior. </div>
<div style="text-align: justify;"> </div>
<div style="text-align: justify;"><span style="font-size:16px"><strong>Resistance and Support</strong></span></div>
<div style="text-align: center;"><img alt="" src="/userfiles/images/Clipboard23%284%29.jpg" style="height:354px; width:700px" /></div>
<div style="text-align: justify;">The Nepse index broke the immediate support level of 1480 and fell as low as 1460.73 towards the middle of last month. Currently the immediate support and resistance level stands at 1420 and 1546 respectively. Positive political environment should trigger a bullish sentiment in the coming weeks. </div>
<div style="text-align: justify;"> </div>
<div style="text-align: justify;"><span style="font-size:16px"><strong>Nepse Trend Indicator</strong></span></div>
<div style="text-align: justify;"><strong>a. MACD</strong></div>
<div style="text-align: justify;">The MACD is a momentum oscillator formed by using two different types of moving averages, which provides specific buying or selling signals. When a MACD line crosses above the signal line, it is considered to be a positive sign and indicates a time to buy, and vice-versa. </div>
<div style="text-align: justify;"> </div>
<div style="text-align: justify;">The MACD and the signal line, at the beginning of last month, stood at -4.83 and -13.67 respectively. In the course of the month, both the MACD and the signal line fell by 10.23 and 2.34 points to close at -15.07 and -16.01 respectively. MACD line crossing above the signal line indicates a bullish trigger. However, both the lines are in the negative territory, which still shows bearish presence in the market.</div>
<div style="text-align: justify;"> </div>
<div style="text-align: center;"><img alt="" src="/userfiles/images/Clipboard24%286%29.jpg" style="height:151px; width:800px" /></div>
<div style="text-align: justify;"> </div>
<div style="text-align: justify;"><strong>b. RSI</strong></div>
<div style="text-align: justify;">RSI is a form of leading indicator that is believed to be most effective during periods of sideways movement. Such indicators may create numerous buy and sell signals that are useful when the market is not clearly trending upwards or downwards. </div>
<div style="text-align: justify;"> </div>
<div style="text-align: justify;">The RSI, at the beginning of last month, stood at 57.48 level. In the course of the month, it lost 11.44 points to close at 46.04 level. The RSI fell as low as 25.08 towards the middle of the month, indicating high selling pressure in the market. Currently, the RSI shows a neutral stance. </div>
<div style="text-align: justify;"> </div>
<div style="text-align: center;"><img alt="" src="/userfiles/images/Clipboard25%284%29.jpg" style="height:145px; width:800px" /></div>
<div style="text-align: justify;"> </div>
<div style="text-align: justify;"><strong>c. Bollinger Bands</strong></div>
<div style="text-align: justify;">The Bollinger Band is a technical indicator that consists of a moving average (21-day) along with two trading bands above (upper band) and below it (lower band). The bands are an indication of volatility, which are represented by calculating standard deviation. </div>
<div style="text-align: justify;"> </div>
<div style="text-align: justify;">The benchmark index fell as low as the lower Bollinger band middle of last month, indicating high selling pressure in the market. However, towards the second half of the month, the index hovered between the lower and middle bands, which show a decrease in the selling pressure. The market volatility remains high as the distance between the lower and upper band diverged in the course of last month.</div>
<div style="text-align: justify;"> </div>
<div style="text-align: center;"><img alt="" src="/userfiles/images/Clipboard26%281%29.jpg" style="height:368px; width:800px" /></div>
<div style="text-align: justify;"> </div>
<div style="text-align: justify;"><span style="font-size:16px"><strong>Overview</strong></span></div>
<div style="text-align: justify;">The benchmark index declined by 75.06 points (or down 4.83%) to close at 1493.29 last month. The index is hovering below the 50 and 200-day moving average, giving a bearish signal. The MACD indicator has surpassed the signal line, which is a possible bullish trigger. However, both the lines continue to hover in the negative territory. RSI indicator closing at 48.45 level, giving a neutral stance. The Bollinger bands show a decrease in the selling pressure as the index moves close to the middle band. The new support and resistance level stands at 1420 and 1546 respectively. </div>
',
'status' => true,
'publish_date' => '0000-00-00',
'created' => '2017-12-14 11:04:21',
'modified' => '2017-12-14 11:24:37',
'keywords' => '',
'description' => '',
'sortorder' => '1939',
'feature_article' => true,
'user_id' => '11',
'image1' => null,
'image2' => null,
'image3' => null,
'image4' => null
),
'MagazineIssue' => array(
'id' => '980',
'image' => '20171210111009_Clipboard45.jpg',
'sortorder' => '1529',
'published' => true,
'created' => '2017-12-10 11:10:09',
'modified' => '2017-12-13 11:46:15',
'title' => 'December 2017',
'publish_date' => '2017-12-01',
'parent_id' => '0',
'homepage' => true,
'user_id' => '11'
),
'MagazineCategory' => array(
'id' => '63',
'title' => 'Stock Taking',
'sortorder' => '516',
'status' => true,
'created' => '0000-00-00 00:00:00',
'homepage' => true,
'modified' => '2013-04-01 00:00:00'
),
'User' => array(
'password' => '*****',
'id' => '11',
'user_detail_id' => '0',
'group_id' => '24',
'username' => 'nsingha@abhiyan.com.np',
'name' => '',
'email' => 'nsingha@abhiyan.com.np',
'address' => '',
'gender' => '',
'access' => '1',
'phone' => '',
'access_type' => '0',
'activated' => false,
'sortorder' => '0',
'published' => '0',
'created' => '2015-04-08 13:22:59',
'last_login' => '2023-04-16 09:29:47',
'ip' => '172.69.77.43'
),
'MagazineArticleComment' => array(),
'MagazineView' => array(
(int) 0 => array(
[maximum depth reached]
)
)
),
'current_user' => null,
'logged_in' => false
)
$magazineArticle = array(
'MagazineArticle' => array(
'id' => '1982',
'magazine_issue_id' => '980',
'magazine_category_id' => '63',
'title' => 'Monthly Technical Analysis of Nepse (22 October to 23 November 2017)',
'image' => null,
'short_content' => 'The benchmark index fell by 75.06 points (or down 4.83%) to close at 1493.29 last month. The index is hovering below the 50-day, as well as the 200-day moving average. This shows the market to be in a bearish mode in the course of last month.',
'content' => '<div style="text-align: justify;"><span style="font-size:18px"><strong>MACD above Signal Line </strong></span></div>
<div style="text-align: center;"><img alt="" src="/userfiles/images/Clipboard22%283%29.jpg" style="height:540px; width:800px" /></div>
<div style="text-align: center;"><img alt="" src="/userfiles/images/Clipboard21%284%29.jpg" style="height:410px; width:800px" /></div>
<div style="text-align: center;"> </div>
<div style="text-align: justify;"><span style="font-size:16px"><strong>Trend Analysis</strong></span></div>
<div style="text-align: justify;">The benchmark index fell by 75.06 points (or down 4.83%) to close at 1493.29 last month. The index is hovering below the 50-day, as well as the 200-day moving average. This shows the market to be in a bearish mode in the course of last month. Unsatisfactory first quarter reports of the BFIs further supported the bearish sentiment. The average volume turnover increased to NPR 48.45 crores from NPR 38.74 crores the month prior. </div>
<div style="text-align: justify;"> </div>
<div style="text-align: justify;"><span style="font-size:16px"><strong>Resistance and Support</strong></span></div>
<div style="text-align: center;"><img alt="" src="/userfiles/images/Clipboard23%284%29.jpg" style="height:354px; width:700px" /></div>
<div style="text-align: justify;">The Nepse index broke the immediate support level of 1480 and fell as low as 1460.73 towards the middle of last month. Currently the immediate support and resistance level stands at 1420 and 1546 respectively. Positive political environment should trigger a bullish sentiment in the coming weeks. </div>
<div style="text-align: justify;"> </div>
<div style="text-align: justify;"><span style="font-size:16px"><strong>Nepse Trend Indicator</strong></span></div>
<div style="text-align: justify;"><strong>a. MACD</strong></div>
<div style="text-align: justify;">The MACD is a momentum oscillator formed by using two different types of moving averages, which provides specific buying or selling signals. When a MACD line crosses above the signal line, it is considered to be a positive sign and indicates a time to buy, and vice-versa. </div>
<div style="text-align: justify;"> </div>
<div style="text-align: justify;">The MACD and the signal line, at the beginning of last month, stood at -4.83 and -13.67 respectively. In the course of the month, both the MACD and the signal line fell by 10.23 and 2.34 points to close at -15.07 and -16.01 respectively. MACD line crossing above the signal line indicates a bullish trigger. However, both the lines are in the negative territory, which still shows bearish presence in the market.</div>
<div style="text-align: justify;"> </div>
<div style="text-align: center;"><img alt="" src="/userfiles/images/Clipboard24%286%29.jpg" style="height:151px; width:800px" /></div>
<div style="text-align: justify;"> </div>
<div style="text-align: justify;"><strong>b. RSI</strong></div>
<div style="text-align: justify;">RSI is a form of leading indicator that is believed to be most effective during periods of sideways movement. Such indicators may create numerous buy and sell signals that are useful when the market is not clearly trending upwards or downwards. </div>
<div style="text-align: justify;"> </div>
<div style="text-align: justify;">The RSI, at the beginning of last month, stood at 57.48 level. In the course of the month, it lost 11.44 points to close at 46.04 level. The RSI fell as low as 25.08 towards the middle of the month, indicating high selling pressure in the market. Currently, the RSI shows a neutral stance. </div>
<div style="text-align: justify;"> </div>
<div style="text-align: center;"><img alt="" src="/userfiles/images/Clipboard25%284%29.jpg" style="height:145px; width:800px" /></div>
<div style="text-align: justify;"> </div>
<div style="text-align: justify;"><strong>c. Bollinger Bands</strong></div>
<div style="text-align: justify;">The Bollinger Band is a technical indicator that consists of a moving average (21-day) along with two trading bands above (upper band) and below it (lower band). The bands are an indication of volatility, which are represented by calculating standard deviation. </div>
<div style="text-align: justify;"> </div>
<div style="text-align: justify;">The benchmark index fell as low as the lower Bollinger band middle of last month, indicating high selling pressure in the market. However, towards the second half of the month, the index hovered between the lower and middle bands, which show a decrease in the selling pressure. The market volatility remains high as the distance between the lower and upper band diverged in the course of last month.</div>
<div style="text-align: justify;"> </div>
<div style="text-align: center;"><img alt="" src="/userfiles/images/Clipboard26%281%29.jpg" style="height:368px; width:800px" /></div>
<div style="text-align: justify;"> </div>
<div style="text-align: justify;"><span style="font-size:16px"><strong>Overview</strong></span></div>
<div style="text-align: justify;">The benchmark index declined by 75.06 points (or down 4.83%) to close at 1493.29 last month. The index is hovering below the 50 and 200-day moving average, giving a bearish signal. The MACD indicator has surpassed the signal line, which is a possible bullish trigger. However, both the lines continue to hover in the negative territory. RSI indicator closing at 48.45 level, giving a neutral stance. The Bollinger bands show a decrease in the selling pressure as the index moves close to the middle band. The new support and resistance level stands at 1420 and 1546 respectively. </div>
',
'status' => true,
'publish_date' => '0000-00-00',
'created' => '2017-12-14 11:04:21',
'modified' => '2017-12-14 11:24:37',
'keywords' => '',
'description' => '',
'sortorder' => '1939',
'feature_article' => true,
'user_id' => '11',
'image1' => null,
'image2' => null,
'image3' => null,
'image4' => null
),
'MagazineIssue' => array(
'id' => '980',
'image' => '20171210111009_Clipboard45.jpg',
'sortorder' => '1529',
'published' => true,
'created' => '2017-12-10 11:10:09',
'modified' => '2017-12-13 11:46:15',
'title' => 'December 2017',
'publish_date' => '2017-12-01',
'parent_id' => '0',
'homepage' => true,
'user_id' => '11'
),
'MagazineCategory' => array(
'id' => '63',
'title' => 'Stock Taking',
'sortorder' => '516',
'status' => true,
'created' => '0000-00-00 00:00:00',
'homepage' => true,
'modified' => '2013-04-01 00:00:00'
),
'User' => array(
'password' => '*****',
'id' => '11',
'user_detail_id' => '0',
'group_id' => '24',
'username' => 'nsingha@abhiyan.com.np',
'name' => '',
'email' => 'nsingha@abhiyan.com.np',
'address' => '',
'gender' => '',
'access' => '1',
'phone' => '',
'access_type' => '0',
'activated' => false,
'sortorder' => '0',
'published' => '0',
'created' => '2015-04-08 13:22:59',
'last_login' => '2023-04-16 09:29:47',
'ip' => '172.69.77.43'
),
'MagazineArticleComment' => array(),
'MagazineView' => array(
(int) 0 => array(
'magazine_article_id' => '1982',
'hit' => '3162'
)
)
)
$current_user = null
$logged_in = false
$user = null
$groupId = null
$user_id = null
include - APP/View/MagazineArticles/view.ctp, line 62
View::_evaluate() - CORE/Cake/View/View.php, line 971
View::_render() - CORE/Cake/View/View.php, line 933
View::render() - CORE/Cake/View/View.php, line 473
Controller::render() - CORE/Cake/Controller/Controller.php, line 968
Dispatcher::_invoke() - CORE/Cake/Routing/Dispatcher.php, line 200
Dispatcher::dispatch() - CORE/Cake/Routing/Dispatcher.php, line 167
[main] - APP/webroot/index.php, line 117
Notice (8): Undefined index: summary [APP/View/MagazineArticles/view.ctp, line 68]Code Context echo $this->Html->meta(array('property' => 'og:title', 'type' => 'meta', 'content' => $magazineArticle['MagazineArticle']['title']), null, array('inline' => false));?>
<?php
echo $this->Html->meta(array('property' => 'og:description', 'type' => 'meta', 'content' => $magazineArticle['MagazineArticle']['summary']), null, array('inline' => false));?>
$viewFile = '/var/www/html/newbusinessage.com/app/View/MagazineArticles/view.ctp'
$dataForView = array(
'magazineArticle' => array(
'MagazineArticle' => array(
'id' => '1982',
'magazine_issue_id' => '980',
'magazine_category_id' => '63',
'title' => 'Monthly Technical Analysis of Nepse (22 October to 23 November 2017)',
'image' => null,
'short_content' => 'The benchmark index fell by 75.06 points (or down 4.83%) to close at 1493.29 last month. The index is hovering below the 50-day, as well as the 200-day moving average. This shows the market to be in a bearish mode in the course of last month.',
'content' => '<div style="text-align: justify;"><span style="font-size:18px"><strong>MACD above Signal Line </strong></span></div>
<div style="text-align: center;"><img alt="" src="/userfiles/images/Clipboard22%283%29.jpg" style="height:540px; width:800px" /></div>
<div style="text-align: center;"><img alt="" src="/userfiles/images/Clipboard21%284%29.jpg" style="height:410px; width:800px" /></div>
<div style="text-align: center;"> </div>
<div style="text-align: justify;"><span style="font-size:16px"><strong>Trend Analysis</strong></span></div>
<div style="text-align: justify;">The benchmark index fell by 75.06 points (or down 4.83%) to close at 1493.29 last month. The index is hovering below the 50-day, as well as the 200-day moving average. This shows the market to be in a bearish mode in the course of last month. Unsatisfactory first quarter reports of the BFIs further supported the bearish sentiment. The average volume turnover increased to NPR 48.45 crores from NPR 38.74 crores the month prior. </div>
<div style="text-align: justify;"> </div>
<div style="text-align: justify;"><span style="font-size:16px"><strong>Resistance and Support</strong></span></div>
<div style="text-align: center;"><img alt="" src="/userfiles/images/Clipboard23%284%29.jpg" style="height:354px; width:700px" /></div>
<div style="text-align: justify;">The Nepse index broke the immediate support level of 1480 and fell as low as 1460.73 towards the middle of last month. Currently the immediate support and resistance level stands at 1420 and 1546 respectively. Positive political environment should trigger a bullish sentiment in the coming weeks. </div>
<div style="text-align: justify;"> </div>
<div style="text-align: justify;"><span style="font-size:16px"><strong>Nepse Trend Indicator</strong></span></div>
<div style="text-align: justify;"><strong>a. MACD</strong></div>
<div style="text-align: justify;">The MACD is a momentum oscillator formed by using two different types of moving averages, which provides specific buying or selling signals. When a MACD line crosses above the signal line, it is considered to be a positive sign and indicates a time to buy, and vice-versa. </div>
<div style="text-align: justify;"> </div>
<div style="text-align: justify;">The MACD and the signal line, at the beginning of last month, stood at -4.83 and -13.67 respectively. In the course of the month, both the MACD and the signal line fell by 10.23 and 2.34 points to close at -15.07 and -16.01 respectively. MACD line crossing above the signal line indicates a bullish trigger. However, both the lines are in the negative territory, which still shows bearish presence in the market.</div>
<div style="text-align: justify;"> </div>
<div style="text-align: center;"><img alt="" src="/userfiles/images/Clipboard24%286%29.jpg" style="height:151px; width:800px" /></div>
<div style="text-align: justify;"> </div>
<div style="text-align: justify;"><strong>b. RSI</strong></div>
<div style="text-align: justify;">RSI is a form of leading indicator that is believed to be most effective during periods of sideways movement. Such indicators may create numerous buy and sell signals that are useful when the market is not clearly trending upwards or downwards. </div>
<div style="text-align: justify;"> </div>
<div style="text-align: justify;">The RSI, at the beginning of last month, stood at 57.48 level. In the course of the month, it lost 11.44 points to close at 46.04 level. The RSI fell as low as 25.08 towards the middle of the month, indicating high selling pressure in the market. Currently, the RSI shows a neutral stance. </div>
<div style="text-align: justify;"> </div>
<div style="text-align: center;"><img alt="" src="/userfiles/images/Clipboard25%284%29.jpg" style="height:145px; width:800px" /></div>
<div style="text-align: justify;"> </div>
<div style="text-align: justify;"><strong>c. Bollinger Bands</strong></div>
<div style="text-align: justify;">The Bollinger Band is a technical indicator that consists of a moving average (21-day) along with two trading bands above (upper band) and below it (lower band). The bands are an indication of volatility, which are represented by calculating standard deviation. </div>
<div style="text-align: justify;"> </div>
<div style="text-align: justify;">The benchmark index fell as low as the lower Bollinger band middle of last month, indicating high selling pressure in the market. However, towards the second half of the month, the index hovered between the lower and middle bands, which show a decrease in the selling pressure. The market volatility remains high as the distance between the lower and upper band diverged in the course of last month.</div>
<div style="text-align: justify;"> </div>
<div style="text-align: center;"><img alt="" src="/userfiles/images/Clipboard26%281%29.jpg" style="height:368px; width:800px" /></div>
<div style="text-align: justify;"> </div>
<div style="text-align: justify;"><span style="font-size:16px"><strong>Overview</strong></span></div>
<div style="text-align: justify;">The benchmark index declined by 75.06 points (or down 4.83%) to close at 1493.29 last month. The index is hovering below the 50 and 200-day moving average, giving a bearish signal. The MACD indicator has surpassed the signal line, which is a possible bullish trigger. However, both the lines continue to hover in the negative territory. RSI indicator closing at 48.45 level, giving a neutral stance. The Bollinger bands show a decrease in the selling pressure as the index moves close to the middle band. The new support and resistance level stands at 1420 and 1546 respectively. </div>
',
'status' => true,
'publish_date' => '0000-00-00',
'created' => '2017-12-14 11:04:21',
'modified' => '2017-12-14 11:24:37',
'keywords' => '',
'description' => '',
'sortorder' => '1939',
'feature_article' => true,
'user_id' => '11',
'image1' => null,
'image2' => null,
'image3' => null,
'image4' => null
),
'MagazineIssue' => array(
'id' => '980',
'image' => '20171210111009_Clipboard45.jpg',
'sortorder' => '1529',
'published' => true,
'created' => '2017-12-10 11:10:09',
'modified' => '2017-12-13 11:46:15',
'title' => 'December 2017',
'publish_date' => '2017-12-01',
'parent_id' => '0',
'homepage' => true,
'user_id' => '11'
),
'MagazineCategory' => array(
'id' => '63',
'title' => 'Stock Taking',
'sortorder' => '516',
'status' => true,
'created' => '0000-00-00 00:00:00',
'homepage' => true,
'modified' => '2013-04-01 00:00:00'
),
'User' => array(
'password' => '*****',
'id' => '11',
'user_detail_id' => '0',
'group_id' => '24',
'username' => 'nsingha@abhiyan.com.np',
'name' => '',
'email' => 'nsingha@abhiyan.com.np',
'address' => '',
'gender' => '',
'access' => '1',
'phone' => '',
'access_type' => '0',
'activated' => false,
'sortorder' => '0',
'published' => '0',
'created' => '2015-04-08 13:22:59',
'last_login' => '2023-04-16 09:29:47',
'ip' => '172.69.77.43'
),
'MagazineArticleComment' => array(),
'MagazineView' => array(
(int) 0 => array(
[maximum depth reached]
)
)
),
'current_user' => null,
'logged_in' => false
)
$magazineArticle = array(
'MagazineArticle' => array(
'id' => '1982',
'magazine_issue_id' => '980',
'magazine_category_id' => '63',
'title' => 'Monthly Technical Analysis of Nepse (22 October to 23 November 2017)',
'image' => null,
'short_content' => 'The benchmark index fell by 75.06 points (or down 4.83%) to close at 1493.29 last month. The index is hovering below the 50-day, as well as the 200-day moving average. This shows the market to be in a bearish mode in the course of last month.',
'content' => '<div style="text-align: justify;"><span style="font-size:18px"><strong>MACD above Signal Line </strong></span></div>
<div style="text-align: center;"><img alt="" src="/userfiles/images/Clipboard22%283%29.jpg" style="height:540px; width:800px" /></div>
<div style="text-align: center;"><img alt="" src="/userfiles/images/Clipboard21%284%29.jpg" style="height:410px; width:800px" /></div>
<div style="text-align: center;"> </div>
<div style="text-align: justify;"><span style="font-size:16px"><strong>Trend Analysis</strong></span></div>
<div style="text-align: justify;">The benchmark index fell by 75.06 points (or down 4.83%) to close at 1493.29 last month. The index is hovering below the 50-day, as well as the 200-day moving average. This shows the market to be in a bearish mode in the course of last month. Unsatisfactory first quarter reports of the BFIs further supported the bearish sentiment. The average volume turnover increased to NPR 48.45 crores from NPR 38.74 crores the month prior. </div>
<div style="text-align: justify;"> </div>
<div style="text-align: justify;"><span style="font-size:16px"><strong>Resistance and Support</strong></span></div>
<div style="text-align: center;"><img alt="" src="/userfiles/images/Clipboard23%284%29.jpg" style="height:354px; width:700px" /></div>
<div style="text-align: justify;">The Nepse index broke the immediate support level of 1480 and fell as low as 1460.73 towards the middle of last month. Currently the immediate support and resistance level stands at 1420 and 1546 respectively. Positive political environment should trigger a bullish sentiment in the coming weeks. </div>
<div style="text-align: justify;"> </div>
<div style="text-align: justify;"><span style="font-size:16px"><strong>Nepse Trend Indicator</strong></span></div>
<div style="text-align: justify;"><strong>a. MACD</strong></div>
<div style="text-align: justify;">The MACD is a momentum oscillator formed by using two different types of moving averages, which provides specific buying or selling signals. When a MACD line crosses above the signal line, it is considered to be a positive sign and indicates a time to buy, and vice-versa. </div>
<div style="text-align: justify;"> </div>
<div style="text-align: justify;">The MACD and the signal line, at the beginning of last month, stood at -4.83 and -13.67 respectively. In the course of the month, both the MACD and the signal line fell by 10.23 and 2.34 points to close at -15.07 and -16.01 respectively. MACD line crossing above the signal line indicates a bullish trigger. However, both the lines are in the negative territory, which still shows bearish presence in the market.</div>
<div style="text-align: justify;"> </div>
<div style="text-align: center;"><img alt="" src="/userfiles/images/Clipboard24%286%29.jpg" style="height:151px; width:800px" /></div>
<div style="text-align: justify;"> </div>
<div style="text-align: justify;"><strong>b. RSI</strong></div>
<div style="text-align: justify;">RSI is a form of leading indicator that is believed to be most effective during periods of sideways movement. Such indicators may create numerous buy and sell signals that are useful when the market is not clearly trending upwards or downwards. </div>
<div style="text-align: justify;"> </div>
<div style="text-align: justify;">The RSI, at the beginning of last month, stood at 57.48 level. In the course of the month, it lost 11.44 points to close at 46.04 level. The RSI fell as low as 25.08 towards the middle of the month, indicating high selling pressure in the market. Currently, the RSI shows a neutral stance. </div>
<div style="text-align: justify;"> </div>
<div style="text-align: center;"><img alt="" src="/userfiles/images/Clipboard25%284%29.jpg" style="height:145px; width:800px" /></div>
<div style="text-align: justify;"> </div>
<div style="text-align: justify;"><strong>c. Bollinger Bands</strong></div>
<div style="text-align: justify;">The Bollinger Band is a technical indicator that consists of a moving average (21-day) along with two trading bands above (upper band) and below it (lower band). The bands are an indication of volatility, which are represented by calculating standard deviation. </div>
<div style="text-align: justify;"> </div>
<div style="text-align: justify;">The benchmark index fell as low as the lower Bollinger band middle of last month, indicating high selling pressure in the market. However, towards the second half of the month, the index hovered between the lower and middle bands, which show a decrease in the selling pressure. The market volatility remains high as the distance between the lower and upper band diverged in the course of last month.</div>
<div style="text-align: justify;"> </div>
<div style="text-align: center;"><img alt="" src="/userfiles/images/Clipboard26%281%29.jpg" style="height:368px; width:800px" /></div>
<div style="text-align: justify;"> </div>
<div style="text-align: justify;"><span style="font-size:16px"><strong>Overview</strong></span></div>
<div style="text-align: justify;">The benchmark index declined by 75.06 points (or down 4.83%) to close at 1493.29 last month. The index is hovering below the 50 and 200-day moving average, giving a bearish signal. The MACD indicator has surpassed the signal line, which is a possible bullish trigger. However, both the lines continue to hover in the negative territory. RSI indicator closing at 48.45 level, giving a neutral stance. The Bollinger bands show a decrease in the selling pressure as the index moves close to the middle band. The new support and resistance level stands at 1420 and 1546 respectively. </div>
',
'status' => true,
'publish_date' => '0000-00-00',
'created' => '2017-12-14 11:04:21',
'modified' => '2017-12-14 11:24:37',
'keywords' => '',
'description' => '',
'sortorder' => '1939',
'feature_article' => true,
'user_id' => '11',
'image1' => null,
'image2' => null,
'image3' => null,
'image4' => null
),
'MagazineIssue' => array(
'id' => '980',
'image' => '20171210111009_Clipboard45.jpg',
'sortorder' => '1529',
'published' => true,
'created' => '2017-12-10 11:10:09',
'modified' => '2017-12-13 11:46:15',
'title' => 'December 2017',
'publish_date' => '2017-12-01',
'parent_id' => '0',
'homepage' => true,
'user_id' => '11'
),
'MagazineCategory' => array(
'id' => '63',
'title' => 'Stock Taking',
'sortorder' => '516',
'status' => true,
'created' => '0000-00-00 00:00:00',
'homepage' => true,
'modified' => '2013-04-01 00:00:00'
),
'User' => array(
'password' => '*****',
'id' => '11',
'user_detail_id' => '0',
'group_id' => '24',
'username' => 'nsingha@abhiyan.com.np',
'name' => '',
'email' => 'nsingha@abhiyan.com.np',
'address' => '',
'gender' => '',
'access' => '1',
'phone' => '',
'access_type' => '0',
'activated' => false,
'sortorder' => '0',
'published' => '0',
'created' => '2015-04-08 13:22:59',
'last_login' => '2023-04-16 09:29:47',
'ip' => '172.69.77.43'
),
'MagazineArticleComment' => array(),
'MagazineView' => array(
(int) 0 => array(
'magazine_article_id' => '1982',
'hit' => '3162'
)
)
)
$current_user = null
$logged_in = false
$user = null
$groupId = null
$user_id = null
include - APP/View/MagazineArticles/view.ctp, line 68
View::_evaluate() - CORE/Cake/View/View.php, line 971
View::_render() - CORE/Cake/View/View.php, line 933
View::render() - CORE/Cake/View/View.php, line 473
Controller::render() - CORE/Cake/Controller/Controller.php, line 968
Dispatcher::_invoke() - CORE/Cake/Routing/Dispatcher.php, line 200
Dispatcher::dispatch() - CORE/Cake/Routing/Dispatcher.php, line 167
[main] - APP/webroot/index.php, line 117
Monthly Technical Analysis of Nepse (22 October to 23 November 2017)
MACD above Signal Line
Trend Analysis
The benchmark index fell by 75.06 points (or down 4.83%) to close at 1493.29 last month. The index is hovering below the 50-day, as well as the 200-day moving average. This shows the market to be in a bearish mode in the course of last month. Unsatisfactory first quarter reports of the BFIs further supported the bearish sentiment. The average volume turnover increased to NPR 48.45 crores from NPR 38.74 crores the month prior.
Resistance and Support
The Nepse index broke the immediate support level of 1480 and fell as low as 1460.73 towards the middle of last month. Currently the immediate support and resistance level stands at 1420 and 1546 respectively. Positive political environment should trigger a bullish sentiment in the coming weeks.
Nepse Trend Indicator
a. MACD
The MACD is a momentum oscillator formed by using two different types of moving averages, which provides specific buying or selling signals. When a MACD line crosses above the signal line, it is considered to be a positive sign and indicates a time to buy, and vice-versa.
The MACD and the signal line, at the beginning of last month, stood at -4.83 and -13.67 respectively. In the course of the month, both the MACD and the signal line fell by 10.23 and 2.34 points to close at -15.07 and -16.01 respectively. MACD line crossing above the signal line indicates a bullish trigger. However, both the lines are in the negative territory, which still shows bearish presence in the market.
b. RSI
RSI is a form of leading indicator that is believed to be most effective during periods of sideways movement. Such indicators may create numerous buy and sell signals that are useful when the market is not clearly trending upwards or downwards.
The RSI, at the beginning of last month, stood at 57.48 level. In the course of the month, it lost 11.44 points to close at 46.04 level. The RSI fell as low as 25.08 towards the middle of the month, indicating high selling pressure in the market. Currently, the RSI shows a neutral stance.
c. Bollinger Bands
The Bollinger Band is a technical indicator that consists of a moving average (21-day) along with two trading bands above (upper band) and below it (lower band). The bands are an indication of volatility, which are represented by calculating standard deviation.
The benchmark index fell as low as the lower Bollinger band middle of last month, indicating high selling pressure in the market. However, towards the second half of the month, the index hovered between the lower and middle bands, which show a decrease in the selling pressure. The market volatility remains high as the distance between the lower and upper band diverged in the course of last month.
Overview
The benchmark index declined by 75.06 points (or down 4.83%) to close at 1493.29 last month. The index is hovering below the 50 and 200-day moving average, giving a bearish signal. The MACD indicator has surpassed the signal line, which is a possible bullish trigger. However, both the lines continue to hover in the negative territory. RSI indicator closing at 48.45 level, giving a neutral stance. The Bollinger bands show a decrease in the selling pressure as the index moves close to the middle band. The new support and resistance level stands at 1420 and 1546 respectively.