Notice (8): Trying to access array offset on value of type null [APP/View/MagazineArticles/view.ctp, line 54]Code Context $user = $this->Session->read('Auth.User');
//find the group of logged user
$groupId = $user['Group']['id'];
$viewFile = '/var/www/html/newbusinessage.com/app/View/MagazineArticles/view.ctp'
$dataForView = array(
'magazineArticle' => array(
'MagazineArticle' => array(
'id' => '2035',
'magazine_issue_id' => '982',
'magazine_category_id' => '63',
'title' => 'Monthly Technical Analysis of Nepse (24 December 2017 to 22 January 2018)',
'image' => null,
'short_content' => 'The benchmark index fell by 70.06 points (or down 4.75%) to close at 1402.09 last month. The index continued to move below the 50-day and the 200-day moving average, indicating a bearish momentum in the market. The market will likely remain bearish as the banks continue to face liquidity crunch.',
'content' => '<p style="text-align:justify"><span style="font-size:24px"><strong>Liquidity Crunch Effect</strong></span></p>
<p style="text-align:center"><span style="font-size:24px"><strong><img alt="" src="/userfiles/images/Clipboard39%285%29.jpg" /></strong></span></p>
<p style="text-align:center"><span style="font-size:24px"><strong><img alt="" src="/userfiles/images/Clipboard38%288%29.jpg" style="height:410px; width:800px" /></strong></span></p>
<p style="text-align:justify"><span style="font-size:16px"><strong>Trend Analysis</strong></span><br />
The benchmark index fell by 70.06 points (or down 4.75%) to close at 1402.09 last month. The index continued to move below the 50-day and the 200-day moving average, indicating a bearish momentum in the market. The market will likely remain bearish as the banks continue to face liquidity crunch. The average volume turnover decreased to NPR 50.92 crores from NPR 60.69 crores the month prior. </p>
<p style="text-align:justify"><span style="font-size:16px"><strong>Resistance and Support</strong></span></p>
<p style="text-align:justify"><span style="font-size:16px"><strong><img alt="" src="/userfiles/images/Clipboard40%286%29.jpg" style="height:380px; width:750px" /></strong></span></p>
<p style="text-align:justify">The Nepse index broke the support level of 1420 towards the middle of last month. The new support and resistance level now stands at 1390 and 1464 respectively. As bearish sentiment looms over the market, the index will likely test the support level in the coming weeks. </p>
<p style="text-align:justify"><span style="font-size:16px"><strong>Nepse Trend Indicator</strong></span><br />
<strong>a. MACD</strong><br />
The MACD is a momentum oscillator formed by using two different types of moving averages, which provides specific buying or selling signals. When a MACD line crosses above the signal line, it is considered to be a positive sign and indicates a time to buy, and vice-versa. </p>
<p style="text-align: center;"><img alt="" src="/userfiles/images/Clipboard41%285%29.jpg" style="height:151px; width:800px" /></p>
<p style="text-align:justify">The MACD and the signal line, at the beginning of last month, stood at -8.23 and -2.54 respectively. In the course of the month, both the macd and the signal line decreased by 12.98 and 17.54 points to close at -21.21 and -20.08 respectively. Both the lines moving in the negative territory shows bearish sentiment in the market. The macd line continues to move below the signal line, which further supports the bearish trigger. </p>
<p style="text-align:justify"><strong>b. RSI</strong><br />
RSI is a form of leading indicator that is believed to be most effective during periods of sideways movement. Such indicators may create numerous buy and sell signals that are useful when the market is not clearly trending upwards or downwards. </p>
<p style="text-align: center;"><img alt="" src="/userfiles/images/Clipboard43%287%29.jpg" style="height:145px; width:800px" /></p>
<p style="text-align:justify">The RSI, at the beginning of last month, stood at 33.43 level. In the course of the month, it gained 1.31 points to close at 34.74 level. The RSI fell as low as 19.19 level towards the middle of the month, signifying high selling pressure in the market. The RSI hovering at 30’s zone shows oversold condition.</p>
<p style="text-align:justify"><strong>c. Bollinger Bands</strong><br />
The Bollinger Band is a technical indicator that consists of a moving average (21-day) along with two trading bands above (upper band) and below it (lower band). The bands are an indication of volatility, which are represented by calculating standard deviation. </p>
<p style="text-align:justify">The benchmark index hovered close to the lower Bollinger band for majority of last month. Such movement signifies presence of selling pressure in the market. The distance between the upper and lower bands has diverged, indicating a rise in market volatility over the course of last month.</p>
<p style="text-align: center;"><img alt="" src="/userfiles/images/Clipboard44%283%29.jpg" /></p>
<p style="text-align:justify"><span style="font-size:16px"><strong>Overview</strong></span><br />
The benchmark index declined by 70.06 points (or down 4.75%) to close at 1402.09 last month. The index is hovering below the 50 and 200-day moving average, giving a bearish signal. The macd indicator has moved below the signal line, and both the lines are hovering in the negative territory. Such indication gives bearish sentiment of the market. The RSI closed at 34.74 level, which also signifies selling pressure. The bollinger bands indicate a rise in market volatility due to divergence between the upper and lower bands. The new support and resistance level stands at 1390 and 1464 level respectively. </p>
',
'status' => true,
'publish_date' => '0000-00-00',
'created' => '2018-02-11 11:02:21',
'modified' => '2018-02-11 11:10:58',
'keywords' => '',
'description' => '',
'sortorder' => '1993',
'feature_article' => true,
'user_id' => '11',
'image1' => null,
'image2' => null,
'image3' => null,
'image4' => null
),
'MagazineIssue' => array(
'id' => '982',
'image' => '20180205103708_cover.jpg',
'sortorder' => '1531',
'published' => true,
'created' => '2018-02-05 10:37:08',
'modified' => '2018-02-05 11:37:37',
'title' => 'February 2018',
'publish_date' => '2018-02-01',
'parent_id' => '0',
'homepage' => true,
'user_id' => '11'
),
'MagazineCategory' => array(
'id' => '63',
'title' => 'Stock Taking',
'sortorder' => '516',
'status' => true,
'created' => '0000-00-00 00:00:00',
'homepage' => true,
'modified' => '2013-04-01 00:00:00'
),
'User' => array(
'password' => '*****',
'id' => '11',
'user_detail_id' => '0',
'group_id' => '24',
'username' => 'nsingha@abhiyan.com.np',
'name' => '',
'email' => 'nsingha@abhiyan.com.np',
'address' => '',
'gender' => '',
'access' => '1',
'phone' => '',
'access_type' => '0',
'activated' => false,
'sortorder' => '0',
'published' => '0',
'created' => '2015-04-08 13:22:59',
'last_login' => '2023-04-16 09:29:47',
'ip' => '172.69.77.43'
),
'MagazineArticleComment' => array(),
'MagazineView' => array(
(int) 0 => array(
[maximum depth reached]
)
)
),
'current_user' => null,
'logged_in' => false
)
$magazineArticle = array(
'MagazineArticle' => array(
'id' => '2035',
'magazine_issue_id' => '982',
'magazine_category_id' => '63',
'title' => 'Monthly Technical Analysis of Nepse (24 December 2017 to 22 January 2018)',
'image' => null,
'short_content' => 'The benchmark index fell by 70.06 points (or down 4.75%) to close at 1402.09 last month. The index continued to move below the 50-day and the 200-day moving average, indicating a bearish momentum in the market. The market will likely remain bearish as the banks continue to face liquidity crunch.',
'content' => '<p style="text-align:justify"><span style="font-size:24px"><strong>Liquidity Crunch Effect</strong></span></p>
<p style="text-align:center"><span style="font-size:24px"><strong><img alt="" src="/userfiles/images/Clipboard39%285%29.jpg" /></strong></span></p>
<p style="text-align:center"><span style="font-size:24px"><strong><img alt="" src="/userfiles/images/Clipboard38%288%29.jpg" style="height:410px; width:800px" /></strong></span></p>
<p style="text-align:justify"><span style="font-size:16px"><strong>Trend Analysis</strong></span><br />
The benchmark index fell by 70.06 points (or down 4.75%) to close at 1402.09 last month. The index continued to move below the 50-day and the 200-day moving average, indicating a bearish momentum in the market. The market will likely remain bearish as the banks continue to face liquidity crunch. The average volume turnover decreased to NPR 50.92 crores from NPR 60.69 crores the month prior. </p>
<p style="text-align:justify"><span style="font-size:16px"><strong>Resistance and Support</strong></span></p>
<p style="text-align:justify"><span style="font-size:16px"><strong><img alt="" src="/userfiles/images/Clipboard40%286%29.jpg" style="height:380px; width:750px" /></strong></span></p>
<p style="text-align:justify">The Nepse index broke the support level of 1420 towards the middle of last month. The new support and resistance level now stands at 1390 and 1464 respectively. As bearish sentiment looms over the market, the index will likely test the support level in the coming weeks. </p>
<p style="text-align:justify"><span style="font-size:16px"><strong>Nepse Trend Indicator</strong></span><br />
<strong>a. MACD</strong><br />
The MACD is a momentum oscillator formed by using two different types of moving averages, which provides specific buying or selling signals. When a MACD line crosses above the signal line, it is considered to be a positive sign and indicates a time to buy, and vice-versa. </p>
<p style="text-align: center;"><img alt="" src="/userfiles/images/Clipboard41%285%29.jpg" style="height:151px; width:800px" /></p>
<p style="text-align:justify">The MACD and the signal line, at the beginning of last month, stood at -8.23 and -2.54 respectively. In the course of the month, both the macd and the signal line decreased by 12.98 and 17.54 points to close at -21.21 and -20.08 respectively. Both the lines moving in the negative territory shows bearish sentiment in the market. The macd line continues to move below the signal line, which further supports the bearish trigger. </p>
<p style="text-align:justify"><strong>b. RSI</strong><br />
RSI is a form of leading indicator that is believed to be most effective during periods of sideways movement. Such indicators may create numerous buy and sell signals that are useful when the market is not clearly trending upwards or downwards. </p>
<p style="text-align: center;"><img alt="" src="/userfiles/images/Clipboard43%287%29.jpg" style="height:145px; width:800px" /></p>
<p style="text-align:justify">The RSI, at the beginning of last month, stood at 33.43 level. In the course of the month, it gained 1.31 points to close at 34.74 level. The RSI fell as low as 19.19 level towards the middle of the month, signifying high selling pressure in the market. The RSI hovering at 30’s zone shows oversold condition.</p>
<p style="text-align:justify"><strong>c. Bollinger Bands</strong><br />
The Bollinger Band is a technical indicator that consists of a moving average (21-day) along with two trading bands above (upper band) and below it (lower band). The bands are an indication of volatility, which are represented by calculating standard deviation. </p>
<p style="text-align:justify">The benchmark index hovered close to the lower Bollinger band for majority of last month. Such movement signifies presence of selling pressure in the market. The distance between the upper and lower bands has diverged, indicating a rise in market volatility over the course of last month.</p>
<p style="text-align: center;"><img alt="" src="/userfiles/images/Clipboard44%283%29.jpg" /></p>
<p style="text-align:justify"><span style="font-size:16px"><strong>Overview</strong></span><br />
The benchmark index declined by 70.06 points (or down 4.75%) to close at 1402.09 last month. The index is hovering below the 50 and 200-day moving average, giving a bearish signal. The macd indicator has moved below the signal line, and both the lines are hovering in the negative territory. Such indication gives bearish sentiment of the market. The RSI closed at 34.74 level, which also signifies selling pressure. The bollinger bands indicate a rise in market volatility due to divergence between the upper and lower bands. The new support and resistance level stands at 1390 and 1464 level respectively. </p>
',
'status' => true,
'publish_date' => '0000-00-00',
'created' => '2018-02-11 11:02:21',
'modified' => '2018-02-11 11:10:58',
'keywords' => '',
'description' => '',
'sortorder' => '1993',
'feature_article' => true,
'user_id' => '11',
'image1' => null,
'image2' => null,
'image3' => null,
'image4' => null
),
'MagazineIssue' => array(
'id' => '982',
'image' => '20180205103708_cover.jpg',
'sortorder' => '1531',
'published' => true,
'created' => '2018-02-05 10:37:08',
'modified' => '2018-02-05 11:37:37',
'title' => 'February 2018',
'publish_date' => '2018-02-01',
'parent_id' => '0',
'homepage' => true,
'user_id' => '11'
),
'MagazineCategory' => array(
'id' => '63',
'title' => 'Stock Taking',
'sortorder' => '516',
'status' => true,
'created' => '0000-00-00 00:00:00',
'homepage' => true,
'modified' => '2013-04-01 00:00:00'
),
'User' => array(
'password' => '*****',
'id' => '11',
'user_detail_id' => '0',
'group_id' => '24',
'username' => 'nsingha@abhiyan.com.np',
'name' => '',
'email' => 'nsingha@abhiyan.com.np',
'address' => '',
'gender' => '',
'access' => '1',
'phone' => '',
'access_type' => '0',
'activated' => false,
'sortorder' => '0',
'published' => '0',
'created' => '2015-04-08 13:22:59',
'last_login' => '2023-04-16 09:29:47',
'ip' => '172.69.77.43'
),
'MagazineArticleComment' => array(),
'MagazineView' => array(
(int) 0 => array(
'magazine_article_id' => '2035',
'hit' => '3249'
)
)
)
$current_user = null
$logged_in = false
$user = null
include - APP/View/MagazineArticles/view.ctp, line 54
View::_evaluate() - CORE/Cake/View/View.php, line 971
View::_render() - CORE/Cake/View/View.php, line 933
View::render() - CORE/Cake/View/View.php, line 473
Controller::render() - CORE/Cake/Controller/Controller.php, line 968
Dispatcher::_invoke() - CORE/Cake/Routing/Dispatcher.php, line 200
Dispatcher::dispatch() - CORE/Cake/Routing/Dispatcher.php, line 167
[main] - APP/webroot/index.php, line 117
Notice (8): Trying to access array offset on value of type null [APP/View/MagazineArticles/view.ctp, line 55]Code Context //find the group of logged user
$groupId = $user['Group']['id'];
$user_id=$user["id"];
$viewFile = '/var/www/html/newbusinessage.com/app/View/MagazineArticles/view.ctp'
$dataForView = array(
'magazineArticle' => array(
'MagazineArticle' => array(
'id' => '2035',
'magazine_issue_id' => '982',
'magazine_category_id' => '63',
'title' => 'Monthly Technical Analysis of Nepse (24 December 2017 to 22 January 2018)',
'image' => null,
'short_content' => 'The benchmark index fell by 70.06 points (or down 4.75%) to close at 1402.09 last month. The index continued to move below the 50-day and the 200-day moving average, indicating a bearish momentum in the market. The market will likely remain bearish as the banks continue to face liquidity crunch.',
'content' => '<p style="text-align:justify"><span style="font-size:24px"><strong>Liquidity Crunch Effect</strong></span></p>
<p style="text-align:center"><span style="font-size:24px"><strong><img alt="" src="/userfiles/images/Clipboard39%285%29.jpg" /></strong></span></p>
<p style="text-align:center"><span style="font-size:24px"><strong><img alt="" src="/userfiles/images/Clipboard38%288%29.jpg" style="height:410px; width:800px" /></strong></span></p>
<p style="text-align:justify"><span style="font-size:16px"><strong>Trend Analysis</strong></span><br />
The benchmark index fell by 70.06 points (or down 4.75%) to close at 1402.09 last month. The index continued to move below the 50-day and the 200-day moving average, indicating a bearish momentum in the market. The market will likely remain bearish as the banks continue to face liquidity crunch. The average volume turnover decreased to NPR 50.92 crores from NPR 60.69 crores the month prior. </p>
<p style="text-align:justify"><span style="font-size:16px"><strong>Resistance and Support</strong></span></p>
<p style="text-align:justify"><span style="font-size:16px"><strong><img alt="" src="/userfiles/images/Clipboard40%286%29.jpg" style="height:380px; width:750px" /></strong></span></p>
<p style="text-align:justify">The Nepse index broke the support level of 1420 towards the middle of last month. The new support and resistance level now stands at 1390 and 1464 respectively. As bearish sentiment looms over the market, the index will likely test the support level in the coming weeks. </p>
<p style="text-align:justify"><span style="font-size:16px"><strong>Nepse Trend Indicator</strong></span><br />
<strong>a. MACD</strong><br />
The MACD is a momentum oscillator formed by using two different types of moving averages, which provides specific buying or selling signals. When a MACD line crosses above the signal line, it is considered to be a positive sign and indicates a time to buy, and vice-versa. </p>
<p style="text-align: center;"><img alt="" src="/userfiles/images/Clipboard41%285%29.jpg" style="height:151px; width:800px" /></p>
<p style="text-align:justify">The MACD and the signal line, at the beginning of last month, stood at -8.23 and -2.54 respectively. In the course of the month, both the macd and the signal line decreased by 12.98 and 17.54 points to close at -21.21 and -20.08 respectively. Both the lines moving in the negative territory shows bearish sentiment in the market. The macd line continues to move below the signal line, which further supports the bearish trigger. </p>
<p style="text-align:justify"><strong>b. RSI</strong><br />
RSI is a form of leading indicator that is believed to be most effective during periods of sideways movement. Such indicators may create numerous buy and sell signals that are useful when the market is not clearly trending upwards or downwards. </p>
<p style="text-align: center;"><img alt="" src="/userfiles/images/Clipboard43%287%29.jpg" style="height:145px; width:800px" /></p>
<p style="text-align:justify">The RSI, at the beginning of last month, stood at 33.43 level. In the course of the month, it gained 1.31 points to close at 34.74 level. The RSI fell as low as 19.19 level towards the middle of the month, signifying high selling pressure in the market. The RSI hovering at 30’s zone shows oversold condition.</p>
<p style="text-align:justify"><strong>c. Bollinger Bands</strong><br />
The Bollinger Band is a technical indicator that consists of a moving average (21-day) along with two trading bands above (upper band) and below it (lower band). The bands are an indication of volatility, which are represented by calculating standard deviation. </p>
<p style="text-align:justify">The benchmark index hovered close to the lower Bollinger band for majority of last month. Such movement signifies presence of selling pressure in the market. The distance between the upper and lower bands has diverged, indicating a rise in market volatility over the course of last month.</p>
<p style="text-align: center;"><img alt="" src="/userfiles/images/Clipboard44%283%29.jpg" /></p>
<p style="text-align:justify"><span style="font-size:16px"><strong>Overview</strong></span><br />
The benchmark index declined by 70.06 points (or down 4.75%) to close at 1402.09 last month. The index is hovering below the 50 and 200-day moving average, giving a bearish signal. The macd indicator has moved below the signal line, and both the lines are hovering in the negative territory. Such indication gives bearish sentiment of the market. The RSI closed at 34.74 level, which also signifies selling pressure. The bollinger bands indicate a rise in market volatility due to divergence between the upper and lower bands. The new support and resistance level stands at 1390 and 1464 level respectively. </p>
',
'status' => true,
'publish_date' => '0000-00-00',
'created' => '2018-02-11 11:02:21',
'modified' => '2018-02-11 11:10:58',
'keywords' => '',
'description' => '',
'sortorder' => '1993',
'feature_article' => true,
'user_id' => '11',
'image1' => null,
'image2' => null,
'image3' => null,
'image4' => null
),
'MagazineIssue' => array(
'id' => '982',
'image' => '20180205103708_cover.jpg',
'sortorder' => '1531',
'published' => true,
'created' => '2018-02-05 10:37:08',
'modified' => '2018-02-05 11:37:37',
'title' => 'February 2018',
'publish_date' => '2018-02-01',
'parent_id' => '0',
'homepage' => true,
'user_id' => '11'
),
'MagazineCategory' => array(
'id' => '63',
'title' => 'Stock Taking',
'sortorder' => '516',
'status' => true,
'created' => '0000-00-00 00:00:00',
'homepage' => true,
'modified' => '2013-04-01 00:00:00'
),
'User' => array(
'password' => '*****',
'id' => '11',
'user_detail_id' => '0',
'group_id' => '24',
'username' => 'nsingha@abhiyan.com.np',
'name' => '',
'email' => 'nsingha@abhiyan.com.np',
'address' => '',
'gender' => '',
'access' => '1',
'phone' => '',
'access_type' => '0',
'activated' => false,
'sortorder' => '0',
'published' => '0',
'created' => '2015-04-08 13:22:59',
'last_login' => '2023-04-16 09:29:47',
'ip' => '172.69.77.43'
),
'MagazineArticleComment' => array(),
'MagazineView' => array(
(int) 0 => array(
[maximum depth reached]
)
)
),
'current_user' => null,
'logged_in' => false
)
$magazineArticle = array(
'MagazineArticle' => array(
'id' => '2035',
'magazine_issue_id' => '982',
'magazine_category_id' => '63',
'title' => 'Monthly Technical Analysis of Nepse (24 December 2017 to 22 January 2018)',
'image' => null,
'short_content' => 'The benchmark index fell by 70.06 points (or down 4.75%) to close at 1402.09 last month. The index continued to move below the 50-day and the 200-day moving average, indicating a bearish momentum in the market. The market will likely remain bearish as the banks continue to face liquidity crunch.',
'content' => '<p style="text-align:justify"><span style="font-size:24px"><strong>Liquidity Crunch Effect</strong></span></p>
<p style="text-align:center"><span style="font-size:24px"><strong><img alt="" src="/userfiles/images/Clipboard39%285%29.jpg" /></strong></span></p>
<p style="text-align:center"><span style="font-size:24px"><strong><img alt="" src="/userfiles/images/Clipboard38%288%29.jpg" style="height:410px; width:800px" /></strong></span></p>
<p style="text-align:justify"><span style="font-size:16px"><strong>Trend Analysis</strong></span><br />
The benchmark index fell by 70.06 points (or down 4.75%) to close at 1402.09 last month. The index continued to move below the 50-day and the 200-day moving average, indicating a bearish momentum in the market. The market will likely remain bearish as the banks continue to face liquidity crunch. The average volume turnover decreased to NPR 50.92 crores from NPR 60.69 crores the month prior. </p>
<p style="text-align:justify"><span style="font-size:16px"><strong>Resistance and Support</strong></span></p>
<p style="text-align:justify"><span style="font-size:16px"><strong><img alt="" src="/userfiles/images/Clipboard40%286%29.jpg" style="height:380px; width:750px" /></strong></span></p>
<p style="text-align:justify">The Nepse index broke the support level of 1420 towards the middle of last month. The new support and resistance level now stands at 1390 and 1464 respectively. As bearish sentiment looms over the market, the index will likely test the support level in the coming weeks. </p>
<p style="text-align:justify"><span style="font-size:16px"><strong>Nepse Trend Indicator</strong></span><br />
<strong>a. MACD</strong><br />
The MACD is a momentum oscillator formed by using two different types of moving averages, which provides specific buying or selling signals. When a MACD line crosses above the signal line, it is considered to be a positive sign and indicates a time to buy, and vice-versa. </p>
<p style="text-align: center;"><img alt="" src="/userfiles/images/Clipboard41%285%29.jpg" style="height:151px; width:800px" /></p>
<p style="text-align:justify">The MACD and the signal line, at the beginning of last month, stood at -8.23 and -2.54 respectively. In the course of the month, both the macd and the signal line decreased by 12.98 and 17.54 points to close at -21.21 and -20.08 respectively. Both the lines moving in the negative territory shows bearish sentiment in the market. The macd line continues to move below the signal line, which further supports the bearish trigger. </p>
<p style="text-align:justify"><strong>b. RSI</strong><br />
RSI is a form of leading indicator that is believed to be most effective during periods of sideways movement. Such indicators may create numerous buy and sell signals that are useful when the market is not clearly trending upwards or downwards. </p>
<p style="text-align: center;"><img alt="" src="/userfiles/images/Clipboard43%287%29.jpg" style="height:145px; width:800px" /></p>
<p style="text-align:justify">The RSI, at the beginning of last month, stood at 33.43 level. In the course of the month, it gained 1.31 points to close at 34.74 level. The RSI fell as low as 19.19 level towards the middle of the month, signifying high selling pressure in the market. The RSI hovering at 30’s zone shows oversold condition.</p>
<p style="text-align:justify"><strong>c. Bollinger Bands</strong><br />
The Bollinger Band is a technical indicator that consists of a moving average (21-day) along with two trading bands above (upper band) and below it (lower band). The bands are an indication of volatility, which are represented by calculating standard deviation. </p>
<p style="text-align:justify">The benchmark index hovered close to the lower Bollinger band for majority of last month. Such movement signifies presence of selling pressure in the market. The distance between the upper and lower bands has diverged, indicating a rise in market volatility over the course of last month.</p>
<p style="text-align: center;"><img alt="" src="/userfiles/images/Clipboard44%283%29.jpg" /></p>
<p style="text-align:justify"><span style="font-size:16px"><strong>Overview</strong></span><br />
The benchmark index declined by 70.06 points (or down 4.75%) to close at 1402.09 last month. The index is hovering below the 50 and 200-day moving average, giving a bearish signal. The macd indicator has moved below the signal line, and both the lines are hovering in the negative territory. Such indication gives bearish sentiment of the market. The RSI closed at 34.74 level, which also signifies selling pressure. The bollinger bands indicate a rise in market volatility due to divergence between the upper and lower bands. The new support and resistance level stands at 1390 and 1464 level respectively. </p>
',
'status' => true,
'publish_date' => '0000-00-00',
'created' => '2018-02-11 11:02:21',
'modified' => '2018-02-11 11:10:58',
'keywords' => '',
'description' => '',
'sortorder' => '1993',
'feature_article' => true,
'user_id' => '11',
'image1' => null,
'image2' => null,
'image3' => null,
'image4' => null
),
'MagazineIssue' => array(
'id' => '982',
'image' => '20180205103708_cover.jpg',
'sortorder' => '1531',
'published' => true,
'created' => '2018-02-05 10:37:08',
'modified' => '2018-02-05 11:37:37',
'title' => 'February 2018',
'publish_date' => '2018-02-01',
'parent_id' => '0',
'homepage' => true,
'user_id' => '11'
),
'MagazineCategory' => array(
'id' => '63',
'title' => 'Stock Taking',
'sortorder' => '516',
'status' => true,
'created' => '0000-00-00 00:00:00',
'homepage' => true,
'modified' => '2013-04-01 00:00:00'
),
'User' => array(
'password' => '*****',
'id' => '11',
'user_detail_id' => '0',
'group_id' => '24',
'username' => 'nsingha@abhiyan.com.np',
'name' => '',
'email' => 'nsingha@abhiyan.com.np',
'address' => '',
'gender' => '',
'access' => '1',
'phone' => '',
'access_type' => '0',
'activated' => false,
'sortorder' => '0',
'published' => '0',
'created' => '2015-04-08 13:22:59',
'last_login' => '2023-04-16 09:29:47',
'ip' => '172.69.77.43'
),
'MagazineArticleComment' => array(),
'MagazineView' => array(
(int) 0 => array(
'magazine_article_id' => '2035',
'hit' => '3249'
)
)
)
$current_user = null
$logged_in = false
$user = null
$groupId = null
include - APP/View/MagazineArticles/view.ctp, line 55
View::_evaluate() - CORE/Cake/View/View.php, line 971
View::_render() - CORE/Cake/View/View.php, line 933
View::render() - CORE/Cake/View/View.php, line 473
Controller::render() - CORE/Cake/Controller/Controller.php, line 968
Dispatcher::_invoke() - CORE/Cake/Routing/Dispatcher.php, line 200
Dispatcher::dispatch() - CORE/Cake/Routing/Dispatcher.php, line 167
[main] - APP/webroot/index.php, line 117
Notice (8): Undefined index: summary [APP/View/MagazineArticles/view.ctp, line 62]Code Context<?php
echo $this->Html->meta(array('name' => 'description', 'type' => 'meta', 'content' => $magazineArticle['MagazineArticle']['summary']), null, array('inline' => false));?>
$viewFile = '/var/www/html/newbusinessage.com/app/View/MagazineArticles/view.ctp'
$dataForView = array(
'magazineArticle' => array(
'MagazineArticle' => array(
'id' => '2035',
'magazine_issue_id' => '982',
'magazine_category_id' => '63',
'title' => 'Monthly Technical Analysis of Nepse (24 December 2017 to 22 January 2018)',
'image' => null,
'short_content' => 'The benchmark index fell by 70.06 points (or down 4.75%) to close at 1402.09 last month. The index continued to move below the 50-day and the 200-day moving average, indicating a bearish momentum in the market. The market will likely remain bearish as the banks continue to face liquidity crunch.',
'content' => '<p style="text-align:justify"><span style="font-size:24px"><strong>Liquidity Crunch Effect</strong></span></p>
<p style="text-align:center"><span style="font-size:24px"><strong><img alt="" src="/userfiles/images/Clipboard39%285%29.jpg" /></strong></span></p>
<p style="text-align:center"><span style="font-size:24px"><strong><img alt="" src="/userfiles/images/Clipboard38%288%29.jpg" style="height:410px; width:800px" /></strong></span></p>
<p style="text-align:justify"><span style="font-size:16px"><strong>Trend Analysis</strong></span><br />
The benchmark index fell by 70.06 points (or down 4.75%) to close at 1402.09 last month. The index continued to move below the 50-day and the 200-day moving average, indicating a bearish momentum in the market. The market will likely remain bearish as the banks continue to face liquidity crunch. The average volume turnover decreased to NPR 50.92 crores from NPR 60.69 crores the month prior. </p>
<p style="text-align:justify"><span style="font-size:16px"><strong>Resistance and Support</strong></span></p>
<p style="text-align:justify"><span style="font-size:16px"><strong><img alt="" src="/userfiles/images/Clipboard40%286%29.jpg" style="height:380px; width:750px" /></strong></span></p>
<p style="text-align:justify">The Nepse index broke the support level of 1420 towards the middle of last month. The new support and resistance level now stands at 1390 and 1464 respectively. As bearish sentiment looms over the market, the index will likely test the support level in the coming weeks. </p>
<p style="text-align:justify"><span style="font-size:16px"><strong>Nepse Trend Indicator</strong></span><br />
<strong>a. MACD</strong><br />
The MACD is a momentum oscillator formed by using two different types of moving averages, which provides specific buying or selling signals. When a MACD line crosses above the signal line, it is considered to be a positive sign and indicates a time to buy, and vice-versa. </p>
<p style="text-align: center;"><img alt="" src="/userfiles/images/Clipboard41%285%29.jpg" style="height:151px; width:800px" /></p>
<p style="text-align:justify">The MACD and the signal line, at the beginning of last month, stood at -8.23 and -2.54 respectively. In the course of the month, both the macd and the signal line decreased by 12.98 and 17.54 points to close at -21.21 and -20.08 respectively. Both the lines moving in the negative territory shows bearish sentiment in the market. The macd line continues to move below the signal line, which further supports the bearish trigger. </p>
<p style="text-align:justify"><strong>b. RSI</strong><br />
RSI is a form of leading indicator that is believed to be most effective during periods of sideways movement. Such indicators may create numerous buy and sell signals that are useful when the market is not clearly trending upwards or downwards. </p>
<p style="text-align: center;"><img alt="" src="/userfiles/images/Clipboard43%287%29.jpg" style="height:145px; width:800px" /></p>
<p style="text-align:justify">The RSI, at the beginning of last month, stood at 33.43 level. In the course of the month, it gained 1.31 points to close at 34.74 level. The RSI fell as low as 19.19 level towards the middle of the month, signifying high selling pressure in the market. The RSI hovering at 30’s zone shows oversold condition.</p>
<p style="text-align:justify"><strong>c. Bollinger Bands</strong><br />
The Bollinger Band is a technical indicator that consists of a moving average (21-day) along with two trading bands above (upper band) and below it (lower band). The bands are an indication of volatility, which are represented by calculating standard deviation. </p>
<p style="text-align:justify">The benchmark index hovered close to the lower Bollinger band for majority of last month. Such movement signifies presence of selling pressure in the market. The distance between the upper and lower bands has diverged, indicating a rise in market volatility over the course of last month.</p>
<p style="text-align: center;"><img alt="" src="/userfiles/images/Clipboard44%283%29.jpg" /></p>
<p style="text-align:justify"><span style="font-size:16px"><strong>Overview</strong></span><br />
The benchmark index declined by 70.06 points (or down 4.75%) to close at 1402.09 last month. The index is hovering below the 50 and 200-day moving average, giving a bearish signal. The macd indicator has moved below the signal line, and both the lines are hovering in the negative territory. Such indication gives bearish sentiment of the market. The RSI closed at 34.74 level, which also signifies selling pressure. The bollinger bands indicate a rise in market volatility due to divergence between the upper and lower bands. The new support and resistance level stands at 1390 and 1464 level respectively. </p>
',
'status' => true,
'publish_date' => '0000-00-00',
'created' => '2018-02-11 11:02:21',
'modified' => '2018-02-11 11:10:58',
'keywords' => '',
'description' => '',
'sortorder' => '1993',
'feature_article' => true,
'user_id' => '11',
'image1' => null,
'image2' => null,
'image3' => null,
'image4' => null
),
'MagazineIssue' => array(
'id' => '982',
'image' => '20180205103708_cover.jpg',
'sortorder' => '1531',
'published' => true,
'created' => '2018-02-05 10:37:08',
'modified' => '2018-02-05 11:37:37',
'title' => 'February 2018',
'publish_date' => '2018-02-01',
'parent_id' => '0',
'homepage' => true,
'user_id' => '11'
),
'MagazineCategory' => array(
'id' => '63',
'title' => 'Stock Taking',
'sortorder' => '516',
'status' => true,
'created' => '0000-00-00 00:00:00',
'homepage' => true,
'modified' => '2013-04-01 00:00:00'
),
'User' => array(
'password' => '*****',
'id' => '11',
'user_detail_id' => '0',
'group_id' => '24',
'username' => 'nsingha@abhiyan.com.np',
'name' => '',
'email' => 'nsingha@abhiyan.com.np',
'address' => '',
'gender' => '',
'access' => '1',
'phone' => '',
'access_type' => '0',
'activated' => false,
'sortorder' => '0',
'published' => '0',
'created' => '2015-04-08 13:22:59',
'last_login' => '2023-04-16 09:29:47',
'ip' => '172.69.77.43'
),
'MagazineArticleComment' => array(),
'MagazineView' => array(
(int) 0 => array(
[maximum depth reached]
)
)
),
'current_user' => null,
'logged_in' => false
)
$magazineArticle = array(
'MagazineArticle' => array(
'id' => '2035',
'magazine_issue_id' => '982',
'magazine_category_id' => '63',
'title' => 'Monthly Technical Analysis of Nepse (24 December 2017 to 22 January 2018)',
'image' => null,
'short_content' => 'The benchmark index fell by 70.06 points (or down 4.75%) to close at 1402.09 last month. The index continued to move below the 50-day and the 200-day moving average, indicating a bearish momentum in the market. The market will likely remain bearish as the banks continue to face liquidity crunch.',
'content' => '<p style="text-align:justify"><span style="font-size:24px"><strong>Liquidity Crunch Effect</strong></span></p>
<p style="text-align:center"><span style="font-size:24px"><strong><img alt="" src="/userfiles/images/Clipboard39%285%29.jpg" /></strong></span></p>
<p style="text-align:center"><span style="font-size:24px"><strong><img alt="" src="/userfiles/images/Clipboard38%288%29.jpg" style="height:410px; width:800px" /></strong></span></p>
<p style="text-align:justify"><span style="font-size:16px"><strong>Trend Analysis</strong></span><br />
The benchmark index fell by 70.06 points (or down 4.75%) to close at 1402.09 last month. The index continued to move below the 50-day and the 200-day moving average, indicating a bearish momentum in the market. The market will likely remain bearish as the banks continue to face liquidity crunch. The average volume turnover decreased to NPR 50.92 crores from NPR 60.69 crores the month prior. </p>
<p style="text-align:justify"><span style="font-size:16px"><strong>Resistance and Support</strong></span></p>
<p style="text-align:justify"><span style="font-size:16px"><strong><img alt="" src="/userfiles/images/Clipboard40%286%29.jpg" style="height:380px; width:750px" /></strong></span></p>
<p style="text-align:justify">The Nepse index broke the support level of 1420 towards the middle of last month. The new support and resistance level now stands at 1390 and 1464 respectively. As bearish sentiment looms over the market, the index will likely test the support level in the coming weeks. </p>
<p style="text-align:justify"><span style="font-size:16px"><strong>Nepse Trend Indicator</strong></span><br />
<strong>a. MACD</strong><br />
The MACD is a momentum oscillator formed by using two different types of moving averages, which provides specific buying or selling signals. When a MACD line crosses above the signal line, it is considered to be a positive sign and indicates a time to buy, and vice-versa. </p>
<p style="text-align: center;"><img alt="" src="/userfiles/images/Clipboard41%285%29.jpg" style="height:151px; width:800px" /></p>
<p style="text-align:justify">The MACD and the signal line, at the beginning of last month, stood at -8.23 and -2.54 respectively. In the course of the month, both the macd and the signal line decreased by 12.98 and 17.54 points to close at -21.21 and -20.08 respectively. Both the lines moving in the negative territory shows bearish sentiment in the market. The macd line continues to move below the signal line, which further supports the bearish trigger. </p>
<p style="text-align:justify"><strong>b. RSI</strong><br />
RSI is a form of leading indicator that is believed to be most effective during periods of sideways movement. Such indicators may create numerous buy and sell signals that are useful when the market is not clearly trending upwards or downwards. </p>
<p style="text-align: center;"><img alt="" src="/userfiles/images/Clipboard43%287%29.jpg" style="height:145px; width:800px" /></p>
<p style="text-align:justify">The RSI, at the beginning of last month, stood at 33.43 level. In the course of the month, it gained 1.31 points to close at 34.74 level. The RSI fell as low as 19.19 level towards the middle of the month, signifying high selling pressure in the market. The RSI hovering at 30’s zone shows oversold condition.</p>
<p style="text-align:justify"><strong>c. Bollinger Bands</strong><br />
The Bollinger Band is a technical indicator that consists of a moving average (21-day) along with two trading bands above (upper band) and below it (lower band). The bands are an indication of volatility, which are represented by calculating standard deviation. </p>
<p style="text-align:justify">The benchmark index hovered close to the lower Bollinger band for majority of last month. Such movement signifies presence of selling pressure in the market. The distance between the upper and lower bands has diverged, indicating a rise in market volatility over the course of last month.</p>
<p style="text-align: center;"><img alt="" src="/userfiles/images/Clipboard44%283%29.jpg" /></p>
<p style="text-align:justify"><span style="font-size:16px"><strong>Overview</strong></span><br />
The benchmark index declined by 70.06 points (or down 4.75%) to close at 1402.09 last month. The index is hovering below the 50 and 200-day moving average, giving a bearish signal. The macd indicator has moved below the signal line, and both the lines are hovering in the negative territory. Such indication gives bearish sentiment of the market. The RSI closed at 34.74 level, which also signifies selling pressure. The bollinger bands indicate a rise in market volatility due to divergence between the upper and lower bands. The new support and resistance level stands at 1390 and 1464 level respectively. </p>
',
'status' => true,
'publish_date' => '0000-00-00',
'created' => '2018-02-11 11:02:21',
'modified' => '2018-02-11 11:10:58',
'keywords' => '',
'description' => '',
'sortorder' => '1993',
'feature_article' => true,
'user_id' => '11',
'image1' => null,
'image2' => null,
'image3' => null,
'image4' => null
),
'MagazineIssue' => array(
'id' => '982',
'image' => '20180205103708_cover.jpg',
'sortorder' => '1531',
'published' => true,
'created' => '2018-02-05 10:37:08',
'modified' => '2018-02-05 11:37:37',
'title' => 'February 2018',
'publish_date' => '2018-02-01',
'parent_id' => '0',
'homepage' => true,
'user_id' => '11'
),
'MagazineCategory' => array(
'id' => '63',
'title' => 'Stock Taking',
'sortorder' => '516',
'status' => true,
'created' => '0000-00-00 00:00:00',
'homepage' => true,
'modified' => '2013-04-01 00:00:00'
),
'User' => array(
'password' => '*****',
'id' => '11',
'user_detail_id' => '0',
'group_id' => '24',
'username' => 'nsingha@abhiyan.com.np',
'name' => '',
'email' => 'nsingha@abhiyan.com.np',
'address' => '',
'gender' => '',
'access' => '1',
'phone' => '',
'access_type' => '0',
'activated' => false,
'sortorder' => '0',
'published' => '0',
'created' => '2015-04-08 13:22:59',
'last_login' => '2023-04-16 09:29:47',
'ip' => '172.69.77.43'
),
'MagazineArticleComment' => array(),
'MagazineView' => array(
(int) 0 => array(
'magazine_article_id' => '2035',
'hit' => '3249'
)
)
)
$current_user = null
$logged_in = false
$user = null
$groupId = null
$user_id = null
include - APP/View/MagazineArticles/view.ctp, line 62
View::_evaluate() - CORE/Cake/View/View.php, line 971
View::_render() - CORE/Cake/View/View.php, line 933
View::render() - CORE/Cake/View/View.php, line 473
Controller::render() - CORE/Cake/Controller/Controller.php, line 968
Dispatcher::_invoke() - CORE/Cake/Routing/Dispatcher.php, line 200
Dispatcher::dispatch() - CORE/Cake/Routing/Dispatcher.php, line 167
[main] - APP/webroot/index.php, line 117
Notice (8): Undefined index: summary [APP/View/MagazineArticles/view.ctp, line 68]Code Context echo $this->Html->meta(array('property' => 'og:title', 'type' => 'meta', 'content' => $magazineArticle['MagazineArticle']['title']), null, array('inline' => false));?>
<?php
echo $this->Html->meta(array('property' => 'og:description', 'type' => 'meta', 'content' => $magazineArticle['MagazineArticle']['summary']), null, array('inline' => false));?>
$viewFile = '/var/www/html/newbusinessage.com/app/View/MagazineArticles/view.ctp'
$dataForView = array(
'magazineArticle' => array(
'MagazineArticle' => array(
'id' => '2035',
'magazine_issue_id' => '982',
'magazine_category_id' => '63',
'title' => 'Monthly Technical Analysis of Nepse (24 December 2017 to 22 January 2018)',
'image' => null,
'short_content' => 'The benchmark index fell by 70.06 points (or down 4.75%) to close at 1402.09 last month. The index continued to move below the 50-day and the 200-day moving average, indicating a bearish momentum in the market. The market will likely remain bearish as the banks continue to face liquidity crunch.',
'content' => '<p style="text-align:justify"><span style="font-size:24px"><strong>Liquidity Crunch Effect</strong></span></p>
<p style="text-align:center"><span style="font-size:24px"><strong><img alt="" src="/userfiles/images/Clipboard39%285%29.jpg" /></strong></span></p>
<p style="text-align:center"><span style="font-size:24px"><strong><img alt="" src="/userfiles/images/Clipboard38%288%29.jpg" style="height:410px; width:800px" /></strong></span></p>
<p style="text-align:justify"><span style="font-size:16px"><strong>Trend Analysis</strong></span><br />
The benchmark index fell by 70.06 points (or down 4.75%) to close at 1402.09 last month. The index continued to move below the 50-day and the 200-day moving average, indicating a bearish momentum in the market. The market will likely remain bearish as the banks continue to face liquidity crunch. The average volume turnover decreased to NPR 50.92 crores from NPR 60.69 crores the month prior. </p>
<p style="text-align:justify"><span style="font-size:16px"><strong>Resistance and Support</strong></span></p>
<p style="text-align:justify"><span style="font-size:16px"><strong><img alt="" src="/userfiles/images/Clipboard40%286%29.jpg" style="height:380px; width:750px" /></strong></span></p>
<p style="text-align:justify">The Nepse index broke the support level of 1420 towards the middle of last month. The new support and resistance level now stands at 1390 and 1464 respectively. As bearish sentiment looms over the market, the index will likely test the support level in the coming weeks. </p>
<p style="text-align:justify"><span style="font-size:16px"><strong>Nepse Trend Indicator</strong></span><br />
<strong>a. MACD</strong><br />
The MACD is a momentum oscillator formed by using two different types of moving averages, which provides specific buying or selling signals. When a MACD line crosses above the signal line, it is considered to be a positive sign and indicates a time to buy, and vice-versa. </p>
<p style="text-align: center;"><img alt="" src="/userfiles/images/Clipboard41%285%29.jpg" style="height:151px; width:800px" /></p>
<p style="text-align:justify">The MACD and the signal line, at the beginning of last month, stood at -8.23 and -2.54 respectively. In the course of the month, both the macd and the signal line decreased by 12.98 and 17.54 points to close at -21.21 and -20.08 respectively. Both the lines moving in the negative territory shows bearish sentiment in the market. The macd line continues to move below the signal line, which further supports the bearish trigger. </p>
<p style="text-align:justify"><strong>b. RSI</strong><br />
RSI is a form of leading indicator that is believed to be most effective during periods of sideways movement. Such indicators may create numerous buy and sell signals that are useful when the market is not clearly trending upwards or downwards. </p>
<p style="text-align: center;"><img alt="" src="/userfiles/images/Clipboard43%287%29.jpg" style="height:145px; width:800px" /></p>
<p style="text-align:justify">The RSI, at the beginning of last month, stood at 33.43 level. In the course of the month, it gained 1.31 points to close at 34.74 level. The RSI fell as low as 19.19 level towards the middle of the month, signifying high selling pressure in the market. The RSI hovering at 30’s zone shows oversold condition.</p>
<p style="text-align:justify"><strong>c. Bollinger Bands</strong><br />
The Bollinger Band is a technical indicator that consists of a moving average (21-day) along with two trading bands above (upper band) and below it (lower band). The bands are an indication of volatility, which are represented by calculating standard deviation. </p>
<p style="text-align:justify">The benchmark index hovered close to the lower Bollinger band for majority of last month. Such movement signifies presence of selling pressure in the market. The distance between the upper and lower bands has diverged, indicating a rise in market volatility over the course of last month.</p>
<p style="text-align: center;"><img alt="" src="/userfiles/images/Clipboard44%283%29.jpg" /></p>
<p style="text-align:justify"><span style="font-size:16px"><strong>Overview</strong></span><br />
The benchmark index declined by 70.06 points (or down 4.75%) to close at 1402.09 last month. The index is hovering below the 50 and 200-day moving average, giving a bearish signal. The macd indicator has moved below the signal line, and both the lines are hovering in the negative territory. Such indication gives bearish sentiment of the market. The RSI closed at 34.74 level, which also signifies selling pressure. The bollinger bands indicate a rise in market volatility due to divergence between the upper and lower bands. The new support and resistance level stands at 1390 and 1464 level respectively. </p>
',
'status' => true,
'publish_date' => '0000-00-00',
'created' => '2018-02-11 11:02:21',
'modified' => '2018-02-11 11:10:58',
'keywords' => '',
'description' => '',
'sortorder' => '1993',
'feature_article' => true,
'user_id' => '11',
'image1' => null,
'image2' => null,
'image3' => null,
'image4' => null
),
'MagazineIssue' => array(
'id' => '982',
'image' => '20180205103708_cover.jpg',
'sortorder' => '1531',
'published' => true,
'created' => '2018-02-05 10:37:08',
'modified' => '2018-02-05 11:37:37',
'title' => 'February 2018',
'publish_date' => '2018-02-01',
'parent_id' => '0',
'homepage' => true,
'user_id' => '11'
),
'MagazineCategory' => array(
'id' => '63',
'title' => 'Stock Taking',
'sortorder' => '516',
'status' => true,
'created' => '0000-00-00 00:00:00',
'homepage' => true,
'modified' => '2013-04-01 00:00:00'
),
'User' => array(
'password' => '*****',
'id' => '11',
'user_detail_id' => '0',
'group_id' => '24',
'username' => 'nsingha@abhiyan.com.np',
'name' => '',
'email' => 'nsingha@abhiyan.com.np',
'address' => '',
'gender' => '',
'access' => '1',
'phone' => '',
'access_type' => '0',
'activated' => false,
'sortorder' => '0',
'published' => '0',
'created' => '2015-04-08 13:22:59',
'last_login' => '2023-04-16 09:29:47',
'ip' => '172.69.77.43'
),
'MagazineArticleComment' => array(),
'MagazineView' => array(
(int) 0 => array(
[maximum depth reached]
)
)
),
'current_user' => null,
'logged_in' => false
)
$magazineArticle = array(
'MagazineArticle' => array(
'id' => '2035',
'magazine_issue_id' => '982',
'magazine_category_id' => '63',
'title' => 'Monthly Technical Analysis of Nepse (24 December 2017 to 22 January 2018)',
'image' => null,
'short_content' => 'The benchmark index fell by 70.06 points (or down 4.75%) to close at 1402.09 last month. The index continued to move below the 50-day and the 200-day moving average, indicating a bearish momentum in the market. The market will likely remain bearish as the banks continue to face liquidity crunch.',
'content' => '<p style="text-align:justify"><span style="font-size:24px"><strong>Liquidity Crunch Effect</strong></span></p>
<p style="text-align:center"><span style="font-size:24px"><strong><img alt="" src="/userfiles/images/Clipboard39%285%29.jpg" /></strong></span></p>
<p style="text-align:center"><span style="font-size:24px"><strong><img alt="" src="/userfiles/images/Clipboard38%288%29.jpg" style="height:410px; width:800px" /></strong></span></p>
<p style="text-align:justify"><span style="font-size:16px"><strong>Trend Analysis</strong></span><br />
The benchmark index fell by 70.06 points (or down 4.75%) to close at 1402.09 last month. The index continued to move below the 50-day and the 200-day moving average, indicating a bearish momentum in the market. The market will likely remain bearish as the banks continue to face liquidity crunch. The average volume turnover decreased to NPR 50.92 crores from NPR 60.69 crores the month prior. </p>
<p style="text-align:justify"><span style="font-size:16px"><strong>Resistance and Support</strong></span></p>
<p style="text-align:justify"><span style="font-size:16px"><strong><img alt="" src="/userfiles/images/Clipboard40%286%29.jpg" style="height:380px; width:750px" /></strong></span></p>
<p style="text-align:justify">The Nepse index broke the support level of 1420 towards the middle of last month. The new support and resistance level now stands at 1390 and 1464 respectively. As bearish sentiment looms over the market, the index will likely test the support level in the coming weeks. </p>
<p style="text-align:justify"><span style="font-size:16px"><strong>Nepse Trend Indicator</strong></span><br />
<strong>a. MACD</strong><br />
The MACD is a momentum oscillator formed by using two different types of moving averages, which provides specific buying or selling signals. When a MACD line crosses above the signal line, it is considered to be a positive sign and indicates a time to buy, and vice-versa. </p>
<p style="text-align: center;"><img alt="" src="/userfiles/images/Clipboard41%285%29.jpg" style="height:151px; width:800px" /></p>
<p style="text-align:justify">The MACD and the signal line, at the beginning of last month, stood at -8.23 and -2.54 respectively. In the course of the month, both the macd and the signal line decreased by 12.98 and 17.54 points to close at -21.21 and -20.08 respectively. Both the lines moving in the negative territory shows bearish sentiment in the market. The macd line continues to move below the signal line, which further supports the bearish trigger. </p>
<p style="text-align:justify"><strong>b. RSI</strong><br />
RSI is a form of leading indicator that is believed to be most effective during periods of sideways movement. Such indicators may create numerous buy and sell signals that are useful when the market is not clearly trending upwards or downwards. </p>
<p style="text-align: center;"><img alt="" src="/userfiles/images/Clipboard43%287%29.jpg" style="height:145px; width:800px" /></p>
<p style="text-align:justify">The RSI, at the beginning of last month, stood at 33.43 level. In the course of the month, it gained 1.31 points to close at 34.74 level. The RSI fell as low as 19.19 level towards the middle of the month, signifying high selling pressure in the market. The RSI hovering at 30’s zone shows oversold condition.</p>
<p style="text-align:justify"><strong>c. Bollinger Bands</strong><br />
The Bollinger Band is a technical indicator that consists of a moving average (21-day) along with two trading bands above (upper band) and below it (lower band). The bands are an indication of volatility, which are represented by calculating standard deviation. </p>
<p style="text-align:justify">The benchmark index hovered close to the lower Bollinger band for majority of last month. Such movement signifies presence of selling pressure in the market. The distance between the upper and lower bands has diverged, indicating a rise in market volatility over the course of last month.</p>
<p style="text-align: center;"><img alt="" src="/userfiles/images/Clipboard44%283%29.jpg" /></p>
<p style="text-align:justify"><span style="font-size:16px"><strong>Overview</strong></span><br />
The benchmark index declined by 70.06 points (or down 4.75%) to close at 1402.09 last month. The index is hovering below the 50 and 200-day moving average, giving a bearish signal. The macd indicator has moved below the signal line, and both the lines are hovering in the negative territory. Such indication gives bearish sentiment of the market. The RSI closed at 34.74 level, which also signifies selling pressure. The bollinger bands indicate a rise in market volatility due to divergence between the upper and lower bands. The new support and resistance level stands at 1390 and 1464 level respectively. </p>
',
'status' => true,
'publish_date' => '0000-00-00',
'created' => '2018-02-11 11:02:21',
'modified' => '2018-02-11 11:10:58',
'keywords' => '',
'description' => '',
'sortorder' => '1993',
'feature_article' => true,
'user_id' => '11',
'image1' => null,
'image2' => null,
'image3' => null,
'image4' => null
),
'MagazineIssue' => array(
'id' => '982',
'image' => '20180205103708_cover.jpg',
'sortorder' => '1531',
'published' => true,
'created' => '2018-02-05 10:37:08',
'modified' => '2018-02-05 11:37:37',
'title' => 'February 2018',
'publish_date' => '2018-02-01',
'parent_id' => '0',
'homepage' => true,
'user_id' => '11'
),
'MagazineCategory' => array(
'id' => '63',
'title' => 'Stock Taking',
'sortorder' => '516',
'status' => true,
'created' => '0000-00-00 00:00:00',
'homepage' => true,
'modified' => '2013-04-01 00:00:00'
),
'User' => array(
'password' => '*****',
'id' => '11',
'user_detail_id' => '0',
'group_id' => '24',
'username' => 'nsingha@abhiyan.com.np',
'name' => '',
'email' => 'nsingha@abhiyan.com.np',
'address' => '',
'gender' => '',
'access' => '1',
'phone' => '',
'access_type' => '0',
'activated' => false,
'sortorder' => '0',
'published' => '0',
'created' => '2015-04-08 13:22:59',
'last_login' => '2023-04-16 09:29:47',
'ip' => '172.69.77.43'
),
'MagazineArticleComment' => array(),
'MagazineView' => array(
(int) 0 => array(
'magazine_article_id' => '2035',
'hit' => '3249'
)
)
)
$current_user = null
$logged_in = false
$user = null
$groupId = null
$user_id = null
include - APP/View/MagazineArticles/view.ctp, line 68
View::_evaluate() - CORE/Cake/View/View.php, line 971
View::_render() - CORE/Cake/View/View.php, line 933
View::render() - CORE/Cake/View/View.php, line 473
Controller::render() - CORE/Cake/Controller/Controller.php, line 968
Dispatcher::_invoke() - CORE/Cake/Routing/Dispatcher.php, line 200
Dispatcher::dispatch() - CORE/Cake/Routing/Dispatcher.php, line 167
[main] - APP/webroot/index.php, line 117
Monthly Technical Analysis of Nepse (24 December 2017 to 22 January 2018)
Liquidity Crunch Effect
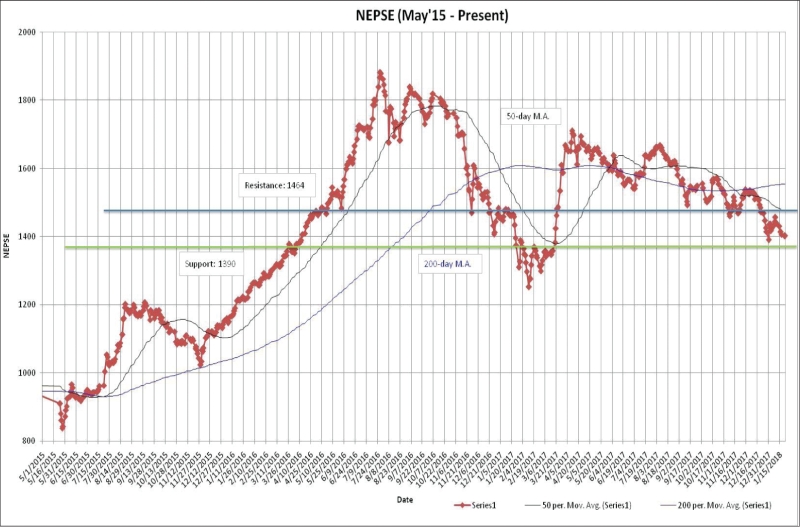
Trend Analysis
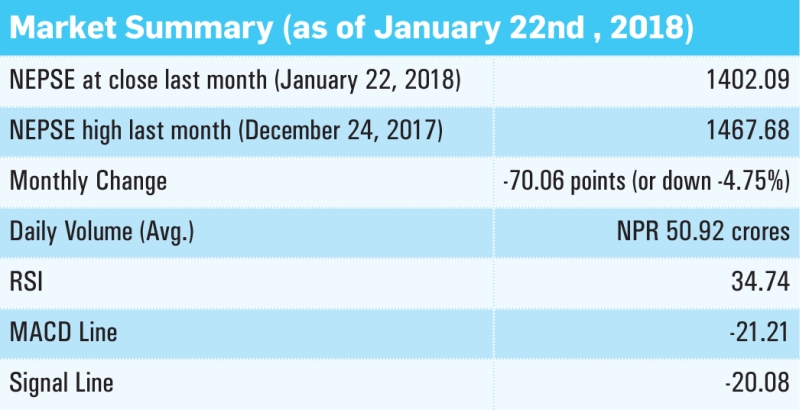
The benchmark index fell by 70.06 points (or down 4.75%) to close at 1402.09 last month. The index continued to move below the 50-day and the 200-day moving average, indicating a bearish momentum in the market. The market will likely remain bearish as the banks continue to face liquidity crunch. The average volume turnover decreased to NPR 50.92 crores from NPR 60.69 crores the month prior.
Resistance and Support
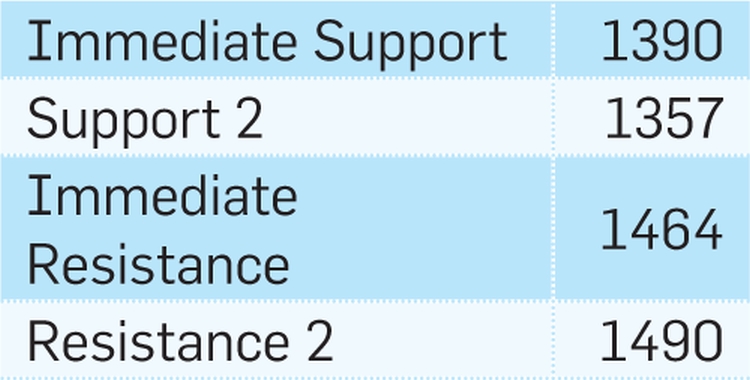
The Nepse index broke the support level of 1420 towards the middle of last month. The new support and resistance level now stands at 1390 and 1464 respectively. As bearish sentiment looms over the market, the index will likely test the support level in the coming weeks.
Nepse Trend Indicator
a. MACD
The MACD is a momentum oscillator formed by using two different types of moving averages, which provides specific buying or selling signals. When a MACD line crosses above the signal line, it is considered to be a positive sign and indicates a time to buy, and vice-versa.
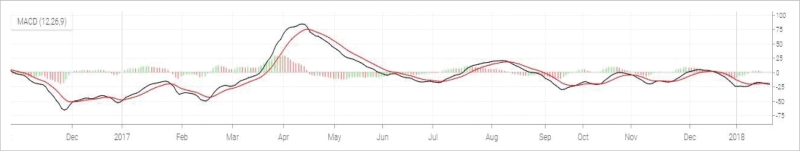
The MACD and the signal line, at the beginning of last month, stood at -8.23 and -2.54 respectively. In the course of the month, both the macd and the signal line decreased by 12.98 and 17.54 points to close at -21.21 and -20.08 respectively. Both the lines moving in the negative territory shows bearish sentiment in the market. The macd line continues to move below the signal line, which further supports the bearish trigger.
b. RSI
RSI is a form of leading indicator that is believed to be most effective during periods of sideways movement. Such indicators may create numerous buy and sell signals that are useful when the market is not clearly trending upwards or downwards.
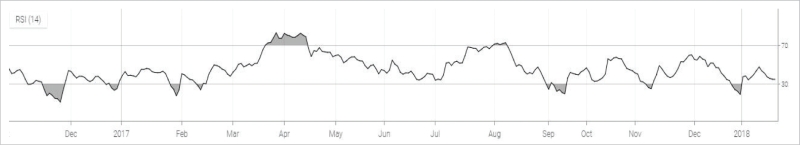
The RSI, at the beginning of last month, stood at 33.43 level. In the course of the month, it gained 1.31 points to close at 34.74 level. The RSI fell as low as 19.19 level towards the middle of the month, signifying high selling pressure in the market. The RSI hovering at 30’s zone shows oversold condition.
c. Bollinger Bands
The Bollinger Band is a technical indicator that consists of a moving average (21-day) along with two trading bands above (upper band) and below it (lower band). The bands are an indication of volatility, which are represented by calculating standard deviation.
The benchmark index hovered close to the lower Bollinger band for majority of last month. Such movement signifies presence of selling pressure in the market. The distance between the upper and lower bands has diverged, indicating a rise in market volatility over the course of last month.
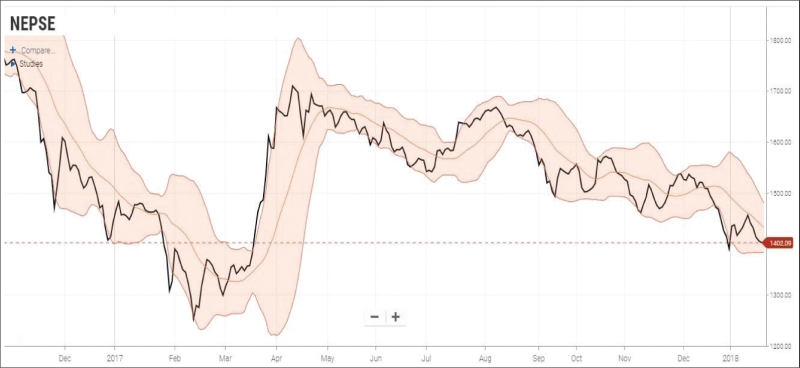
Overview
The benchmark index declined by 70.06 points (or down 4.75%) to close at 1402.09 last month. The index is hovering below the 50 and 200-day moving average, giving a bearish signal. The macd indicator has moved below the signal line, and both the lines are hovering in the negative territory. Such indication gives bearish sentiment of the market. The RSI closed at 34.74 level, which also signifies selling pressure. The bollinger bands indicate a rise in market volatility due to divergence between the upper and lower bands. The new support and resistance level stands at 1390 and 1464 level respectively.