$user = $this->Session->read('Auth.User');
//find the group of logged user
$groupId = $user['Group']['id'];
$viewFile = '/var/www/html/newbusinessage.com/app/View/MagazineArticles/view.ctp'
$dataForView = array(
'magazineArticle' => array(
'MagazineArticle' => array(
'id' => '2403',
'magazine_issue_id' => '995',
'magazine_category_id' => '63',
'title' => 'Monthly Technical Analysis of Nepse (December 23rd 2018 – January 17th 2019)',
'image' => '20190215124248_Clipboard07.jpg',
'short_content' => 'NEPSE index gained 21.8 (or up 1.87%) to close at 1187.77 last month. At the beginning of last month, NEPSE index showed bullish momentum by breaching the resistance of 50 days moving average. However, NEPSE index could not breach the 200 days moving average and retraced back forming a shooting star candle. Currently, NEPSE is trading above 50 days moving average and below 200 days moving says average.',
'content' => '<div>
<span style="font-size:18px;"><strong>Shooting Star</strong></span></div>
<div>
</div>
<div style="text-align: center;">
<span style="font-size:16px;"><strong><img alt="" src="/app/webroot/userfiles/images/Clipboard05%2815%29.jpg" style="width: 800px; height: 799px;" /></strong></span></div>
<div>
</div>
<div>
<strong style="font-size: 16px;">Trend Analysis</strong></div>
<div>
</div>
<div style="text-align: center;">
<img alt="" src="/app/webroot/userfiles/images/Clipboard08%2816%29.jpg" style="width: 800px; height: 319px;" /></div>
<div>
</div>
<div>
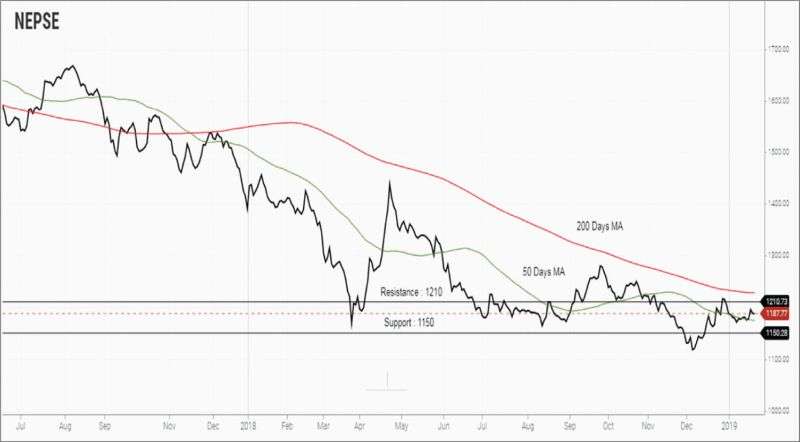
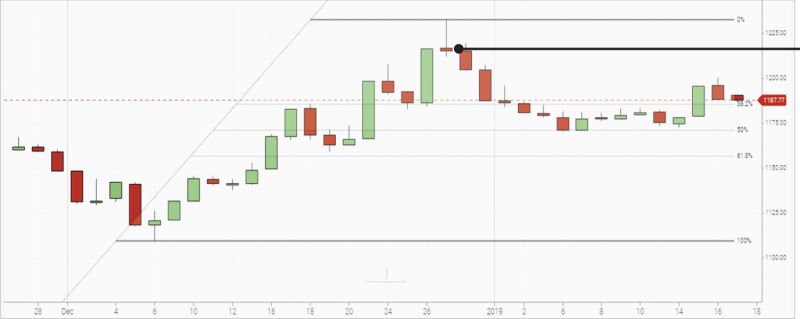
NEPSE index gained 21.8 (or up 1.87%) to close at 1187.77 last month. At the beginning of last month, NEPSE index showed bullish momentum by breaching the resistance of 50 days moving average. However, NEPSE index could not breach the 200 days moving average and retraced back forming a shooting star candle. Currently, NEPSE is trading above 50 days moving average and below 200 days moving says average. The average daily turnover has increased to NPR 45.14 crores from NPR 37.90 crores. Currently, NEPSE is trading above the retracement level of 38.2% of the recent swing from 1109.32 to 1232.74. Since NEPSE is trading above the 38.2% level, NEPSE still shows the presence of bullish sentiment in the market.</div>
<div>
</div>
<div>
<span style="font-size:16px;"><strong>Resistance and Support</strong></span></div>
<div>
</div>
<div style="text-align: center;">
<img alt="" src="/app/webroot/userfiles/images/Clipboard02%2817%29.jpg" style="width: 800px; height: 252px;" /></div>
<div>
</div>
<div>
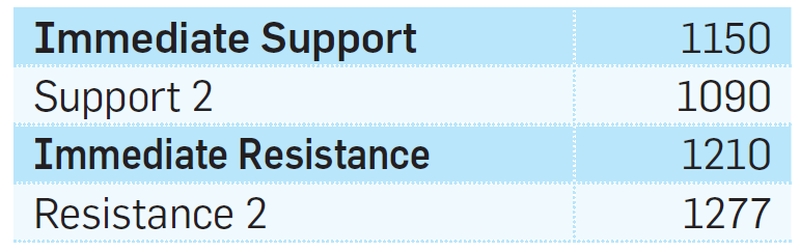
In course of month, the index broke the resistance level of 1210, reached the high level of 1232.74 and retraced back to the low level of 1170.11. However, at the end of month, NEPSE showed bullish momentum and closed at 1187.77. The average traded volume was higher than the previous month indicating an increased market participation. The immediate support and resistance stand same at 1150 and 1210 respectively.</div>
<div>
</div>
<div>
<span style="font-size:16px;"><strong>Nepse Trend Indicator</strong></span></div>
<div>
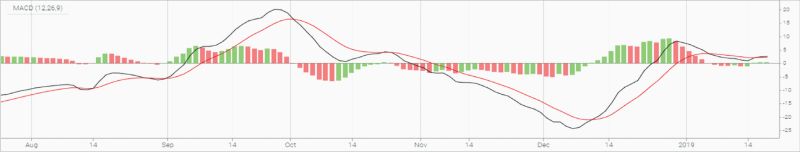
<strong>a. MACD</strong></div>
<div>
The MACD is a momentum oscillator formed by using two different types of moving averages, which provides specific buying or selling signals. When a MACD line crosses above the signal line, it is considered to be a positive sign and indicates a time to buy, and vice-versa.</div>
<div>
</div>
<div>
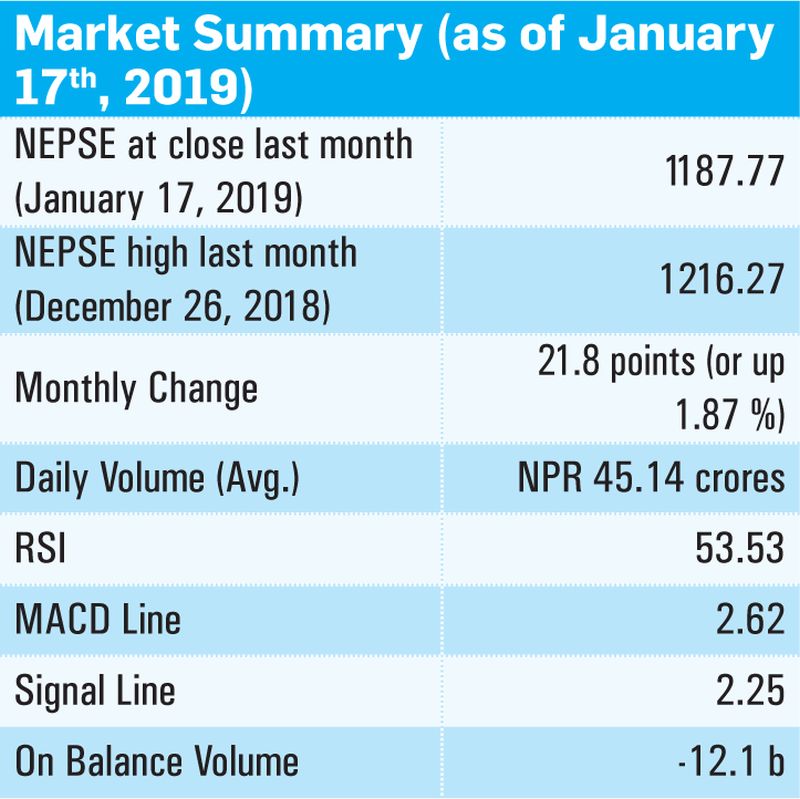
The MACD and the signal line, at the beginning of last month, stood at -6.39 and –12.52 respectively. By the end of the month, MACD line and signal increased by 9.01 and 14.76 to close at 2.62 and 2.25 respectively. The MACD line crossed the signal line from the below indicating a bullish crossover in the market. Both lines are moving in the positive zone indicating a positive sign in the market.</div>
<div>
</div>
<div style="text-align: center;">
<img alt="" src="/app/webroot/userfiles/images/Clipboard09%2813%29.jpg" style="width: 800px; height: 152px;" /></div>
<div>
</div>
<div>
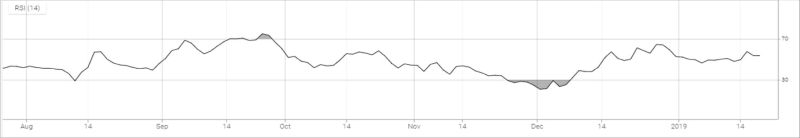
<strong>b. RSI</strong></div>
<div>
RSI is a form of leading indicator that is believed to be most effective during periods of sideways movement. Such indicators may create numerous buy and sell signals that are useful when the market is not clearly trending upwards or downwards.</div>
<div>
</div>
<div>
The RSI at the beginning of the month, stood at 50.19 level. In the course of month, RSI increased by 3.34 points to close at 53.53. Last month, RSI reached the high level of 64 and retraced back to the low level of 46. At the end of month, NEPSE showed some bullish momentum and RSI gained some points to close at 53.53. Positive divergence can be seen between the NEPSE and RSI as NEPSE and RSI are forming lower low and lower high.</div>
<div>
</div>
<div style="text-align: center;">
<img alt="" src="/app/webroot/userfiles/images/Clipboard10%2814%29.jpg" style="width: 800px; height: 138px;" /></div>
<div>
</div>
<div>
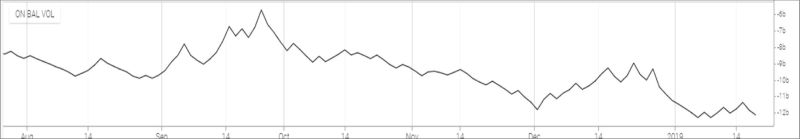
<strong>c. (OBV)</strong></div>
<div>
On balance volume is a momentum indicator that uses volume flow to predict changes in stock prices. It measures buying and selling pressure as a cumulative indicator that adds volume in up days and subtracts volume on down days.</div>
<div>
</div>
<div>
On balance volume at the beginning of last month, stood at -9.7 b level. In the course of month, it lost 2.4 b points to close at -12.1 b. Last month, OBV has decreased by 2.4 b indicating a rise of selling pressure in the market.</div>
<div>
</div>
<div style="text-align: center;">
<img alt="" src="/app/webroot/userfiles/images/Clipboard11%2817%29.jpg" style="width: 800px; height: 377px;" /></div>
<div>
</div>
<div>
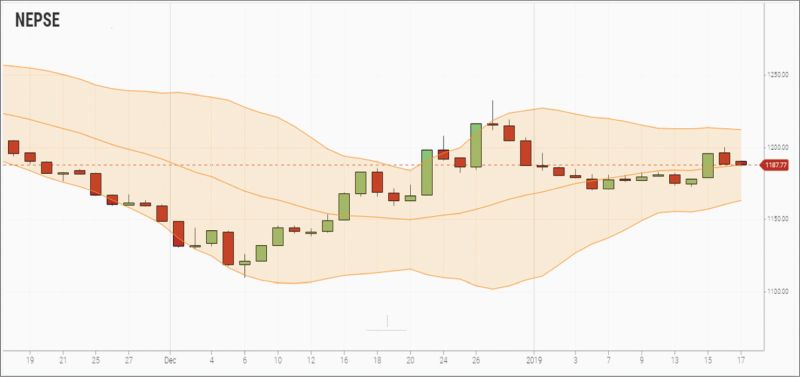
<strong>d. Bollinger Bands</strong></div>
<div>
The Bollinger Band is a technical indicator that consists of a moving average (21-day) along with two trading bands above (upper band) and below it (lower band). The bands are an indication of volatility, which are represented by calculating standard deviation.</div>
<div>
At the beginning of the month, NEPSE index retraced back from the upper Bollinger band to the mid Bollinger band. However, at the mid-month, NEPSE showed sideways movement and closed at mid Bollinger band. The distance between upper and lower Bollinger band has decreased indicating a low volatility in the market.</div>
<div>
</div>
<div style="text-align: center;">
<img alt="" src="/app/webroot/userfiles/images/Clipboard12%2816%29.jpg" style="width: 800px; height: 139px;" /></div>
<div>
</div>
<div>
<strong>e. Overview</strong></div>
<div>
NEPSE index gained 21.8 (or up 1.87%) to close at 1187.77 last month. At the beginning of last month, NEPSE index showed bullish momentum by breaching the resistance of 50 days moving average. However, NEPSE index could not breach the 200 days moving average and retraced back forming a shooting star candle. Currently, NEPSE is trading above 50 days moving average and below 200 days moving average. The MACD line crossed the signal line from the below indicating a bullish crossover in the market. Both lines are moving in the positive zone indicating a positive sign in the market. Positive divergence can be seen between the NEPSE and RSI as NEPSE and RSI are forming lower low and lower high. Last month, OBV has decreased by 2.4 b indicating a rise of selling pressure in the market. The distance between upper and lower Bollinger band has decreased indicating a low volatility in the market. The immediate support and resistance stand same at 1150 and 1210 respectively. </div>
<div>
</div>
<div>
</div>
',
'status' => true,
'publish_date' => null,
'created' => '2019-02-15 12:42:48',
'modified' => '2019-02-15 12:45:32',
'keywords' => '',
'description' => '',
'sortorder' => '2353',
'feature_article' => true,
'user_id' => '11',
'image1' => null,
'image2' => null,
'image3' => null,
'image4' => null
),
'MagazineIssue' => array(
'id' => '995',
'image' => '20190214094935_NewBiz_February_Cover Page for web.jpg',
'sortorder' => '1543',
'published' => true,
'created' => '2019-02-11 11:16:33',
'modified' => '2019-02-14 09:49:36',
'title' => 'February 2019',
'publish_date' => '2019-02-01',
'parent_id' => '0',
'homepage' => true,
'user_id' => '11'
),
'MagazineCategory' => array(
'id' => '63',
'title' => 'Stock Taking',
'sortorder' => '516',
'status' => true,
'created' => '0000-00-00 00:00:00',
'homepage' => true,
'modified' => '2013-04-01 00:00:00'
),
'User' => array(
'password' => '*****',
'id' => '11',
'user_detail_id' => '0',
'group_id' => '24',
'username' => 'nsingha@abhiyan.com.np',
'name' => '',
'email' => 'nsingha@abhiyan.com.np',
'address' => '',
'gender' => '',
'access' => '1',
'phone' => '',
'access_type' => '0',
'activated' => false,
'sortorder' => '0',
'published' => '0',
'created' => '2015-04-08 13:22:59',
'last_login' => '2023-04-16 09:29:47',
'ip' => '172.69.77.43'
),
'MagazineArticleComment' => array(),
'MagazineView' => array(
(int) 0 => array(
[maximum depth reached]
)
)
),
'current_user' => null,
'logged_in' => false
)
$magazineArticle = array(
'MagazineArticle' => array(
'id' => '2403',
'magazine_issue_id' => '995',
'magazine_category_id' => '63',
'title' => 'Monthly Technical Analysis of Nepse (December 23rd 2018 – January 17th 2019)',
'image' => '20190215124248_Clipboard07.jpg',
'short_content' => 'NEPSE index gained 21.8 (or up 1.87%) to close at 1187.77 last month. At the beginning of last month, NEPSE index showed bullish momentum by breaching the resistance of 50 days moving average. However, NEPSE index could not breach the 200 days moving average and retraced back forming a shooting star candle. Currently, NEPSE is trading above 50 days moving average and below 200 days moving says average.',
'content' => '<div>
<span style="font-size:18px;"><strong>Shooting Star</strong></span></div>
<div>
</div>
<div style="text-align: center;">
<span style="font-size:16px;"><strong><img alt="" src="/app/webroot/userfiles/images/Clipboard05%2815%29.jpg" style="width: 800px; height: 799px;" /></strong></span></div>
<div>
</div>
<div>
<strong style="font-size: 16px;">Trend Analysis</strong></div>
<div>
</div>
<div style="text-align: center;">
<img alt="" src="/app/webroot/userfiles/images/Clipboard08%2816%29.jpg" style="width: 800px; height: 319px;" /></div>
<div>
</div>
<div>
NEPSE index gained 21.8 (or up 1.87%) to close at 1187.77 last month. At the beginning of last month, NEPSE index showed bullish momentum by breaching the resistance of 50 days moving average. However, NEPSE index could not breach the 200 days moving average and retraced back forming a shooting star candle. Currently, NEPSE is trading above 50 days moving average and below 200 days moving says average. The average daily turnover has increased to NPR 45.14 crores from NPR 37.90 crores. Currently, NEPSE is trading above the retracement level of 38.2% of the recent swing from 1109.32 to 1232.74. Since NEPSE is trading above the 38.2% level, NEPSE still shows the presence of bullish sentiment in the market.</div>
<div>
</div>
<div>
<span style="font-size:16px;"><strong>Resistance and Support</strong></span></div>
<div>
</div>
<div style="text-align: center;">
<img alt="" src="/app/webroot/userfiles/images/Clipboard02%2817%29.jpg" style="width: 800px; height: 252px;" /></div>
<div>
</div>
<div>
In course of month, the index broke the resistance level of 1210, reached the high level of 1232.74 and retraced back to the low level of 1170.11. However, at the end of month, NEPSE showed bullish momentum and closed at 1187.77. The average traded volume was higher than the previous month indicating an increased market participation. The immediate support and resistance stand same at 1150 and 1210 respectively.</div>
<div>
</div>
<div>
<span style="font-size:16px;"><strong>Nepse Trend Indicator</strong></span></div>
<div>
<strong>a. MACD</strong></div>
<div>
The MACD is a momentum oscillator formed by using two different types of moving averages, which provides specific buying or selling signals. When a MACD line crosses above the signal line, it is considered to be a positive sign and indicates a time to buy, and vice-versa.</div>
<div>
</div>
<div>
The MACD and the signal line, at the beginning of last month, stood at -6.39 and –12.52 respectively. By the end of the month, MACD line and signal increased by 9.01 and 14.76 to close at 2.62 and 2.25 respectively. The MACD line crossed the signal line from the below indicating a bullish crossover in the market. Both lines are moving in the positive zone indicating a positive sign in the market.</div>
<div>
</div>
<div style="text-align: center;">
<img alt="" src="/app/webroot/userfiles/images/Clipboard09%2813%29.jpg" style="width: 800px; height: 152px;" /></div>
<div>
</div>
<div>
<strong>b. RSI</strong></div>
<div>
RSI is a form of leading indicator that is believed to be most effective during periods of sideways movement. Such indicators may create numerous buy and sell signals that are useful when the market is not clearly trending upwards or downwards.</div>
<div>
</div>
<div>
The RSI at the beginning of the month, stood at 50.19 level. In the course of month, RSI increased by 3.34 points to close at 53.53. Last month, RSI reached the high level of 64 and retraced back to the low level of 46. At the end of month, NEPSE showed some bullish momentum and RSI gained some points to close at 53.53. Positive divergence can be seen between the NEPSE and RSI as NEPSE and RSI are forming lower low and lower high.</div>
<div>
</div>
<div style="text-align: center;">
<img alt="" src="/app/webroot/userfiles/images/Clipboard10%2814%29.jpg" style="width: 800px; height: 138px;" /></div>
<div>
</div>
<div>
<strong>c. (OBV)</strong></div>
<div>
On balance volume is a momentum indicator that uses volume flow to predict changes in stock prices. It measures buying and selling pressure as a cumulative indicator that adds volume in up days and subtracts volume on down days.</div>
<div>
</div>
<div>
On balance volume at the beginning of last month, stood at -9.7 b level. In the course of month, it lost 2.4 b points to close at -12.1 b. Last month, OBV has decreased by 2.4 b indicating a rise of selling pressure in the market.</div>
<div>
</div>
<div style="text-align: center;">
<img alt="" src="/app/webroot/userfiles/images/Clipboard11%2817%29.jpg" style="width: 800px; height: 377px;" /></div>
<div>
</div>
<div>
<strong>d. Bollinger Bands</strong></div>
<div>
The Bollinger Band is a technical indicator that consists of a moving average (21-day) along with two trading bands above (upper band) and below it (lower band). The bands are an indication of volatility, which are represented by calculating standard deviation.</div>
<div>
At the beginning of the month, NEPSE index retraced back from the upper Bollinger band to the mid Bollinger band. However, at the mid-month, NEPSE showed sideways movement and closed at mid Bollinger band. The distance between upper and lower Bollinger band has decreased indicating a low volatility in the market.</div>
<div>
</div>
<div style="text-align: center;">
<img alt="" src="/app/webroot/userfiles/images/Clipboard12%2816%29.jpg" style="width: 800px; height: 139px;" /></div>
<div>
</div>
<div>
<strong>e. Overview</strong></div>
<div>
NEPSE index gained 21.8 (or up 1.87%) to close at 1187.77 last month. At the beginning of last month, NEPSE index showed bullish momentum by breaching the resistance of 50 days moving average. However, NEPSE index could not breach the 200 days moving average and retraced back forming a shooting star candle. Currently, NEPSE is trading above 50 days moving average and below 200 days moving average. The MACD line crossed the signal line from the below indicating a bullish crossover in the market. Both lines are moving in the positive zone indicating a positive sign in the market. Positive divergence can be seen between the NEPSE and RSI as NEPSE and RSI are forming lower low and lower high. Last month, OBV has decreased by 2.4 b indicating a rise of selling pressure in the market. The distance between upper and lower Bollinger band has decreased indicating a low volatility in the market. The immediate support and resistance stand same at 1150 and 1210 respectively. </div>
<div>
</div>
<div>
</div>
',
'status' => true,
'publish_date' => null,
'created' => '2019-02-15 12:42:48',
'modified' => '2019-02-15 12:45:32',
'keywords' => '',
'description' => '',
'sortorder' => '2353',
'feature_article' => true,
'user_id' => '11',
'image1' => null,
'image2' => null,
'image3' => null,
'image4' => null
),
'MagazineIssue' => array(
'id' => '995',
'image' => '20190214094935_NewBiz_February_Cover Page for web.jpg',
'sortorder' => '1543',
'published' => true,
'created' => '2019-02-11 11:16:33',
'modified' => '2019-02-14 09:49:36',
'title' => 'February 2019',
'publish_date' => '2019-02-01',
'parent_id' => '0',
'homepage' => true,
'user_id' => '11'
),
'MagazineCategory' => array(
'id' => '63',
'title' => 'Stock Taking',
'sortorder' => '516',
'status' => true,
'created' => '0000-00-00 00:00:00',
'homepage' => true,
'modified' => '2013-04-01 00:00:00'
),
'User' => array(
'password' => '*****',
'id' => '11',
'user_detail_id' => '0',
'group_id' => '24',
'username' => 'nsingha@abhiyan.com.np',
'name' => '',
'email' => 'nsingha@abhiyan.com.np',
'address' => '',
'gender' => '',
'access' => '1',
'phone' => '',
'access_type' => '0',
'activated' => false,
'sortorder' => '0',
'published' => '0',
'created' => '2015-04-08 13:22:59',
'last_login' => '2023-04-16 09:29:47',
'ip' => '172.69.77.43'
),
'MagazineArticleComment' => array(),
'MagazineView' => array(
(int) 0 => array(
'magazine_article_id' => '2403',
'hit' => '2540'
)
)
)
$current_user = null
$logged_in = false
$user = null
include - APP/View/MagazineArticles/view.ctp, line 54
View::_evaluate() - CORE/Cake/View/View.php, line 971
View::_render() - CORE/Cake/View/View.php, line 933
View::render() - CORE/Cake/View/View.php, line 473
Controller::render() - CORE/Cake/Controller/Controller.php, line 968
Dispatcher::_invoke() - CORE/Cake/Routing/Dispatcher.php, line 200
Dispatcher::dispatch() - CORE/Cake/Routing/Dispatcher.php, line 167
[main] - APP/webroot/index.php, line 117
Notice (8): Trying to access array offset on value of type null [APP/View/MagazineArticles/view.ctp, line 54]
$user = $this->Session->read('Auth.User');
//find the group of logged user
$groupId = $user['Group']['id'];
$viewFile = '/var/www/html/newbusinessage.com/app/View/MagazineArticles/view.ctp'
$dataForView = array(
'magazineArticle' => array(
'MagazineArticle' => array(
'id' => '2403',
'magazine_issue_id' => '995',
'magazine_category_id' => '63',
'title' => 'Monthly Technical Analysis of Nepse (December 23rd 2018 – January 17th 2019)',
'image' => '20190215124248_Clipboard07.jpg',
'short_content' => 'NEPSE index gained 21.8 (or up 1.87%) to close at 1187.77 last month. At the beginning of last month, NEPSE index showed bullish momentum by breaching the resistance of 50 days moving average. However, NEPSE index could not breach the 200 days moving average and retraced back forming a shooting star candle. Currently, NEPSE is trading above 50 days moving average and below 200 days moving says average.',
'content' => '<div>
<span style="font-size:18px;"><strong>Shooting Star</strong></span></div>
<div>
</div>
<div style="text-align: center;">
<span style="font-size:16px;"><strong><img alt="" src="/app/webroot/userfiles/images/Clipboard05%2815%29.jpg" style="width: 800px; height: 799px;" /></strong></span></div>
<div>
</div>
<div>
<strong style="font-size: 16px;">Trend Analysis</strong></div>
<div>
</div>
<div style="text-align: center;">
<img alt="" src="/app/webroot/userfiles/images/Clipboard08%2816%29.jpg" style="width: 800px; height: 319px;" /></div>
<div>
</div>
<div>
NEPSE index gained 21.8 (or up 1.87%) to close at 1187.77 last month. At the beginning of last month, NEPSE index showed bullish momentum by breaching the resistance of 50 days moving average. However, NEPSE index could not breach the 200 days moving average and retraced back forming a shooting star candle. Currently, NEPSE is trading above 50 days moving average and below 200 days moving says average. The average daily turnover has increased to NPR 45.14 crores from NPR 37.90 crores. Currently, NEPSE is trading above the retracement level of 38.2% of the recent swing from 1109.32 to 1232.74. Since NEPSE is trading above the 38.2% level, NEPSE still shows the presence of bullish sentiment in the market.</div>
<div>
</div>
<div>
<span style="font-size:16px;"><strong>Resistance and Support</strong></span></div>
<div>
</div>
<div style="text-align: center;">
<img alt="" src="/app/webroot/userfiles/images/Clipboard02%2817%29.jpg" style="width: 800px; height: 252px;" /></div>
<div>
</div>
<div>
In course of month, the index broke the resistance level of 1210, reached the high level of 1232.74 and retraced back to the low level of 1170.11. However, at the end of month, NEPSE showed bullish momentum and closed at 1187.77. The average traded volume was higher than the previous month indicating an increased market participation. The immediate support and resistance stand same at 1150 and 1210 respectively.</div>
<div>
</div>
<div>
<span style="font-size:16px;"><strong>Nepse Trend Indicator</strong></span></div>
<div>
<strong>a. MACD</strong></div>
<div>
The MACD is a momentum oscillator formed by using two different types of moving averages, which provides specific buying or selling signals. When a MACD line crosses above the signal line, it is considered to be a positive sign and indicates a time to buy, and vice-versa.</div>
<div>
</div>
<div>
The MACD and the signal line, at the beginning of last month, stood at -6.39 and –12.52 respectively. By the end of the month, MACD line and signal increased by 9.01 and 14.76 to close at 2.62 and 2.25 respectively. The MACD line crossed the signal line from the below indicating a bullish crossover in the market. Both lines are moving in the positive zone indicating a positive sign in the market.</div>
<div>
</div>
<div style="text-align: center;">
<img alt="" src="/app/webroot/userfiles/images/Clipboard09%2813%29.jpg" style="width: 800px; height: 152px;" /></div>
<div>
</div>
<div>
<strong>b. RSI</strong></div>
<div>
RSI is a form of leading indicator that is believed to be most effective during periods of sideways movement. Such indicators may create numerous buy and sell signals that are useful when the market is not clearly trending upwards or downwards.</div>
<div>
</div>
<div>
The RSI at the beginning of the month, stood at 50.19 level. In the course of month, RSI increased by 3.34 points to close at 53.53. Last month, RSI reached the high level of 64 and retraced back to the low level of 46. At the end of month, NEPSE showed some bullish momentum and RSI gained some points to close at 53.53. Positive divergence can be seen between the NEPSE and RSI as NEPSE and RSI are forming lower low and lower high.</div>
<div>
</div>
<div style="text-align: center;">
<img alt="" src="/app/webroot/userfiles/images/Clipboard10%2814%29.jpg" style="width: 800px; height: 138px;" /></div>
<div>
</div>
<div>
<strong>c. (OBV)</strong></div>
<div>
On balance volume is a momentum indicator that uses volume flow to predict changes in stock prices. It measures buying and selling pressure as a cumulative indicator that adds volume in up days and subtracts volume on down days.</div>
<div>
</div>
<div>
On balance volume at the beginning of last month, stood at -9.7 b level. In the course of month, it lost 2.4 b points to close at -12.1 b. Last month, OBV has decreased by 2.4 b indicating a rise of selling pressure in the market.</div>
<div>
</div>
<div style="text-align: center;">
<img alt="" src="/app/webroot/userfiles/images/Clipboard11%2817%29.jpg" style="width: 800px; height: 377px;" /></div>
<div>
</div>
<div>
<strong>d. Bollinger Bands</strong></div>
<div>
The Bollinger Band is a technical indicator that consists of a moving average (21-day) along with two trading bands above (upper band) and below it (lower band). The bands are an indication of volatility, which are represented by calculating standard deviation.</div>
<div>
At the beginning of the month, NEPSE index retraced back from the upper Bollinger band to the mid Bollinger band. However, at the mid-month, NEPSE showed sideways movement and closed at mid Bollinger band. The distance between upper and lower Bollinger band has decreased indicating a low volatility in the market.</div>
<div>
</div>
<div style="text-align: center;">
<img alt="" src="/app/webroot/userfiles/images/Clipboard12%2816%29.jpg" style="width: 800px; height: 139px;" /></div>
<div>
</div>
<div>
<strong>e. Overview</strong></div>
<div>
NEPSE index gained 21.8 (or up 1.87%) to close at 1187.77 last month. At the beginning of last month, NEPSE index showed bullish momentum by breaching the resistance of 50 days moving average. However, NEPSE index could not breach the 200 days moving average and retraced back forming a shooting star candle. Currently, NEPSE is trading above 50 days moving average and below 200 days moving average. The MACD line crossed the signal line from the below indicating a bullish crossover in the market. Both lines are moving in the positive zone indicating a positive sign in the market. Positive divergence can be seen between the NEPSE and RSI as NEPSE and RSI are forming lower low and lower high. Last month, OBV has decreased by 2.4 b indicating a rise of selling pressure in the market. The distance between upper and lower Bollinger band has decreased indicating a low volatility in the market. The immediate support and resistance stand same at 1150 and 1210 respectively. </div>
<div>
</div>
<div>
</div>
',
'status' => true,
'publish_date' => null,
'created' => '2019-02-15 12:42:48',
'modified' => '2019-02-15 12:45:32',
'keywords' => '',
'description' => '',
'sortorder' => '2353',
'feature_article' => true,
'user_id' => '11',
'image1' => null,
'image2' => null,
'image3' => null,
'image4' => null
),
'MagazineIssue' => array(
'id' => '995',
'image' => '20190214094935_NewBiz_February_Cover Page for web.jpg',
'sortorder' => '1543',
'published' => true,
'created' => '2019-02-11 11:16:33',
'modified' => '2019-02-14 09:49:36',
'title' => 'February 2019',
'publish_date' => '2019-02-01',
'parent_id' => '0',
'homepage' => true,
'user_id' => '11'
),
'MagazineCategory' => array(
'id' => '63',
'title' => 'Stock Taking',
'sortorder' => '516',
'status' => true,
'created' => '0000-00-00 00:00:00',
'homepage' => true,
'modified' => '2013-04-01 00:00:00'
),
'User' => array(
'password' => '*****',
'id' => '11',
'user_detail_id' => '0',
'group_id' => '24',
'username' => 'nsingha@abhiyan.com.np',
'name' => '',
'email' => 'nsingha@abhiyan.com.np',
'address' => '',
'gender' => '',
'access' => '1',
'phone' => '',
'access_type' => '0',
'activated' => false,
'sortorder' => '0',
'published' => '0',
'created' => '2015-04-08 13:22:59',
'last_login' => '2023-04-16 09:29:47',
'ip' => '172.69.77.43'
),
'MagazineArticleComment' => array(),
'MagazineView' => array(
(int) 0 => array(
[maximum depth reached]
)
)
),
'current_user' => null,
'logged_in' => false
)
$magazineArticle = array(
'MagazineArticle' => array(
'id' => '2403',
'magazine_issue_id' => '995',
'magazine_category_id' => '63',
'title' => 'Monthly Technical Analysis of Nepse (December 23rd 2018 – January 17th 2019)',
'image' => '20190215124248_Clipboard07.jpg',
'short_content' => 'NEPSE index gained 21.8 (or up 1.87%) to close at 1187.77 last month. At the beginning of last month, NEPSE index showed bullish momentum by breaching the resistance of 50 days moving average. However, NEPSE index could not breach the 200 days moving average and retraced back forming a shooting star candle. Currently, NEPSE is trading above 50 days moving average and below 200 days moving says average.',
'content' => '<div>
<span style="font-size:18px;"><strong>Shooting Star</strong></span></div>
<div>
</div>
<div style="text-align: center;">
<span style="font-size:16px;"><strong><img alt="" src="/app/webroot/userfiles/images/Clipboard05%2815%29.jpg" style="width: 800px; height: 799px;" /></strong></span></div>
<div>
</div>
<div>
<strong style="font-size: 16px;">Trend Analysis</strong></div>
<div>
</div>
<div style="text-align: center;">
<img alt="" src="/app/webroot/userfiles/images/Clipboard08%2816%29.jpg" style="width: 800px; height: 319px;" /></div>
<div>
</div>
<div>
NEPSE index gained 21.8 (or up 1.87%) to close at 1187.77 last month. At the beginning of last month, NEPSE index showed bullish momentum by breaching the resistance of 50 days moving average. However, NEPSE index could not breach the 200 days moving average and retraced back forming a shooting star candle. Currently, NEPSE is trading above 50 days moving average and below 200 days moving says average. The average daily turnover has increased to NPR 45.14 crores from NPR 37.90 crores. Currently, NEPSE is trading above the retracement level of 38.2% of the recent swing from 1109.32 to 1232.74. Since NEPSE is trading above the 38.2% level, NEPSE still shows the presence of bullish sentiment in the market.</div>
<div>
</div>
<div>
<span style="font-size:16px;"><strong>Resistance and Support</strong></span></div>
<div>
</div>
<div style="text-align: center;">
<img alt="" src="/app/webroot/userfiles/images/Clipboard02%2817%29.jpg" style="width: 800px; height: 252px;" /></div>
<div>
</div>
<div>
In course of month, the index broke the resistance level of 1210, reached the high level of 1232.74 and retraced back to the low level of 1170.11. However, at the end of month, NEPSE showed bullish momentum and closed at 1187.77. The average traded volume was higher than the previous month indicating an increased market participation. The immediate support and resistance stand same at 1150 and 1210 respectively.</div>
<div>
</div>
<div>
<span style="font-size:16px;"><strong>Nepse Trend Indicator</strong></span></div>
<div>
<strong>a. MACD</strong></div>
<div>
The MACD is a momentum oscillator formed by using two different types of moving averages, which provides specific buying or selling signals. When a MACD line crosses above the signal line, it is considered to be a positive sign and indicates a time to buy, and vice-versa.</div>
<div>
</div>
<div>
The MACD and the signal line, at the beginning of last month, stood at -6.39 and –12.52 respectively. By the end of the month, MACD line and signal increased by 9.01 and 14.76 to close at 2.62 and 2.25 respectively. The MACD line crossed the signal line from the below indicating a bullish crossover in the market. Both lines are moving in the positive zone indicating a positive sign in the market.</div>
<div>
</div>
<div style="text-align: center;">
<img alt="" src="/app/webroot/userfiles/images/Clipboard09%2813%29.jpg" style="width: 800px; height: 152px;" /></div>
<div>
</div>
<div>
<strong>b. RSI</strong></div>
<div>
RSI is a form of leading indicator that is believed to be most effective during periods of sideways movement. Such indicators may create numerous buy and sell signals that are useful when the market is not clearly trending upwards or downwards.</div>
<div>
</div>
<div>
The RSI at the beginning of the month, stood at 50.19 level. In the course of month, RSI increased by 3.34 points to close at 53.53. Last month, RSI reached the high level of 64 and retraced back to the low level of 46. At the end of month, NEPSE showed some bullish momentum and RSI gained some points to close at 53.53. Positive divergence can be seen between the NEPSE and RSI as NEPSE and RSI are forming lower low and lower high.</div>
<div>
</div>
<div style="text-align: center;">
<img alt="" src="/app/webroot/userfiles/images/Clipboard10%2814%29.jpg" style="width: 800px; height: 138px;" /></div>
<div>
</div>
<div>
<strong>c. (OBV)</strong></div>
<div>
On balance volume is a momentum indicator that uses volume flow to predict changes in stock prices. It measures buying and selling pressure as a cumulative indicator that adds volume in up days and subtracts volume on down days.</div>
<div>
</div>
<div>
On balance volume at the beginning of last month, stood at -9.7 b level. In the course of month, it lost 2.4 b points to close at -12.1 b. Last month, OBV has decreased by 2.4 b indicating a rise of selling pressure in the market.</div>
<div>
</div>
<div style="text-align: center;">
<img alt="" src="/app/webroot/userfiles/images/Clipboard11%2817%29.jpg" style="width: 800px; height: 377px;" /></div>
<div>
</div>
<div>
<strong>d. Bollinger Bands</strong></div>
<div>
The Bollinger Band is a technical indicator that consists of a moving average (21-day) along with two trading bands above (upper band) and below it (lower band). The bands are an indication of volatility, which are represented by calculating standard deviation.</div>
<div>
At the beginning of the month, NEPSE index retraced back from the upper Bollinger band to the mid Bollinger band. However, at the mid-month, NEPSE showed sideways movement and closed at mid Bollinger band. The distance between upper and lower Bollinger band has decreased indicating a low volatility in the market.</div>
<div>
</div>
<div style="text-align: center;">
<img alt="" src="/app/webroot/userfiles/images/Clipboard12%2816%29.jpg" style="width: 800px; height: 139px;" /></div>
<div>
</div>
<div>
<strong>e. Overview</strong></div>
<div>
NEPSE index gained 21.8 (or up 1.87%) to close at 1187.77 last month. At the beginning of last month, NEPSE index showed bullish momentum by breaching the resistance of 50 days moving average. However, NEPSE index could not breach the 200 days moving average and retraced back forming a shooting star candle. Currently, NEPSE is trading above 50 days moving average and below 200 days moving average. The MACD line crossed the signal line from the below indicating a bullish crossover in the market. Both lines are moving in the positive zone indicating a positive sign in the market. Positive divergence can be seen between the NEPSE and RSI as NEPSE and RSI are forming lower low and lower high. Last month, OBV has decreased by 2.4 b indicating a rise of selling pressure in the market. The distance between upper and lower Bollinger band has decreased indicating a low volatility in the market. The immediate support and resistance stand same at 1150 and 1210 respectively. </div>
<div>
</div>
<div>
</div>
',
'status' => true,
'publish_date' => null,
'created' => '2019-02-15 12:42:48',
'modified' => '2019-02-15 12:45:32',
'keywords' => '',
'description' => '',
'sortorder' => '2353',
'feature_article' => true,
'user_id' => '11',
'image1' => null,
'image2' => null,
'image3' => null,
'image4' => null
),
'MagazineIssue' => array(
'id' => '995',
'image' => '20190214094935_NewBiz_February_Cover Page for web.jpg',
'sortorder' => '1543',
'published' => true,
'created' => '2019-02-11 11:16:33',
'modified' => '2019-02-14 09:49:36',
'title' => 'February 2019',
'publish_date' => '2019-02-01',
'parent_id' => '0',
'homepage' => true,
'user_id' => '11'
),
'MagazineCategory' => array(
'id' => '63',
'title' => 'Stock Taking',
'sortorder' => '516',
'status' => true,
'created' => '0000-00-00 00:00:00',
'homepage' => true,
'modified' => '2013-04-01 00:00:00'
),
'User' => array(
'password' => '*****',
'id' => '11',
'user_detail_id' => '0',
'group_id' => '24',
'username' => 'nsingha@abhiyan.com.np',
'name' => '',
'email' => 'nsingha@abhiyan.com.np',
'address' => '',
'gender' => '',
'access' => '1',
'phone' => '',
'access_type' => '0',
'activated' => false,
'sortorder' => '0',
'published' => '0',
'created' => '2015-04-08 13:22:59',
'last_login' => '2023-04-16 09:29:47',
'ip' => '172.69.77.43'
),
'MagazineArticleComment' => array(),
'MagazineView' => array(
(int) 0 => array(
'magazine_article_id' => '2403',
'hit' => '2540'
)
)
)
$current_user = null
$logged_in = false
$user = null
include - APP/View/MagazineArticles/view.ctp, line 54
View::_evaluate() - CORE/Cake/View/View.php, line 971
View::_render() - CORE/Cake/View/View.php, line 933
View::render() - CORE/Cake/View/View.php, line 473
Controller::render() - CORE/Cake/Controller/Controller.php, line 968
Dispatcher::_invoke() - CORE/Cake/Routing/Dispatcher.php, line 200
Dispatcher::dispatch() - CORE/Cake/Routing/Dispatcher.php, line 167
[main] - APP/webroot/index.php, line 117
Notice (8): Trying to access array offset on value of type null [APP/View/MagazineArticles/view.ctp, line 55]
//find the group of logged user
$groupId = $user['Group']['id'];
$user_id=$user["id"];
$viewFile = '/var/www/html/newbusinessage.com/app/View/MagazineArticles/view.ctp'
$dataForView = array(
'magazineArticle' => array(
'MagazineArticle' => array(
'id' => '2403',
'magazine_issue_id' => '995',
'magazine_category_id' => '63',
'title' => 'Monthly Technical Analysis of Nepse (December 23rd 2018 – January 17th 2019)',
'image' => '20190215124248_Clipboard07.jpg',
'short_content' => 'NEPSE index gained 21.8 (or up 1.87%) to close at 1187.77 last month. At the beginning of last month, NEPSE index showed bullish momentum by breaching the resistance of 50 days moving average. However, NEPSE index could not breach the 200 days moving average and retraced back forming a shooting star candle. Currently, NEPSE is trading above 50 days moving average and below 200 days moving says average.',
'content' => '<div>
<span style="font-size:18px;"><strong>Shooting Star</strong></span></div>
<div>
</div>
<div style="text-align: center;">
<span style="font-size:16px;"><strong><img alt="" src="/app/webroot/userfiles/images/Clipboard05%2815%29.jpg" style="width: 800px; height: 799px;" /></strong></span></div>
<div>
</div>
<div>
<strong style="font-size: 16px;">Trend Analysis</strong></div>
<div>
</div>
<div style="text-align: center;">
<img alt="" src="/app/webroot/userfiles/images/Clipboard08%2816%29.jpg" style="width: 800px; height: 319px;" /></div>
<div>
</div>
<div>
NEPSE index gained 21.8 (or up 1.87%) to close at 1187.77 last month. At the beginning of last month, NEPSE index showed bullish momentum by breaching the resistance of 50 days moving average. However, NEPSE index could not breach the 200 days moving average and retraced back forming a shooting star candle. Currently, NEPSE is trading above 50 days moving average and below 200 days moving says average. The average daily turnover has increased to NPR 45.14 crores from NPR 37.90 crores. Currently, NEPSE is trading above the retracement level of 38.2% of the recent swing from 1109.32 to 1232.74. Since NEPSE is trading above the 38.2% level, NEPSE still shows the presence of bullish sentiment in the market.</div>
<div>
</div>
<div>
<span style="font-size:16px;"><strong>Resistance and Support</strong></span></div>
<div>
</div>
<div style="text-align: center;">
<img alt="" src="/app/webroot/userfiles/images/Clipboard02%2817%29.jpg" style="width: 800px; height: 252px;" /></div>
<div>
</div>
<div>
In course of month, the index broke the resistance level of 1210, reached the high level of 1232.74 and retraced back to the low level of 1170.11. However, at the end of month, NEPSE showed bullish momentum and closed at 1187.77. The average traded volume was higher than the previous month indicating an increased market participation. The immediate support and resistance stand same at 1150 and 1210 respectively.</div>
<div>
</div>
<div>
<span style="font-size:16px;"><strong>Nepse Trend Indicator</strong></span></div>
<div>
<strong>a. MACD</strong></div>
<div>
The MACD is a momentum oscillator formed by using two different types of moving averages, which provides specific buying or selling signals. When a MACD line crosses above the signal line, it is considered to be a positive sign and indicates a time to buy, and vice-versa.</div>
<div>
</div>
<div>
The MACD and the signal line, at the beginning of last month, stood at -6.39 and –12.52 respectively. By the end of the month, MACD line and signal increased by 9.01 and 14.76 to close at 2.62 and 2.25 respectively. The MACD line crossed the signal line from the below indicating a bullish crossover in the market. Both lines are moving in the positive zone indicating a positive sign in the market.</div>
<div>
</div>
<div style="text-align: center;">
<img alt="" src="/app/webroot/userfiles/images/Clipboard09%2813%29.jpg" style="width: 800px; height: 152px;" /></div>
<div>
</div>
<div>
<strong>b. RSI</strong></div>
<div>
RSI is a form of leading indicator that is believed to be most effective during periods of sideways movement. Such indicators may create numerous buy and sell signals that are useful when the market is not clearly trending upwards or downwards.</div>
<div>
</div>
<div>
The RSI at the beginning of the month, stood at 50.19 level. In the course of month, RSI increased by 3.34 points to close at 53.53. Last month, RSI reached the high level of 64 and retraced back to the low level of 46. At the end of month, NEPSE showed some bullish momentum and RSI gained some points to close at 53.53. Positive divergence can be seen between the NEPSE and RSI as NEPSE and RSI are forming lower low and lower high.</div>
<div>
</div>
<div style="text-align: center;">
<img alt="" src="/app/webroot/userfiles/images/Clipboard10%2814%29.jpg" style="width: 800px; height: 138px;" /></div>
<div>
</div>
<div>
<strong>c. (OBV)</strong></div>
<div>
On balance volume is a momentum indicator that uses volume flow to predict changes in stock prices. It measures buying and selling pressure as a cumulative indicator that adds volume in up days and subtracts volume on down days.</div>
<div>
</div>
<div>
On balance volume at the beginning of last month, stood at -9.7 b level. In the course of month, it lost 2.4 b points to close at -12.1 b. Last month, OBV has decreased by 2.4 b indicating a rise of selling pressure in the market.</div>
<div>
</div>
<div style="text-align: center;">
<img alt="" src="/app/webroot/userfiles/images/Clipboard11%2817%29.jpg" style="width: 800px; height: 377px;" /></div>
<div>
</div>
<div>
<strong>d. Bollinger Bands</strong></div>
<div>
The Bollinger Band is a technical indicator that consists of a moving average (21-day) along with two trading bands above (upper band) and below it (lower band). The bands are an indication of volatility, which are represented by calculating standard deviation.</div>
<div>
At the beginning of the month, NEPSE index retraced back from the upper Bollinger band to the mid Bollinger band. However, at the mid-month, NEPSE showed sideways movement and closed at mid Bollinger band. The distance between upper and lower Bollinger band has decreased indicating a low volatility in the market.</div>
<div>
</div>
<div style="text-align: center;">
<img alt="" src="/app/webroot/userfiles/images/Clipboard12%2816%29.jpg" style="width: 800px; height: 139px;" /></div>
<div>
</div>
<div>
<strong>e. Overview</strong></div>
<div>
NEPSE index gained 21.8 (or up 1.87%) to close at 1187.77 last month. At the beginning of last month, NEPSE index showed bullish momentum by breaching the resistance of 50 days moving average. However, NEPSE index could not breach the 200 days moving average and retraced back forming a shooting star candle. Currently, NEPSE is trading above 50 days moving average and below 200 days moving average. The MACD line crossed the signal line from the below indicating a bullish crossover in the market. Both lines are moving in the positive zone indicating a positive sign in the market. Positive divergence can be seen between the NEPSE and RSI as NEPSE and RSI are forming lower low and lower high. Last month, OBV has decreased by 2.4 b indicating a rise of selling pressure in the market. The distance between upper and lower Bollinger band has decreased indicating a low volatility in the market. The immediate support and resistance stand same at 1150 and 1210 respectively. </div>
<div>
</div>
<div>
</div>
',
'status' => true,
'publish_date' => null,
'created' => '2019-02-15 12:42:48',
'modified' => '2019-02-15 12:45:32',
'keywords' => '',
'description' => '',
'sortorder' => '2353',
'feature_article' => true,
'user_id' => '11',
'image1' => null,
'image2' => null,
'image3' => null,
'image4' => null
),
'MagazineIssue' => array(
'id' => '995',
'image' => '20190214094935_NewBiz_February_Cover Page for web.jpg',
'sortorder' => '1543',
'published' => true,
'created' => '2019-02-11 11:16:33',
'modified' => '2019-02-14 09:49:36',
'title' => 'February 2019',
'publish_date' => '2019-02-01',
'parent_id' => '0',
'homepage' => true,
'user_id' => '11'
),
'MagazineCategory' => array(
'id' => '63',
'title' => 'Stock Taking',
'sortorder' => '516',
'status' => true,
'created' => '0000-00-00 00:00:00',
'homepage' => true,
'modified' => '2013-04-01 00:00:00'
),
'User' => array(
'password' => '*****',
'id' => '11',
'user_detail_id' => '0',
'group_id' => '24',
'username' => 'nsingha@abhiyan.com.np',
'name' => '',
'email' => 'nsingha@abhiyan.com.np',
'address' => '',
'gender' => '',
'access' => '1',
'phone' => '',
'access_type' => '0',
'activated' => false,
'sortorder' => '0',
'published' => '0',
'created' => '2015-04-08 13:22:59',
'last_login' => '2023-04-16 09:29:47',
'ip' => '172.69.77.43'
),
'MagazineArticleComment' => array(),
'MagazineView' => array(
(int) 0 => array(
[maximum depth reached]
)
)
),
'current_user' => null,
'logged_in' => false
)
$magazineArticle = array(
'MagazineArticle' => array(
'id' => '2403',
'magazine_issue_id' => '995',
'magazine_category_id' => '63',
'title' => 'Monthly Technical Analysis of Nepse (December 23rd 2018 – January 17th 2019)',
'image' => '20190215124248_Clipboard07.jpg',
'short_content' => 'NEPSE index gained 21.8 (or up 1.87%) to close at 1187.77 last month. At the beginning of last month, NEPSE index showed bullish momentum by breaching the resistance of 50 days moving average. However, NEPSE index could not breach the 200 days moving average and retraced back forming a shooting star candle. Currently, NEPSE is trading above 50 days moving average and below 200 days moving says average.',
'content' => '<div>
<span style="font-size:18px;"><strong>Shooting Star</strong></span></div>
<div>
</div>
<div style="text-align: center;">
<span style="font-size:16px;"><strong><img alt="" src="/app/webroot/userfiles/images/Clipboard05%2815%29.jpg" style="width: 800px; height: 799px;" /></strong></span></div>
<div>
</div>
<div>
<strong style="font-size: 16px;">Trend Analysis</strong></div>
<div>
</div>
<div style="text-align: center;">
<img alt="" src="/app/webroot/userfiles/images/Clipboard08%2816%29.jpg" style="width: 800px; height: 319px;" /></div>
<div>
</div>
<div>
NEPSE index gained 21.8 (or up 1.87%) to close at 1187.77 last month. At the beginning of last month, NEPSE index showed bullish momentum by breaching the resistance of 50 days moving average. However, NEPSE index could not breach the 200 days moving average and retraced back forming a shooting star candle. Currently, NEPSE is trading above 50 days moving average and below 200 days moving says average. The average daily turnover has increased to NPR 45.14 crores from NPR 37.90 crores. Currently, NEPSE is trading above the retracement level of 38.2% of the recent swing from 1109.32 to 1232.74. Since NEPSE is trading above the 38.2% level, NEPSE still shows the presence of bullish sentiment in the market.</div>
<div>
</div>
<div>
<span style="font-size:16px;"><strong>Resistance and Support</strong></span></div>
<div>
</div>
<div style="text-align: center;">
<img alt="" src="/app/webroot/userfiles/images/Clipboard02%2817%29.jpg" style="width: 800px; height: 252px;" /></div>
<div>
</div>
<div>
In course of month, the index broke the resistance level of 1210, reached the high level of 1232.74 and retraced back to the low level of 1170.11. However, at the end of month, NEPSE showed bullish momentum and closed at 1187.77. The average traded volume was higher than the previous month indicating an increased market participation. The immediate support and resistance stand same at 1150 and 1210 respectively.</div>
<div>
</div>
<div>
<span style="font-size:16px;"><strong>Nepse Trend Indicator</strong></span></div>
<div>
<strong>a. MACD</strong></div>
<div>
The MACD is a momentum oscillator formed by using two different types of moving averages, which provides specific buying or selling signals. When a MACD line crosses above the signal line, it is considered to be a positive sign and indicates a time to buy, and vice-versa.</div>
<div>
</div>
<div>
The MACD and the signal line, at the beginning of last month, stood at -6.39 and –12.52 respectively. By the end of the month, MACD line and signal increased by 9.01 and 14.76 to close at 2.62 and 2.25 respectively. The MACD line crossed the signal line from the below indicating a bullish crossover in the market. Both lines are moving in the positive zone indicating a positive sign in the market.</div>
<div>
</div>
<div style="text-align: center;">
<img alt="" src="/app/webroot/userfiles/images/Clipboard09%2813%29.jpg" style="width: 800px; height: 152px;" /></div>
<div>
</div>
<div>
<strong>b. RSI</strong></div>
<div>
RSI is a form of leading indicator that is believed to be most effective during periods of sideways movement. Such indicators may create numerous buy and sell signals that are useful when the market is not clearly trending upwards or downwards.</div>
<div>
</div>
<div>
The RSI at the beginning of the month, stood at 50.19 level. In the course of month, RSI increased by 3.34 points to close at 53.53. Last month, RSI reached the high level of 64 and retraced back to the low level of 46. At the end of month, NEPSE showed some bullish momentum and RSI gained some points to close at 53.53. Positive divergence can be seen between the NEPSE and RSI as NEPSE and RSI are forming lower low and lower high.</div>
<div>
</div>
<div style="text-align: center;">
<img alt="" src="/app/webroot/userfiles/images/Clipboard10%2814%29.jpg" style="width: 800px; height: 138px;" /></div>
<div>
</div>
<div>
<strong>c. (OBV)</strong></div>
<div>
On balance volume is a momentum indicator that uses volume flow to predict changes in stock prices. It measures buying and selling pressure as a cumulative indicator that adds volume in up days and subtracts volume on down days.</div>
<div>
</div>
<div>
On balance volume at the beginning of last month, stood at -9.7 b level. In the course of month, it lost 2.4 b points to close at -12.1 b. Last month, OBV has decreased by 2.4 b indicating a rise of selling pressure in the market.</div>
<div>
</div>
<div style="text-align: center;">
<img alt="" src="/app/webroot/userfiles/images/Clipboard11%2817%29.jpg" style="width: 800px; height: 377px;" /></div>
<div>
</div>
<div>
<strong>d. Bollinger Bands</strong></div>
<div>
The Bollinger Band is a technical indicator that consists of a moving average (21-day) along with two trading bands above (upper band) and below it (lower band). The bands are an indication of volatility, which are represented by calculating standard deviation.</div>
<div>
At the beginning of the month, NEPSE index retraced back from the upper Bollinger band to the mid Bollinger band. However, at the mid-month, NEPSE showed sideways movement and closed at mid Bollinger band. The distance between upper and lower Bollinger band has decreased indicating a low volatility in the market.</div>
<div>
</div>
<div style="text-align: center;">
<img alt="" src="/app/webroot/userfiles/images/Clipboard12%2816%29.jpg" style="width: 800px; height: 139px;" /></div>
<div>
</div>
<div>
<strong>e. Overview</strong></div>
<div>
NEPSE index gained 21.8 (or up 1.87%) to close at 1187.77 last month. At the beginning of last month, NEPSE index showed bullish momentum by breaching the resistance of 50 days moving average. However, NEPSE index could not breach the 200 days moving average and retraced back forming a shooting star candle. Currently, NEPSE is trading above 50 days moving average and below 200 days moving average. The MACD line crossed the signal line from the below indicating a bullish crossover in the market. Both lines are moving in the positive zone indicating a positive sign in the market. Positive divergence can be seen between the NEPSE and RSI as NEPSE and RSI are forming lower low and lower high. Last month, OBV has decreased by 2.4 b indicating a rise of selling pressure in the market. The distance between upper and lower Bollinger band has decreased indicating a low volatility in the market. The immediate support and resistance stand same at 1150 and 1210 respectively. </div>
<div>
</div>
<div>
</div>
',
'status' => true,
'publish_date' => null,
'created' => '2019-02-15 12:42:48',
'modified' => '2019-02-15 12:45:32',
'keywords' => '',
'description' => '',
'sortorder' => '2353',
'feature_article' => true,
'user_id' => '11',
'image1' => null,
'image2' => null,
'image3' => null,
'image4' => null
),
'MagazineIssue' => array(
'id' => '995',
'image' => '20190214094935_NewBiz_February_Cover Page for web.jpg',
'sortorder' => '1543',
'published' => true,
'created' => '2019-02-11 11:16:33',
'modified' => '2019-02-14 09:49:36',
'title' => 'February 2019',
'publish_date' => '2019-02-01',
'parent_id' => '0',
'homepage' => true,
'user_id' => '11'
),
'MagazineCategory' => array(
'id' => '63',
'title' => 'Stock Taking',
'sortorder' => '516',
'status' => true,
'created' => '0000-00-00 00:00:00',
'homepage' => true,
'modified' => '2013-04-01 00:00:00'
),
'User' => array(
'password' => '*****',
'id' => '11',
'user_detail_id' => '0',
'group_id' => '24',
'username' => 'nsingha@abhiyan.com.np',
'name' => '',
'email' => 'nsingha@abhiyan.com.np',
'address' => '',
'gender' => '',
'access' => '1',
'phone' => '',
'access_type' => '0',
'activated' => false,
'sortorder' => '0',
'published' => '0',
'created' => '2015-04-08 13:22:59',
'last_login' => '2023-04-16 09:29:47',
'ip' => '172.69.77.43'
),
'MagazineArticleComment' => array(),
'MagazineView' => array(
(int) 0 => array(
'magazine_article_id' => '2403',
'hit' => '2540'
)
)
)
$current_user = null
$logged_in = false
$user = null
$groupId = null
include - APP/View/MagazineArticles/view.ctp, line 55
View::_evaluate() - CORE/Cake/View/View.php, line 971
View::_render() - CORE/Cake/View/View.php, line 933
View::render() - CORE/Cake/View/View.php, line 473
Controller::render() - CORE/Cake/Controller/Controller.php, line 968
Dispatcher::_invoke() - CORE/Cake/Routing/Dispatcher.php, line 200
Dispatcher::dispatch() - CORE/Cake/Routing/Dispatcher.php, line 167
[main] - APP/webroot/index.php, line 117
Notice (8): Undefined index: summary [APP/View/MagazineArticles/view.ctp, line 62]
$viewFile = '/var/www/html/newbusinessage.com/app/View/MagazineArticles/view.ctp'
$dataForView = array(
'magazineArticle' => array(
'MagazineArticle' => array(
'id' => '2403',
'magazine_issue_id' => '995',
'magazine_category_id' => '63',
'title' => 'Monthly Technical Analysis of Nepse (December 23rd 2018 – January 17th 2019)',
'image' => '20190215124248_Clipboard07.jpg',
'short_content' => 'NEPSE index gained 21.8 (or up 1.87%) to close at 1187.77 last month. At the beginning of last month, NEPSE index showed bullish momentum by breaching the resistance of 50 days moving average. However, NEPSE index could not breach the 200 days moving average and retraced back forming a shooting star candle. Currently, NEPSE is trading above 50 days moving average and below 200 days moving says average.',
'content' => '<div>
<span style="font-size:18px;"><strong>Shooting Star</strong></span></div>
<div>
</div>
<div style="text-align: center;">
<span style="font-size:16px;"><strong><img alt="" src="/app/webroot/userfiles/images/Clipboard05%2815%29.jpg" style="width: 800px; height: 799px;" /></strong></span></div>
<div>
</div>
<div>
<strong style="font-size: 16px;">Trend Analysis</strong></div>
<div>
</div>
<div style="text-align: center;">
<img alt="" src="/app/webroot/userfiles/images/Clipboard08%2816%29.jpg" style="width: 800px; height: 319px;" /></div>
<div>
</div>
<div>
NEPSE index gained 21.8 (or up 1.87%) to close at 1187.77 last month. At the beginning of last month, NEPSE index showed bullish momentum by breaching the resistance of 50 days moving average. However, NEPSE index could not breach the 200 days moving average and retraced back forming a shooting star candle. Currently, NEPSE is trading above 50 days moving average and below 200 days moving says average. The average daily turnover has increased to NPR 45.14 crores from NPR 37.90 crores. Currently, NEPSE is trading above the retracement level of 38.2% of the recent swing from 1109.32 to 1232.74. Since NEPSE is trading above the 38.2% level, NEPSE still shows the presence of bullish sentiment in the market.</div>
<div>
</div>
<div>
<span style="font-size:16px;"><strong>Resistance and Support</strong></span></div>
<div>
</div>
<div style="text-align: center;">
<img alt="" src="/app/webroot/userfiles/images/Clipboard02%2817%29.jpg" style="width: 800px; height: 252px;" /></div>
<div>
</div>
<div>
In course of month, the index broke the resistance level of 1210, reached the high level of 1232.74 and retraced back to the low level of 1170.11. However, at the end of month, NEPSE showed bullish momentum and closed at 1187.77. The average traded volume was higher than the previous month indicating an increased market participation. The immediate support and resistance stand same at 1150 and 1210 respectively.</div>
<div>
</div>
<div>
<span style="font-size:16px;"><strong>Nepse Trend Indicator</strong></span></div>
<div>
<strong>a. MACD</strong></div>
<div>
The MACD is a momentum oscillator formed by using two different types of moving averages, which provides specific buying or selling signals. When a MACD line crosses above the signal line, it is considered to be a positive sign and indicates a time to buy, and vice-versa.</div>
<div>
</div>
<div>
The MACD and the signal line, at the beginning of last month, stood at -6.39 and –12.52 respectively. By the end of the month, MACD line and signal increased by 9.01 and 14.76 to close at 2.62 and 2.25 respectively. The MACD line crossed the signal line from the below indicating a bullish crossover in the market. Both lines are moving in the positive zone indicating a positive sign in the market.</div>
<div>
</div>
<div style="text-align: center;">
<img alt="" src="/app/webroot/userfiles/images/Clipboard09%2813%29.jpg" style="width: 800px; height: 152px;" /></div>
<div>
</div>
<div>
<strong>b. RSI</strong></div>
<div>
RSI is a form of leading indicator that is believed to be most effective during periods of sideways movement. Such indicators may create numerous buy and sell signals that are useful when the market is not clearly trending upwards or downwards.</div>
<div>
</div>
<div>
The RSI at the beginning of the month, stood at 50.19 level. In the course of month, RSI increased by 3.34 points to close at 53.53. Last month, RSI reached the high level of 64 and retraced back to the low level of 46. At the end of month, NEPSE showed some bullish momentum and RSI gained some points to close at 53.53. Positive divergence can be seen between the NEPSE and RSI as NEPSE and RSI are forming lower low and lower high.</div>
<div>
</div>
<div style="text-align: center;">
<img alt="" src="/app/webroot/userfiles/images/Clipboard10%2814%29.jpg" style="width: 800px; height: 138px;" /></div>
<div>
</div>
<div>
<strong>c. (OBV)</strong></div>
<div>
On balance volume is a momentum indicator that uses volume flow to predict changes in stock prices. It measures buying and selling pressure as a cumulative indicator that adds volume in up days and subtracts volume on down days.</div>
<div>
</div>
<div>
On balance volume at the beginning of last month, stood at -9.7 b level. In the course of month, it lost 2.4 b points to close at -12.1 b. Last month, OBV has decreased by 2.4 b indicating a rise of selling pressure in the market.</div>
<div>
</div>
<div style="text-align: center;">
<img alt="" src="/app/webroot/userfiles/images/Clipboard11%2817%29.jpg" style="width: 800px; height: 377px;" /></div>
<div>
</div>
<div>
<strong>d. Bollinger Bands</strong></div>
<div>
The Bollinger Band is a technical indicator that consists of a moving average (21-day) along with two trading bands above (upper band) and below it (lower band). The bands are an indication of volatility, which are represented by calculating standard deviation.</div>
<div>
At the beginning of the month, NEPSE index retraced back from the upper Bollinger band to the mid Bollinger band. However, at the mid-month, NEPSE showed sideways movement and closed at mid Bollinger band. The distance between upper and lower Bollinger band has decreased indicating a low volatility in the market.</div>
<div>
</div>
<div style="text-align: center;">
<img alt="" src="/app/webroot/userfiles/images/Clipboard12%2816%29.jpg" style="width: 800px; height: 139px;" /></div>
<div>
</div>
<div>
<strong>e. Overview</strong></div>
<div>
NEPSE index gained 21.8 (or up 1.87%) to close at 1187.77 last month. At the beginning of last month, NEPSE index showed bullish momentum by breaching the resistance of 50 days moving average. However, NEPSE index could not breach the 200 days moving average and retraced back forming a shooting star candle. Currently, NEPSE is trading above 50 days moving average and below 200 days moving average. The MACD line crossed the signal line from the below indicating a bullish crossover in the market. Both lines are moving in the positive zone indicating a positive sign in the market. Positive divergence can be seen between the NEPSE and RSI as NEPSE and RSI are forming lower low and lower high. Last month, OBV has decreased by 2.4 b indicating a rise of selling pressure in the market. The distance between upper and lower Bollinger band has decreased indicating a low volatility in the market. The immediate support and resistance stand same at 1150 and 1210 respectively. </div>
<div>
</div>
<div>
</div>
',
'status' => true,
'publish_date' => null,
'created' => '2019-02-15 12:42:48',
'modified' => '2019-02-15 12:45:32',
'keywords' => '',
'description' => '',
'sortorder' => '2353',
'feature_article' => true,
'user_id' => '11',
'image1' => null,
'image2' => null,
'image3' => null,
'image4' => null
),
'MagazineIssue' => array(
'id' => '995',
'image' => '20190214094935_NewBiz_February_Cover Page for web.jpg',
'sortorder' => '1543',
'published' => true,
'created' => '2019-02-11 11:16:33',
'modified' => '2019-02-14 09:49:36',
'title' => 'February 2019',
'publish_date' => '2019-02-01',
'parent_id' => '0',
'homepage' => true,
'user_id' => '11'
),
'MagazineCategory' => array(
'id' => '63',
'title' => 'Stock Taking',
'sortorder' => '516',
'status' => true,
'created' => '0000-00-00 00:00:00',
'homepage' => true,
'modified' => '2013-04-01 00:00:00'
),
'User' => array(
'password' => '*****',
'id' => '11',
'user_detail_id' => '0',
'group_id' => '24',
'username' => 'nsingha@abhiyan.com.np',
'name' => '',
'email' => 'nsingha@abhiyan.com.np',
'address' => '',
'gender' => '',
'access' => '1',
'phone' => '',
'access_type' => '0',
'activated' => false,
'sortorder' => '0',
'published' => '0',
'created' => '2015-04-08 13:22:59',
'last_login' => '2023-04-16 09:29:47',
'ip' => '172.69.77.43'
),
'MagazineArticleComment' => array(),
'MagazineView' => array(
(int) 0 => array(
[maximum depth reached]
)
)
),
'current_user' => null,
'logged_in' => false
)
$magazineArticle = array(
'MagazineArticle' => array(
'id' => '2403',
'magazine_issue_id' => '995',
'magazine_category_id' => '63',
'title' => 'Monthly Technical Analysis of Nepse (December 23rd 2018 – January 17th 2019)',
'image' => '20190215124248_Clipboard07.jpg',
'short_content' => 'NEPSE index gained 21.8 (or up 1.87%) to close at 1187.77 last month. At the beginning of last month, NEPSE index showed bullish momentum by breaching the resistance of 50 days moving average. However, NEPSE index could not breach the 200 days moving average and retraced back forming a shooting star candle. Currently, NEPSE is trading above 50 days moving average and below 200 days moving says average.',
'content' => '<div>
<span style="font-size:18px;"><strong>Shooting Star</strong></span></div>
<div>
</div>
<div style="text-align: center;">
<span style="font-size:16px;"><strong><img alt="" src="/app/webroot/userfiles/images/Clipboard05%2815%29.jpg" style="width: 800px; height: 799px;" /></strong></span></div>
<div>
</div>
<div>
<strong style="font-size: 16px;">Trend Analysis</strong></div>
<div>
</div>
<div style="text-align: center;">
<img alt="" src="/app/webroot/userfiles/images/Clipboard08%2816%29.jpg" style="width: 800px; height: 319px;" /></div>
<div>
</div>
<div>
NEPSE index gained 21.8 (or up 1.87%) to close at 1187.77 last month. At the beginning of last month, NEPSE index showed bullish momentum by breaching the resistance of 50 days moving average. However, NEPSE index could not breach the 200 days moving average and retraced back forming a shooting star candle. Currently, NEPSE is trading above 50 days moving average and below 200 days moving says average. The average daily turnover has increased to NPR 45.14 crores from NPR 37.90 crores. Currently, NEPSE is trading above the retracement level of 38.2% of the recent swing from 1109.32 to 1232.74. Since NEPSE is trading above the 38.2% level, NEPSE still shows the presence of bullish sentiment in the market.</div>
<div>
</div>
<div>
<span style="font-size:16px;"><strong>Resistance and Support</strong></span></div>
<div>
</div>
<div style="text-align: center;">
<img alt="" src="/app/webroot/userfiles/images/Clipboard02%2817%29.jpg" style="width: 800px; height: 252px;" /></div>
<div>
</div>
<div>
In course of month, the index broke the resistance level of 1210, reached the high level of 1232.74 and retraced back to the low level of 1170.11. However, at the end of month, NEPSE showed bullish momentum and closed at 1187.77. The average traded volume was higher than the previous month indicating an increased market participation. The immediate support and resistance stand same at 1150 and 1210 respectively.</div>
<div>
</div>
<div>
<span style="font-size:16px;"><strong>Nepse Trend Indicator</strong></span></div>
<div>
<strong>a. MACD</strong></div>
<div>
The MACD is a momentum oscillator formed by using two different types of moving averages, which provides specific buying or selling signals. When a MACD line crosses above the signal line, it is considered to be a positive sign and indicates a time to buy, and vice-versa.</div>
<div>
</div>
<div>
The MACD and the signal line, at the beginning of last month, stood at -6.39 and –12.52 respectively. By the end of the month, MACD line and signal increased by 9.01 and 14.76 to close at 2.62 and 2.25 respectively. The MACD line crossed the signal line from the below indicating a bullish crossover in the market. Both lines are moving in the positive zone indicating a positive sign in the market.</div>
<div>
</div>
<div style="text-align: center;">
<img alt="" src="/app/webroot/userfiles/images/Clipboard09%2813%29.jpg" style="width: 800px; height: 152px;" /></div>
<div>
</div>
<div>
<strong>b. RSI</strong></div>
<div>
RSI is a form of leading indicator that is believed to be most effective during periods of sideways movement. Such indicators may create numerous buy and sell signals that are useful when the market is not clearly trending upwards or downwards.</div>
<div>
</div>
<div>
The RSI at the beginning of the month, stood at 50.19 level. In the course of month, RSI increased by 3.34 points to close at 53.53. Last month, RSI reached the high level of 64 and retraced back to the low level of 46. At the end of month, NEPSE showed some bullish momentum and RSI gained some points to close at 53.53. Positive divergence can be seen between the NEPSE and RSI as NEPSE and RSI are forming lower low and lower high.</div>
<div>
</div>
<div style="text-align: center;">
<img alt="" src="/app/webroot/userfiles/images/Clipboard10%2814%29.jpg" style="width: 800px; height: 138px;" /></div>
<div>
</div>
<div>
<strong>c. (OBV)</strong></div>
<div>
On balance volume is a momentum indicator that uses volume flow to predict changes in stock prices. It measures buying and selling pressure as a cumulative indicator that adds volume in up days and subtracts volume on down days.</div>
<div>
</div>
<div>
On balance volume at the beginning of last month, stood at -9.7 b level. In the course of month, it lost 2.4 b points to close at -12.1 b. Last month, OBV has decreased by 2.4 b indicating a rise of selling pressure in the market.</div>
<div>
</div>
<div style="text-align: center;">
<img alt="" src="/app/webroot/userfiles/images/Clipboard11%2817%29.jpg" style="width: 800px; height: 377px;" /></div>
<div>
</div>
<div>
<strong>d. Bollinger Bands</strong></div>
<div>
The Bollinger Band is a technical indicator that consists of a moving average (21-day) along with two trading bands above (upper band) and below it (lower band). The bands are an indication of volatility, which are represented by calculating standard deviation.</div>
<div>
At the beginning of the month, NEPSE index retraced back from the upper Bollinger band to the mid Bollinger band. However, at the mid-month, NEPSE showed sideways movement and closed at mid Bollinger band. The distance between upper and lower Bollinger band has decreased indicating a low volatility in the market.</div>
<div>
</div>
<div style="text-align: center;">
<img alt="" src="/app/webroot/userfiles/images/Clipboard12%2816%29.jpg" style="width: 800px; height: 139px;" /></div>
<div>
</div>
<div>
<strong>e. Overview</strong></div>
<div>
NEPSE index gained 21.8 (or up 1.87%) to close at 1187.77 last month. At the beginning of last month, NEPSE index showed bullish momentum by breaching the resistance of 50 days moving average. However, NEPSE index could not breach the 200 days moving average and retraced back forming a shooting star candle. Currently, NEPSE is trading above 50 days moving average and below 200 days moving average. The MACD line crossed the signal line from the below indicating a bullish crossover in the market. Both lines are moving in the positive zone indicating a positive sign in the market. Positive divergence can be seen between the NEPSE and RSI as NEPSE and RSI are forming lower low and lower high. Last month, OBV has decreased by 2.4 b indicating a rise of selling pressure in the market. The distance between upper and lower Bollinger band has decreased indicating a low volatility in the market. The immediate support and resistance stand same at 1150 and 1210 respectively. </div>
<div>
</div>
<div>
</div>
',
'status' => true,
'publish_date' => null,
'created' => '2019-02-15 12:42:48',
'modified' => '2019-02-15 12:45:32',
'keywords' => '',
'description' => '',
'sortorder' => '2353',
'feature_article' => true,
'user_id' => '11',
'image1' => null,
'image2' => null,
'image3' => null,
'image4' => null
),
'MagazineIssue' => array(
'id' => '995',
'image' => '20190214094935_NewBiz_February_Cover Page for web.jpg',
'sortorder' => '1543',
'published' => true,
'created' => '2019-02-11 11:16:33',
'modified' => '2019-02-14 09:49:36',
'title' => 'February 2019',
'publish_date' => '2019-02-01',
'parent_id' => '0',
'homepage' => true,
'user_id' => '11'
),
'MagazineCategory' => array(
'id' => '63',
'title' => 'Stock Taking',
'sortorder' => '516',
'status' => true,
'created' => '0000-00-00 00:00:00',
'homepage' => true,
'modified' => '2013-04-01 00:00:00'
),
'User' => array(
'password' => '*****',
'id' => '11',
'user_detail_id' => '0',
'group_id' => '24',
'username' => 'nsingha@abhiyan.com.np',
'name' => '',
'email' => 'nsingha@abhiyan.com.np',
'address' => '',
'gender' => '',
'access' => '1',
'phone' => '',
'access_type' => '0',
'activated' => false,
'sortorder' => '0',
'published' => '0',
'created' => '2015-04-08 13:22:59',
'last_login' => '2023-04-16 09:29:47',
'ip' => '172.69.77.43'
),
'MagazineArticleComment' => array(),
'MagazineView' => array(
(int) 0 => array(
'magazine_article_id' => '2403',
'hit' => '2540'
)
)
)
$current_user = null
$logged_in = false
$user = null
$groupId = null
$user_id = null
include - APP/View/MagazineArticles/view.ctp, line 62
View::_evaluate() - CORE/Cake/View/View.php, line 971
View::_render() - CORE/Cake/View/View.php, line 933
View::render() - CORE/Cake/View/View.php, line 473
Controller::render() - CORE/Cake/Controller/Controller.php, line 968
Dispatcher::_invoke() - CORE/Cake/Routing/Dispatcher.php, line 200
Dispatcher::dispatch() - CORE/Cake/Routing/Dispatcher.php, line 167
[main] - APP/webroot/index.php, line 117
Notice (8): Undefined index: summary [APP/View/MagazineArticles/view.ctp, line 68]
$viewFile = '/var/www/html/newbusinessage.com/app/View/MagazineArticles/view.ctp'
$dataForView = array(
'magazineArticle' => array(
'MagazineArticle' => array(
'id' => '2403',
'magazine_issue_id' => '995',
'magazine_category_id' => '63',
'title' => 'Monthly Technical Analysis of Nepse (December 23rd 2018 – January 17th 2019)',
'image' => '20190215124248_Clipboard07.jpg',
'short_content' => 'NEPSE index gained 21.8 (or up 1.87%) to close at 1187.77 last month. At the beginning of last month, NEPSE index showed bullish momentum by breaching the resistance of 50 days moving average. However, NEPSE index could not breach the 200 days moving average and retraced back forming a shooting star candle. Currently, NEPSE is trading above 50 days moving average and below 200 days moving says average.',
'content' => '<div>
<span style="font-size:18px;"><strong>Shooting Star</strong></span></div>
<div>
</div>
<div style="text-align: center;">
<span style="font-size:16px;"><strong><img alt="" src="/app/webroot/userfiles/images/Clipboard05%2815%29.jpg" style="width: 800px; height: 799px;" /></strong></span></div>
<div>
</div>
<div>
<strong style="font-size: 16px;">Trend Analysis</strong></div>
<div>
</div>
<div style="text-align: center;">
<img alt="" src="/app/webroot/userfiles/images/Clipboard08%2816%29.jpg" style="width: 800px; height: 319px;" /></div>
<div>
</div>
<div>
NEPSE index gained 21.8 (or up 1.87%) to close at 1187.77 last month. At the beginning of last month, NEPSE index showed bullish momentum by breaching the resistance of 50 days moving average. However, NEPSE index could not breach the 200 days moving average and retraced back forming a shooting star candle. Currently, NEPSE is trading above 50 days moving average and below 200 days moving says average. The average daily turnover has increased to NPR 45.14 crores from NPR 37.90 crores. Currently, NEPSE is trading above the retracement level of 38.2% of the recent swing from 1109.32 to 1232.74. Since NEPSE is trading above the 38.2% level, NEPSE still shows the presence of bullish sentiment in the market.</div>
<div>
</div>
<div>
<span style="font-size:16px;"><strong>Resistance and Support</strong></span></div>
<div>
</div>
<div style="text-align: center;">
<img alt="" src="/app/webroot/userfiles/images/Clipboard02%2817%29.jpg" style="width: 800px; height: 252px;" /></div>
<div>
</div>
<div>
In course of month, the index broke the resistance level of 1210, reached the high level of 1232.74 and retraced back to the low level of 1170.11. However, at the end of month, NEPSE showed bullish momentum and closed at 1187.77. The average traded volume was higher than the previous month indicating an increased market participation. The immediate support and resistance stand same at 1150 and 1210 respectively.</div>
<div>
</div>
<div>
<span style="font-size:16px;"><strong>Nepse Trend Indicator</strong></span></div>
<div>
<strong>a. MACD</strong></div>
<div>
The MACD is a momentum oscillator formed by using two different types of moving averages, which provides specific buying or selling signals. When a MACD line crosses above the signal line, it is considered to be a positive sign and indicates a time to buy, and vice-versa.</div>
<div>
</div>
<div>
The MACD and the signal line, at the beginning of last month, stood at -6.39 and –12.52 respectively. By the end of the month, MACD line and signal increased by 9.01 and 14.76 to close at 2.62 and 2.25 respectively. The MACD line crossed the signal line from the below indicating a bullish crossover in the market. Both lines are moving in the positive zone indicating a positive sign in the market.</div>
<div>
</div>
<div style="text-align: center;">
<img alt="" src="/app/webroot/userfiles/images/Clipboard09%2813%29.jpg" style="width: 800px; height: 152px;" /></div>
<div>
</div>
<div>
<strong>b. RSI</strong></div>
<div>
RSI is a form of leading indicator that is believed to be most effective during periods of sideways movement. Such indicators may create numerous buy and sell signals that are useful when the market is not clearly trending upwards or downwards.</div>
<div>
</div>
<div>
The RSI at the beginning of the month, stood at 50.19 level. In the course of month, RSI increased by 3.34 points to close at 53.53. Last month, RSI reached the high level of 64 and retraced back to the low level of 46. At the end of month, NEPSE showed some bullish momentum and RSI gained some points to close at 53.53. Positive divergence can be seen between the NEPSE and RSI as NEPSE and RSI are forming lower low and lower high.</div>
<div>
</div>
<div style="text-align: center;">
<img alt="" src="/app/webroot/userfiles/images/Clipboard10%2814%29.jpg" style="width: 800px; height: 138px;" /></div>
<div>
</div>
<div>
<strong>c. (OBV)</strong></div>
<div>
On balance volume is a momentum indicator that uses volume flow to predict changes in stock prices. It measures buying and selling pressure as a cumulative indicator that adds volume in up days and subtracts volume on down days.</div>
<div>
</div>
<div>
On balance volume at the beginning of last month, stood at -9.7 b level. In the course of month, it lost 2.4 b points to close at -12.1 b. Last month, OBV has decreased by 2.4 b indicating a rise of selling pressure in the market.</div>
<div>
</div>
<div style="text-align: center;">
<img alt="" src="/app/webroot/userfiles/images/Clipboard11%2817%29.jpg" style="width: 800px; height: 377px;" /></div>
<div>
</div>
<div>
<strong>d. Bollinger Bands</strong></div>
<div>
The Bollinger Band is a technical indicator that consists of a moving average (21-day) along with two trading bands above (upper band) and below it (lower band). The bands are an indication of volatility, which are represented by calculating standard deviation.</div>
<div>
At the beginning of the month, NEPSE index retraced back from the upper Bollinger band to the mid Bollinger band. However, at the mid-month, NEPSE showed sideways movement and closed at mid Bollinger band. The distance between upper and lower Bollinger band has decreased indicating a low volatility in the market.</div>
<div>
</div>
<div style="text-align: center;">
<img alt="" src="/app/webroot/userfiles/images/Clipboard12%2816%29.jpg" style="width: 800px; height: 139px;" /></div>
<div>
</div>
<div>
<strong>e. Overview</strong></div>
<div>
NEPSE index gained 21.8 (or up 1.87%) to close at 1187.77 last month. At the beginning of last month, NEPSE index showed bullish momentum by breaching the resistance of 50 days moving average. However, NEPSE index could not breach the 200 days moving average and retraced back forming a shooting star candle. Currently, NEPSE is trading above 50 days moving average and below 200 days moving average. The MACD line crossed the signal line from the below indicating a bullish crossover in the market. Both lines are moving in the positive zone indicating a positive sign in the market. Positive divergence can be seen between the NEPSE and RSI as NEPSE and RSI are forming lower low and lower high. Last month, OBV has decreased by 2.4 b indicating a rise of selling pressure in the market. The distance between upper and lower Bollinger band has decreased indicating a low volatility in the market. The immediate support and resistance stand same at 1150 and 1210 respectively. </div>
<div>
</div>
<div>
</div>
',
'status' => true,
'publish_date' => null,
'created' => '2019-02-15 12:42:48',
'modified' => '2019-02-15 12:45:32',
'keywords' => '',
'description' => '',
'sortorder' => '2353',
'feature_article' => true,
'user_id' => '11',
'image1' => null,
'image2' => null,
'image3' => null,
'image4' => null
),
'MagazineIssue' => array(
'id' => '995',
'image' => '20190214094935_NewBiz_February_Cover Page for web.jpg',
'sortorder' => '1543',
'published' => true,
'created' => '2019-02-11 11:16:33',
'modified' => '2019-02-14 09:49:36',
'title' => 'February 2019',
'publish_date' => '2019-02-01',
'parent_id' => '0',
'homepage' => true,
'user_id' => '11'
),
'MagazineCategory' => array(
'id' => '63',
'title' => 'Stock Taking',
'sortorder' => '516',
'status' => true,
'created' => '0000-00-00 00:00:00',
'homepage' => true,
'modified' => '2013-04-01 00:00:00'
),
'User' => array(
'password' => '*****',
'id' => '11',
'user_detail_id' => '0',
'group_id' => '24',
'username' => 'nsingha@abhiyan.com.np',
'name' => '',
'email' => 'nsingha@abhiyan.com.np',
'address' => '',
'gender' => '',
'access' => '1',
'phone' => '',
'access_type' => '0',
'activated' => false,
'sortorder' => '0',
'published' => '0',
'created' => '2015-04-08 13:22:59',
'last_login' => '2023-04-16 09:29:47',
'ip' => '172.69.77.43'
),
'MagazineArticleComment' => array(),
'MagazineView' => array(
(int) 0 => array(
[maximum depth reached]
)
)
),
'current_user' => null,
'logged_in' => false
)
$magazineArticle = array(
'MagazineArticle' => array(
'id' => '2403',
'magazine_issue_id' => '995',
'magazine_category_id' => '63',
'title' => 'Monthly Technical Analysis of Nepse (December 23rd 2018 – January 17th 2019)',
'image' => '20190215124248_Clipboard07.jpg',
'short_content' => 'NEPSE index gained 21.8 (or up 1.87%) to close at 1187.77 last month. At the beginning of last month, NEPSE index showed bullish momentum by breaching the resistance of 50 days moving average. However, NEPSE index could not breach the 200 days moving average and retraced back forming a shooting star candle. Currently, NEPSE is trading above 50 days moving average and below 200 days moving says average.',
'content' => '<div>
<span style="font-size:18px;"><strong>Shooting Star</strong></span></div>
<div>
</div>
<div style="text-align: center;">
<span style="font-size:16px;"><strong><img alt="" src="/app/webroot/userfiles/images/Clipboard05%2815%29.jpg" style="width: 800px; height: 799px;" /></strong></span></div>
<div>
</div>
<div>
<strong style="font-size: 16px;">Trend Analysis</strong></div>
<div>
</div>
<div style="text-align: center;">
<img alt="" src="/app/webroot/userfiles/images/Clipboard08%2816%29.jpg" style="width: 800px; height: 319px;" /></div>
<div>
</div>
<div>
NEPSE index gained 21.8 (or up 1.87%) to close at 1187.77 last month. At the beginning of last month, NEPSE index showed bullish momentum by breaching the resistance of 50 days moving average. However, NEPSE index could not breach the 200 days moving average and retraced back forming a shooting star candle. Currently, NEPSE is trading above 50 days moving average and below 200 days moving says average. The average daily turnover has increased to NPR 45.14 crores from NPR 37.90 crores. Currently, NEPSE is trading above the retracement level of 38.2% of the recent swing from 1109.32 to 1232.74. Since NEPSE is trading above the 38.2% level, NEPSE still shows the presence of bullish sentiment in the market.</div>
<div>
</div>
<div>
<span style="font-size:16px;"><strong>Resistance and Support</strong></span></div>
<div>
</div>
<div style="text-align: center;">
<img alt="" src="/app/webroot/userfiles/images/Clipboard02%2817%29.jpg" style="width: 800px; height: 252px;" /></div>
<div>
</div>
<div>
In course of month, the index broke the resistance level of 1210, reached the high level of 1232.74 and retraced back to the low level of 1170.11. However, at the end of month, NEPSE showed bullish momentum and closed at 1187.77. The average traded volume was higher than the previous month indicating an increased market participation. The immediate support and resistance stand same at 1150 and 1210 respectively.</div>
<div>
</div>
<div>
<span style="font-size:16px;"><strong>Nepse Trend Indicator</strong></span></div>
<div>
<strong>a. MACD</strong></div>
<div>
The MACD is a momentum oscillator formed by using two different types of moving averages, which provides specific buying or selling signals. When a MACD line crosses above the signal line, it is considered to be a positive sign and indicates a time to buy, and vice-versa.</div>
<div>
</div>
<div>
The MACD and the signal line, at the beginning of last month, stood at -6.39 and –12.52 respectively. By the end of the month, MACD line and signal increased by 9.01 and 14.76 to close at 2.62 and 2.25 respectively. The MACD line crossed the signal line from the below indicating a bullish crossover in the market. Both lines are moving in the positive zone indicating a positive sign in the market.</div>
<div>
</div>
<div style="text-align: center;">
<img alt="" src="/app/webroot/userfiles/images/Clipboard09%2813%29.jpg" style="width: 800px; height: 152px;" /></div>
<div>
</div>
<div>
<strong>b. RSI</strong></div>
<div>
RSI is a form of leading indicator that is believed to be most effective during periods of sideways movement. Such indicators may create numerous buy and sell signals that are useful when the market is not clearly trending upwards or downwards.</div>
<div>
</div>
<div>
The RSI at the beginning of the month, stood at 50.19 level. In the course of month, RSI increased by 3.34 points to close at 53.53. Last month, RSI reached the high level of 64 and retraced back to the low level of 46. At the end of month, NEPSE showed some bullish momentum and RSI gained some points to close at 53.53. Positive divergence can be seen between the NEPSE and RSI as NEPSE and RSI are forming lower low and lower high.</div>
<div>
</div>
<div style="text-align: center;">
<img alt="" src="/app/webroot/userfiles/images/Clipboard10%2814%29.jpg" style="width: 800px; height: 138px;" /></div>
<div>
</div>
<div>
<strong>c. (OBV)</strong></div>
<div>
On balance volume is a momentum indicator that uses volume flow to predict changes in stock prices. It measures buying and selling pressure as a cumulative indicator that adds volume in up days and subtracts volume on down days.</div>
<div>
</div>
<div>
On balance volume at the beginning of last month, stood at -9.7 b level. In the course of month, it lost 2.4 b points to close at -12.1 b. Last month, OBV has decreased by 2.4 b indicating a rise of selling pressure in the market.</div>
<div>
</div>
<div style="text-align: center;">
<img alt="" src="/app/webroot/userfiles/images/Clipboard11%2817%29.jpg" style="width: 800px; height: 377px;" /></div>
<div>
</div>
<div>
<strong>d. Bollinger Bands</strong></div>
<div>
The Bollinger Band is a technical indicator that consists of a moving average (21-day) along with two trading bands above (upper band) and below it (lower band). The bands are an indication of volatility, which are represented by calculating standard deviation.</div>
<div>
At the beginning of the month, NEPSE index retraced back from the upper Bollinger band to the mid Bollinger band. However, at the mid-month, NEPSE showed sideways movement and closed at mid Bollinger band. The distance between upper and lower Bollinger band has decreased indicating a low volatility in the market.</div>
<div>
</div>
<div style="text-align: center;">
<img alt="" src="/app/webroot/userfiles/images/Clipboard12%2816%29.jpg" style="width: 800px; height: 139px;" /></div>
<div>
</div>
<div>
<strong>e. Overview</strong></div>
<div>
NEPSE index gained 21.8 (or up 1.87%) to close at 1187.77 last month. At the beginning of last month, NEPSE index showed bullish momentum by breaching the resistance of 50 days moving average. However, NEPSE index could not breach the 200 days moving average and retraced back forming a shooting star candle. Currently, NEPSE is trading above 50 days moving average and below 200 days moving average. The MACD line crossed the signal line from the below indicating a bullish crossover in the market. Both lines are moving in the positive zone indicating a positive sign in the market. Positive divergence can be seen between the NEPSE and RSI as NEPSE and RSI are forming lower low and lower high. Last month, OBV has decreased by 2.4 b indicating a rise of selling pressure in the market. The distance between upper and lower Bollinger band has decreased indicating a low volatility in the market. The immediate support and resistance stand same at 1150 and 1210 respectively. </div>
<div>
</div>
<div>
</div>
',
'status' => true,
'publish_date' => null,
'created' => '2019-02-15 12:42:48',
'modified' => '2019-02-15 12:45:32',
'keywords' => '',
'description' => '',
'sortorder' => '2353',
'feature_article' => true,
'user_id' => '11',
'image1' => null,
'image2' => null,
'image3' => null,
'image4' => null
),
'MagazineIssue' => array(
'id' => '995',
'image' => '20190214094935_NewBiz_February_Cover Page for web.jpg',
'sortorder' => '1543',
'published' => true,
'created' => '2019-02-11 11:16:33',
'modified' => '2019-02-14 09:49:36',
'title' => 'February 2019',
'publish_date' => '2019-02-01',
'parent_id' => '0',
'homepage' => true,
'user_id' => '11'
),
'MagazineCategory' => array(
'id' => '63',
'title' => 'Stock Taking',
'sortorder' => '516',
'status' => true,
'created' => '0000-00-00 00:00:00',
'homepage' => true,
'modified' => '2013-04-01 00:00:00'
),
'User' => array(
'password' => '*****',
'id' => '11',
'user_detail_id' => '0',
'group_id' => '24',
'username' => 'nsingha@abhiyan.com.np',
'name' => '',
'email' => 'nsingha@abhiyan.com.np',
'address' => '',
'gender' => '',
'access' => '1',
'phone' => '',
'access_type' => '0',
'activated' => false,
'sortorder' => '0',
'published' => '0',
'created' => '2015-04-08 13:22:59',
'last_login' => '2023-04-16 09:29:47',
'ip' => '172.69.77.43'
),
'MagazineArticleComment' => array(),
'MagazineView' => array(
(int) 0 => array(
'magazine_article_id' => '2403',
'hit' => '2540'
)
)
)
$current_user = null
$logged_in = false
$user = null
$groupId = null
$user_id = null
include - APP/View/MagazineArticles/view.ctp, line 68
View::_evaluate() - CORE/Cake/View/View.php, line 971
View::_render() - CORE/Cake/View/View.php, line 933
View::render() - CORE/Cake/View/View.php, line 473
Controller::render() - CORE/Cake/Controller/Controller.php, line 968
Dispatcher::_invoke() - CORE/Cake/Routing/Dispatcher.php, line 200
Dispatcher::dispatch() - CORE/Cake/Routing/Dispatcher.php, line 167
[main] - APP/webroot/index.php, line 117
Monthly Technical Analysis of Nepse (December 23rd 2018 – January 17th 2019)
5 min 11 sec to read
Shooting Star
Trend Analysis
NEPSE index gained 21.8 (or up 1.87%) to close at 1187.77 last month. At the beginning of last month, NEPSE index showed bullish momentum by breaching the resistance of 50 days moving average. However, NEPSE index could not breach the 200 days moving average and retraced back forming a shooting star candle. Currently, NEPSE is trading above 50 days moving average and below 200 days moving says average. The average daily turnover has increased to NPR 45.14 crores from NPR 37.90 crores. Currently, NEPSE is trading above the retracement level of 38.2% of the recent swing from 1109.32 to 1232.74. Since NEPSE is trading above the 38.2% level, NEPSE still shows the presence of bullish sentiment in the market.
Resistance and Support
In course of month, the index broke the resistance level of 1210, reached the high level of 1232.74 and retraced back to the low level of 1170.11. However, at the end of month, NEPSE showed bullish momentum and closed at 1187.77. The average traded volume was higher than the previous month indicating an increased market participation. The immediate support and resistance stand same at 1150 and 1210 respectively.
Nepse Trend Indicator
a. MACD
The MACD is a momentum oscillator formed by using two different types of moving averages, which provides specific buying or selling signals. When a MACD line crosses above the signal line, it is considered to be a positive sign and indicates a time to buy, and vice-versa.
The MACD and the signal line, at the beginning of last month, stood at -6.39 and –12.52 respectively. By the end of the month, MACD line and signal increased by 9.01 and 14.76 to close at 2.62 and 2.25 respectively. The MACD line crossed the signal line from the below indicating a bullish crossover in the market. Both lines are moving in the positive zone indicating a positive sign in the market.
b. RSI
RSI is a form of leading indicator that is believed to be most effective during periods of sideways movement. Such indicators may create numerous buy and sell signals that are useful when the market is not clearly trending upwards or downwards.
The RSI at the beginning of the month, stood at 50.19 level. In the course of month, RSI increased by 3.34 points to close at 53.53. Last month, RSI reached the high level of 64 and retraced back to the low level of 46. At the end of month, NEPSE showed some bullish momentum and RSI gained some points to close at 53.53. Positive divergence can be seen between the NEPSE and RSI as NEPSE and RSI are forming lower low and lower high.
c. (OBV)
On balance volume is a momentum indicator that uses volume flow to predict changes in stock prices. It measures buying and selling pressure as a cumulative indicator that adds volume in up days and subtracts volume on down days.
On balance volume at the beginning of last month, stood at -9.7 b level. In the course of month, it lost 2.4 b points to close at -12.1 b. Last month, OBV has decreased by 2.4 b indicating a rise of selling pressure in the market.
d. Bollinger Bands
The Bollinger Band is a technical indicator that consists of a moving average (21-day) along with two trading bands above (upper band) and below it (lower band). The bands are an indication of volatility, which are represented by calculating standard deviation.
At the beginning of the month, NEPSE index retraced back from the upper Bollinger band to the mid Bollinger band. However, at the mid-month, NEPSE showed sideways movement and closed at mid Bollinger band. The distance between upper and lower Bollinger band has decreased indicating a low volatility in the market.
e. Overview
NEPSE index gained 21.8 (or up 1.87%) to close at 1187.77 last month. At the beginning of last month, NEPSE index showed bullish momentum by breaching the resistance of 50 days moving average. However, NEPSE index could not breach the 200 days moving average and retraced back forming a shooting star candle. Currently, NEPSE is trading above 50 days moving average and below 200 days moving average. The MACD line crossed the signal line from the below indicating a bullish crossover in the market. Both lines are moving in the positive zone indicating a positive sign in the market. Positive divergence can be seen between the NEPSE and RSI as NEPSE and RSI are forming lower low and lower high. Last month, OBV has decreased by 2.4 b indicating a rise of selling pressure in the market. The distance between upper and lower Bollinger band has decreased indicating a low volatility in the market. The immediate support and resistance stand same at 1150 and 1210 respectively.
$viewFile = '/var/www/html/newbusinessage.com/app/View/Elements/side_bar.ctp'
$dataForView = array(
'magazineArticle' => array(
'MagazineArticle' => array(
'id' => '2403',
'magazine_issue_id' => '995',
'magazine_category_id' => '63',
'title' => 'Monthly Technical Analysis of Nepse (December 23rd 2018 – January 17th 2019)',
'image' => '20190215124248_Clipboard07.jpg',
'short_content' => 'NEPSE index gained 21.8 (or up 1.87%) to close at 1187.77 last month. At the beginning of last month, NEPSE index showed bullish momentum by breaching the resistance of 50 days moving average. However, NEPSE index could not breach the 200 days moving average and retraced back forming a shooting star candle. Currently, NEPSE is trading above 50 days moving average and below 200 days moving says average.',
'content' => '<div>
<span style="font-size:18px;"><strong>Shooting Star</strong></span></div>
<div>
</div>
<div style="text-align: center;">
<span style="font-size:16px;"><strong><img alt="" src="/app/webroot/userfiles/images/Clipboard05%2815%29.jpg" style="width: 800px; height: 799px;" /></strong></span></div>
<div>
</div>
<div>
<strong style="font-size: 16px;">Trend Analysis</strong></div>
<div>
</div>
<div style="text-align: center;">
<img alt="" src="/app/webroot/userfiles/images/Clipboard08%2816%29.jpg" style="width: 800px; height: 319px;" /></div>
<div>
</div>
<div>
NEPSE index gained 21.8 (or up 1.87%) to close at 1187.77 last month. At the beginning of last month, NEPSE index showed bullish momentum by breaching the resistance of 50 days moving average. However, NEPSE index could not breach the 200 days moving average and retraced back forming a shooting star candle. Currently, NEPSE is trading above 50 days moving average and below 200 days moving says average. The average daily turnover has increased to NPR 45.14 crores from NPR 37.90 crores. Currently, NEPSE is trading above the retracement level of 38.2% of the recent swing from 1109.32 to 1232.74. Since NEPSE is trading above the 38.2% level, NEPSE still shows the presence of bullish sentiment in the market.</div>
<div>
</div>
<div>
<span style="font-size:16px;"><strong>Resistance and Support</strong></span></div>
<div>
</div>
<div style="text-align: center;">
<img alt="" src="/app/webroot/userfiles/images/Clipboard02%2817%29.jpg" style="width: 800px; height: 252px;" /></div>
<div>
</div>
<div>
In course of month, the index broke the resistance level of 1210, reached the high level of 1232.74 and retraced back to the low level of 1170.11. However, at the end of month, NEPSE showed bullish momentum and closed at 1187.77. The average traded volume was higher than the previous month indicating an increased market participation. The immediate support and resistance stand same at 1150 and 1210 respectively.</div>
<div>
</div>
<div>
<span style="font-size:16px;"><strong>Nepse Trend Indicator</strong></span></div>
<div>
<strong>a. MACD</strong></div>
<div>
The MACD is a momentum oscillator formed by using two different types of moving averages, which provides specific buying or selling signals. When a MACD line crosses above the signal line, it is considered to be a positive sign and indicates a time to buy, and vice-versa.</div>
<div>
</div>
<div>
The MACD and the signal line, at the beginning of last month, stood at -6.39 and –12.52 respectively. By the end of the month, MACD line and signal increased by 9.01 and 14.76 to close at 2.62 and 2.25 respectively. The MACD line crossed the signal line from the below indicating a bullish crossover in the market. Both lines are moving in the positive zone indicating a positive sign in the market.</div>
<div>
</div>
<div style="text-align: center;">
<img alt="" src="/app/webroot/userfiles/images/Clipboard09%2813%29.jpg" style="width: 800px; height: 152px;" /></div>
<div>
</div>
<div>
<strong>b. RSI</strong></div>
<div>
RSI is a form of leading indicator that is believed to be most effective during periods of sideways movement. Such indicators may create numerous buy and sell signals that are useful when the market is not clearly trending upwards or downwards.</div>
<div>
</div>
<div>
The RSI at the beginning of the month, stood at 50.19 level. In the course of month, RSI increased by 3.34 points to close at 53.53. Last month, RSI reached the high level of 64 and retraced back to the low level of 46. At the end of month, NEPSE showed some bullish momentum and RSI gained some points to close at 53.53. Positive divergence can be seen between the NEPSE and RSI as NEPSE and RSI are forming lower low and lower high.</div>
<div>
</div>
<div style="text-align: center;">
<img alt="" src="/app/webroot/userfiles/images/Clipboard10%2814%29.jpg" style="width: 800px; height: 138px;" /></div>
<div>
</div>
<div>
<strong>c. (OBV)</strong></div>
<div>
On balance volume is a momentum indicator that uses volume flow to predict changes in stock prices. It measures buying and selling pressure as a cumulative indicator that adds volume in up days and subtracts volume on down days.</div>
<div>
</div>
<div>
On balance volume at the beginning of last month, stood at -9.7 b level. In the course of month, it lost 2.4 b points to close at -12.1 b. Last month, OBV has decreased by 2.4 b indicating a rise of selling pressure in the market.</div>
<div>
</div>
<div style="text-align: center;">
<img alt="" src="/app/webroot/userfiles/images/Clipboard11%2817%29.jpg" style="width: 800px; height: 377px;" /></div>
<div>
</div>
<div>
<strong>d. Bollinger Bands</strong></div>
<div>
The Bollinger Band is a technical indicator that consists of a moving average (21-day) along with two trading bands above (upper band) and below it (lower band). The bands are an indication of volatility, which are represented by calculating standard deviation.</div>
<div>
At the beginning of the month, NEPSE index retraced back from the upper Bollinger band to the mid Bollinger band. However, at the mid-month, NEPSE showed sideways movement and closed at mid Bollinger band. The distance between upper and lower Bollinger band has decreased indicating a low volatility in the market.</div>
<div>
</div>
<div style="text-align: center;">
<img alt="" src="/app/webroot/userfiles/images/Clipboard12%2816%29.jpg" style="width: 800px; height: 139px;" /></div>
<div>
</div>
<div>
<strong>e. Overview</strong></div>
<div>
NEPSE index gained 21.8 (or up 1.87%) to close at 1187.77 last month. At the beginning of last month, NEPSE index showed bullish momentum by breaching the resistance of 50 days moving average. However, NEPSE index could not breach the 200 days moving average and retraced back forming a shooting star candle. Currently, NEPSE is trading above 50 days moving average and below 200 days moving average. The MACD line crossed the signal line from the below indicating a bullish crossover in the market. Both lines are moving in the positive zone indicating a positive sign in the market. Positive divergence can be seen between the NEPSE and RSI as NEPSE and RSI are forming lower low and lower high. Last month, OBV has decreased by 2.4 b indicating a rise of selling pressure in the market. The distance between upper and lower Bollinger band has decreased indicating a low volatility in the market. The immediate support and resistance stand same at 1150 and 1210 respectively. </div>
<div>
</div>
<div>
</div>
',
'status' => true,
'publish_date' => null,
'created' => '2019-02-15 12:42:48',
'modified' => '2019-02-15 12:45:32',
'keywords' => '',
'description' => '',
'sortorder' => '2353',
'feature_article' => true,
'user_id' => '11',
'image1' => null,
'image2' => null,
'image3' => null,
'image4' => null
),
'MagazineIssue' => array(
'id' => '995',
'image' => '20190214094935_NewBiz_February_Cover Page for web.jpg',
'sortorder' => '1543',
'published' => true,
'created' => '2019-02-11 11:16:33',
'modified' => '2019-02-14 09:49:36',
'title' => 'February 2019',
'publish_date' => '2019-02-01',
'parent_id' => '0',
'homepage' => true,
'user_id' => '11'
),
'MagazineCategory' => array(
'id' => '63',
'title' => 'Stock Taking',
'sortorder' => '516',
'status' => true,
'created' => '0000-00-00 00:00:00',
'homepage' => true,
'modified' => '2013-04-01 00:00:00'
),
'User' => array(
'password' => '*****',
'id' => '11',
'user_detail_id' => '0',
'group_id' => '24',
'username' => 'nsingha@abhiyan.com.np',
'name' => '',
'email' => 'nsingha@abhiyan.com.np',
'address' => '',
'gender' => '',
'access' => '1',
'phone' => '',
'access_type' => '0',
'activated' => false,
'sortorder' => '0',
'published' => '0',
'created' => '2015-04-08 13:22:59',
'last_login' => '2023-04-16 09:29:47',
'ip' => '172.69.77.43'
),
'MagazineArticleComment' => array(),
'MagazineView' => array(
(int) 0 => array(
[maximum depth reached]
)
)
),
'current_user' => null,
'logged_in' => false
)
$magazineArticle = array(
'MagazineArticle' => array(
'id' => '2403',
'magazine_issue_id' => '995',
'magazine_category_id' => '63',
'title' => 'Monthly Technical Analysis of Nepse (December 23rd 2018 – January 17th 2019)',
'image' => '20190215124248_Clipboard07.jpg',
'short_content' => 'NEPSE index gained 21.8 (or up 1.87%) to close at 1187.77 last month. At the beginning of last month, NEPSE index showed bullish momentum by breaching the resistance of 50 days moving average. However, NEPSE index could not breach the 200 days moving average and retraced back forming a shooting star candle. Currently, NEPSE is trading above 50 days moving average and below 200 days moving says average.',
'content' => '<div>
<span style="font-size:18px;"><strong>Shooting Star</strong></span></div>
<div>
</div>
<div style="text-align: center;">
<span style="font-size:16px;"><strong><img alt="" src="/app/webroot/userfiles/images/Clipboard05%2815%29.jpg" style="width: 800px; height: 799px;" /></strong></span></div>
<div>
</div>
<div>
<strong style="font-size: 16px;">Trend Analysis</strong></div>
<div>
</div>
<div style="text-align: center;">
<img alt="" src="/app/webroot/userfiles/images/Clipboard08%2816%29.jpg" style="width: 800px; height: 319px;" /></div>
<div>
</div>
<div>
NEPSE index gained 21.8 (or up 1.87%) to close at 1187.77 last month. At the beginning of last month, NEPSE index showed bullish momentum by breaching the resistance of 50 days moving average. However, NEPSE index could not breach the 200 days moving average and retraced back forming a shooting star candle. Currently, NEPSE is trading above 50 days moving average and below 200 days moving says average. The average daily turnover has increased to NPR 45.14 crores from NPR 37.90 crores. Currently, NEPSE is trading above the retracement level of 38.2% of the recent swing from 1109.32 to 1232.74. Since NEPSE is trading above the 38.2% level, NEPSE still shows the presence of bullish sentiment in the market.</div>
<div>
</div>
<div>
<span style="font-size:16px;"><strong>Resistance and Support</strong></span></div>
<div>
</div>
<div style="text-align: center;">
<img alt="" src="/app/webroot/userfiles/images/Clipboard02%2817%29.jpg" style="width: 800px; height: 252px;" /></div>
<div>
</div>
<div>
In course of month, the index broke the resistance level of 1210, reached the high level of 1232.74 and retraced back to the low level of 1170.11. However, at the end of month, NEPSE showed bullish momentum and closed at 1187.77. The average traded volume was higher than the previous month indicating an increased market participation. The immediate support and resistance stand same at 1150 and 1210 respectively.</div>
<div>
</div>
<div>
<span style="font-size:16px;"><strong>Nepse Trend Indicator</strong></span></div>
<div>
<strong>a. MACD</strong></div>
<div>
The MACD is a momentum oscillator formed by using two different types of moving averages, which provides specific buying or selling signals. When a MACD line crosses above the signal line, it is considered to be a positive sign and indicates a time to buy, and vice-versa.</div>
<div>
</div>
<div>
The MACD and the signal line, at the beginning of last month, stood at -6.39 and –12.52 respectively. By the end of the month, MACD line and signal increased by 9.01 and 14.76 to close at 2.62 and 2.25 respectively. The MACD line crossed the signal line from the below indicating a bullish crossover in the market. Both lines are moving in the positive zone indicating a positive sign in the market.</div>
<div>
</div>
<div style="text-align: center;">
<img alt="" src="/app/webroot/userfiles/images/Clipboard09%2813%29.jpg" style="width: 800px; height: 152px;" /></div>
<div>
</div>
<div>
<strong>b. RSI</strong></div>
<div>
RSI is a form of leading indicator that is believed to be most effective during periods of sideways movement. Such indicators may create numerous buy and sell signals that are useful when the market is not clearly trending upwards or downwards.</div>
<div>
</div>
<div>
The RSI at the beginning of the month, stood at 50.19 level. In the course of month, RSI increased by 3.34 points to close at 53.53. Last month, RSI reached the high level of 64 and retraced back to the low level of 46. At the end of month, NEPSE showed some bullish momentum and RSI gained some points to close at 53.53. Positive divergence can be seen between the NEPSE and RSI as NEPSE and RSI are forming lower low and lower high.</div>
<div>
</div>
<div style="text-align: center;">
<img alt="" src="/app/webroot/userfiles/images/Clipboard10%2814%29.jpg" style="width: 800px; height: 138px;" /></div>
<div>
</div>
<div>
<strong>c. (OBV)</strong></div>
<div>
On balance volume is a momentum indicator that uses volume flow to predict changes in stock prices. It measures buying and selling pressure as a cumulative indicator that adds volume in up days and subtracts volume on down days.</div>
<div>
</div>
<div>
On balance volume at the beginning of last month, stood at -9.7 b level. In the course of month, it lost 2.4 b points to close at -12.1 b. Last month, OBV has decreased by 2.4 b indicating a rise of selling pressure in the market.</div>
<div>
</div>
<div style="text-align: center;">
<img alt="" src="/app/webroot/userfiles/images/Clipboard11%2817%29.jpg" style="width: 800px; height: 377px;" /></div>
<div>
</div>
<div>
<strong>d. Bollinger Bands</strong></div>
<div>
The Bollinger Band is a technical indicator that consists of a moving average (21-day) along with two trading bands above (upper band) and below it (lower band). The bands are an indication of volatility, which are represented by calculating standard deviation.</div>
<div>
At the beginning of the month, NEPSE index retraced back from the upper Bollinger band to the mid Bollinger band. However, at the mid-month, NEPSE showed sideways movement and closed at mid Bollinger band. The distance between upper and lower Bollinger band has decreased indicating a low volatility in the market.</div>
<div>
</div>
<div style="text-align: center;">
<img alt="" src="/app/webroot/userfiles/images/Clipboard12%2816%29.jpg" style="width: 800px; height: 139px;" /></div>
<div>
</div>
<div>
<strong>e. Overview</strong></div>
<div>
NEPSE index gained 21.8 (or up 1.87%) to close at 1187.77 last month. At the beginning of last month, NEPSE index showed bullish momentum by breaching the resistance of 50 days moving average. However, NEPSE index could not breach the 200 days moving average and retraced back forming a shooting star candle. Currently, NEPSE is trading above 50 days moving average and below 200 days moving average. The MACD line crossed the signal line from the below indicating a bullish crossover in the market. Both lines are moving in the positive zone indicating a positive sign in the market. Positive divergence can be seen between the NEPSE and RSI as NEPSE and RSI are forming lower low and lower high. Last month, OBV has decreased by 2.4 b indicating a rise of selling pressure in the market. The distance between upper and lower Bollinger band has decreased indicating a low volatility in the market. The immediate support and resistance stand same at 1150 and 1210 respectively. </div>
<div>
</div>
<div>
</div>
',
'status' => true,
'publish_date' => null,
'created' => '2019-02-15 12:42:48',
'modified' => '2019-02-15 12:45:32',
'keywords' => '',
'description' => '',
'sortorder' => '2353',
'feature_article' => true,
'user_id' => '11',
'image1' => null,
'image2' => null,
'image3' => null,
'image4' => null
),
'MagazineIssue' => array(
'id' => '995',
'image' => '20190214094935_NewBiz_February_Cover Page for web.jpg',
'sortorder' => '1543',
'published' => true,
'created' => '2019-02-11 11:16:33',
'modified' => '2019-02-14 09:49:36',
'title' => 'February 2019',
'publish_date' => '2019-02-01',
'parent_id' => '0',
'homepage' => true,
'user_id' => '11'
),
'MagazineCategory' => array(
'id' => '63',
'title' => 'Stock Taking',
'sortorder' => '516',
'status' => true,
'created' => '0000-00-00 00:00:00',
'homepage' => true,
'modified' => '2013-04-01 00:00:00'
),
'User' => array(
'password' => '*****',
'id' => '11',
'user_detail_id' => '0',
'group_id' => '24',
'username' => 'nsingha@abhiyan.com.np',
'name' => '',
'email' => 'nsingha@abhiyan.com.np',
'address' => '',
'gender' => '',
'access' => '1',
'phone' => '',
'access_type' => '0',
'activated' => false,
'sortorder' => '0',
'published' => '0',
'created' => '2015-04-08 13:22:59',
'last_login' => '2023-04-16 09:29:47',
'ip' => '172.69.77.43'
),
'MagazineArticleComment' => array(),
'MagazineView' => array(
(int) 0 => array(
'magazine_article_id' => '2403',
'hit' => '2540'
)
)
)
$current_user = null
$logged_in = false
include - APP/View/Elements/side_bar.ctp, line 60
View::_evaluate() - CORE/Cake/View/View.php, line 971
View::_render() - CORE/Cake/View/View.php, line 933
View::_renderElement() - CORE/Cake/View/View.php, line 1224
View::element() - CORE/Cake/View/View.php, line 418
include - APP/View/MagazineArticles/view.ctp, line 279
View::_evaluate() - CORE/Cake/View/View.php, line 971
View::_render() - CORE/Cake/View/View.php, line 933
View::render() - CORE/Cake/View/View.php, line 473
Controller::render() - CORE/Cake/Controller/Controller.php, line 968
Dispatcher::_invoke() - CORE/Cake/Routing/Dispatcher.php, line 200
Dispatcher::dispatch() - CORE/Cake/Routing/Dispatcher.php, line 167
[main] - APP/webroot/index.php, line 117
Warning (2): simplexml_load_file() [<a href='http://php.net/function.simplexml-load-file'>function.simplexml-load-file</a>]: I/O warning : failed to load external entity "" [APP/View/Elements/side_bar.ctp, line 60]
$viewFile = '/var/www/html/newbusinessage.com/app/View/Elements/side_bar.ctp'
$dataForView = array(
'magazineArticle' => array(
'MagazineArticle' => array(
'id' => '2403',
'magazine_issue_id' => '995',
'magazine_category_id' => '63',
'title' => 'Monthly Technical Analysis of Nepse (December 23rd 2018 – January 17th 2019)',
'image' => '20190215124248_Clipboard07.jpg',
'short_content' => 'NEPSE index gained 21.8 (or up 1.87%) to close at 1187.77 last month. At the beginning of last month, NEPSE index showed bullish momentum by breaching the resistance of 50 days moving average. However, NEPSE index could not breach the 200 days moving average and retraced back forming a shooting star candle. Currently, NEPSE is trading above 50 days moving average and below 200 days moving says average.',
'content' => '<div>
<span style="font-size:18px;"><strong>Shooting Star</strong></span></div>
<div>
</div>
<div style="text-align: center;">
<span style="font-size:16px;"><strong><img alt="" src="/app/webroot/userfiles/images/Clipboard05%2815%29.jpg" style="width: 800px; height: 799px;" /></strong></span></div>
<div>
</div>
<div>
<strong style="font-size: 16px;">Trend Analysis</strong></div>
<div>
</div>
<div style="text-align: center;">
<img alt="" src="/app/webroot/userfiles/images/Clipboard08%2816%29.jpg" style="width: 800px; height: 319px;" /></div>
<div>
</div>
<div>
NEPSE index gained 21.8 (or up 1.87%) to close at 1187.77 last month. At the beginning of last month, NEPSE index showed bullish momentum by breaching the resistance of 50 days moving average. However, NEPSE index could not breach the 200 days moving average and retraced back forming a shooting star candle. Currently, NEPSE is trading above 50 days moving average and below 200 days moving says average. The average daily turnover has increased to NPR 45.14 crores from NPR 37.90 crores. Currently, NEPSE is trading above the retracement level of 38.2% of the recent swing from 1109.32 to 1232.74. Since NEPSE is trading above the 38.2% level, NEPSE still shows the presence of bullish sentiment in the market.</div>
<div>
</div>
<div>
<span style="font-size:16px;"><strong>Resistance and Support</strong></span></div>
<div>
</div>
<div style="text-align: center;">
<img alt="" src="/app/webroot/userfiles/images/Clipboard02%2817%29.jpg" style="width: 800px; height: 252px;" /></div>
<div>
</div>
<div>
In course of month, the index broke the resistance level of 1210, reached the high level of 1232.74 and retraced back to the low level of 1170.11. However, at the end of month, NEPSE showed bullish momentum and closed at 1187.77. The average traded volume was higher than the previous month indicating an increased market participation. The immediate support and resistance stand same at 1150 and 1210 respectively.</div>
<div>
</div>
<div>
<span style="font-size:16px;"><strong>Nepse Trend Indicator</strong></span></div>
<div>
<strong>a. MACD</strong></div>
<div>
The MACD is a momentum oscillator formed by using two different types of moving averages, which provides specific buying or selling signals. When a MACD line crosses above the signal line, it is considered to be a positive sign and indicates a time to buy, and vice-versa.</div>
<div>
</div>
<div>
The MACD and the signal line, at the beginning of last month, stood at -6.39 and –12.52 respectively. By the end of the month, MACD line and signal increased by 9.01 and 14.76 to close at 2.62 and 2.25 respectively. The MACD line crossed the signal line from the below indicating a bullish crossover in the market. Both lines are moving in the positive zone indicating a positive sign in the market.</div>
<div>
</div>
<div style="text-align: center;">
<img alt="" src="/app/webroot/userfiles/images/Clipboard09%2813%29.jpg" style="width: 800px; height: 152px;" /></div>
<div>
</div>
<div>
<strong>b. RSI</strong></div>
<div>
RSI is a form of leading indicator that is believed to be most effective during periods of sideways movement. Such indicators may create numerous buy and sell signals that are useful when the market is not clearly trending upwards or downwards.</div>
<div>
</div>
<div>
The RSI at the beginning of the month, stood at 50.19 level. In the course of month, RSI increased by 3.34 points to close at 53.53. Last month, RSI reached the high level of 64 and retraced back to the low level of 46. At the end of month, NEPSE showed some bullish momentum and RSI gained some points to close at 53.53. Positive divergence can be seen between the NEPSE and RSI as NEPSE and RSI are forming lower low and lower high.</div>
<div>
</div>
<div style="text-align: center;">
<img alt="" src="/app/webroot/userfiles/images/Clipboard10%2814%29.jpg" style="width: 800px; height: 138px;" /></div>
<div>
</div>
<div>
<strong>c. (OBV)</strong></div>
<div>
On balance volume is a momentum indicator that uses volume flow to predict changes in stock prices. It measures buying and selling pressure as a cumulative indicator that adds volume in up days and subtracts volume on down days.</div>
<div>
</div>
<div>
On balance volume at the beginning of last month, stood at -9.7 b level. In the course of month, it lost 2.4 b points to close at -12.1 b. Last month, OBV has decreased by 2.4 b indicating a rise of selling pressure in the market.</div>
<div>
</div>
<div style="text-align: center;">
<img alt="" src="/app/webroot/userfiles/images/Clipboard11%2817%29.jpg" style="width: 800px; height: 377px;" /></div>
<div>
</div>
<div>
<strong>d. Bollinger Bands</strong></div>
<div>
The Bollinger Band is a technical indicator that consists of a moving average (21-day) along with two trading bands above (upper band) and below it (lower band). The bands are an indication of volatility, which are represented by calculating standard deviation.</div>
<div>
At the beginning of the month, NEPSE index retraced back from the upper Bollinger band to the mid Bollinger band. However, at the mid-month, NEPSE showed sideways movement and closed at mid Bollinger band. The distance between upper and lower Bollinger band has decreased indicating a low volatility in the market.</div>
<div>
</div>
<div style="text-align: center;">
<img alt="" src="/app/webroot/userfiles/images/Clipboard12%2816%29.jpg" style="width: 800px; height: 139px;" /></div>
<div>
</div>
<div>
<strong>e. Overview</strong></div>
<div>
NEPSE index gained 21.8 (or up 1.87%) to close at 1187.77 last month. At the beginning of last month, NEPSE index showed bullish momentum by breaching the resistance of 50 days moving average. However, NEPSE index could not breach the 200 days moving average and retraced back forming a shooting star candle. Currently, NEPSE is trading above 50 days moving average and below 200 days moving average. The MACD line crossed the signal line from the below indicating a bullish crossover in the market. Both lines are moving in the positive zone indicating a positive sign in the market. Positive divergence can be seen between the NEPSE and RSI as NEPSE and RSI are forming lower low and lower high. Last month, OBV has decreased by 2.4 b indicating a rise of selling pressure in the market. The distance between upper and lower Bollinger band has decreased indicating a low volatility in the market. The immediate support and resistance stand same at 1150 and 1210 respectively. </div>
<div>
</div>
<div>
</div>
',
'status' => true,
'publish_date' => null,
'created' => '2019-02-15 12:42:48',
'modified' => '2019-02-15 12:45:32',
'keywords' => '',
'description' => '',
'sortorder' => '2353',
'feature_article' => true,
'user_id' => '11',
'image1' => null,
'image2' => null,
'image3' => null,
'image4' => null
),
'MagazineIssue' => array(
'id' => '995',
'image' => '20190214094935_NewBiz_February_Cover Page for web.jpg',
'sortorder' => '1543',
'published' => true,
'created' => '2019-02-11 11:16:33',
'modified' => '2019-02-14 09:49:36',
'title' => 'February 2019',
'publish_date' => '2019-02-01',
'parent_id' => '0',
'homepage' => true,
'user_id' => '11'
),
'MagazineCategory' => array(
'id' => '63',
'title' => 'Stock Taking',
'sortorder' => '516',
'status' => true,
'created' => '0000-00-00 00:00:00',
'homepage' => true,
'modified' => '2013-04-01 00:00:00'
),
'User' => array(
'password' => '*****',
'id' => '11',
'user_detail_id' => '0',
'group_id' => '24',
'username' => 'nsingha@abhiyan.com.np',
'name' => '',
'email' => 'nsingha@abhiyan.com.np',
'address' => '',
'gender' => '',
'access' => '1',
'phone' => '',
'access_type' => '0',
'activated' => false,
'sortorder' => '0',
'published' => '0',
'created' => '2015-04-08 13:22:59',
'last_login' => '2023-04-16 09:29:47',
'ip' => '172.69.77.43'
),
'MagazineArticleComment' => array(),
'MagazineView' => array(
(int) 0 => array(
[maximum depth reached]
)
)
),
'current_user' => null,
'logged_in' => false
)
$magazineArticle = array(
'MagazineArticle' => array(
'id' => '2403',
'magazine_issue_id' => '995',
'magazine_category_id' => '63',
'title' => 'Monthly Technical Analysis of Nepse (December 23rd 2018 – January 17th 2019)',
'image' => '20190215124248_Clipboard07.jpg',
'short_content' => 'NEPSE index gained 21.8 (or up 1.87%) to close at 1187.77 last month. At the beginning of last month, NEPSE index showed bullish momentum by breaching the resistance of 50 days moving average. However, NEPSE index could not breach the 200 days moving average and retraced back forming a shooting star candle. Currently, NEPSE is trading above 50 days moving average and below 200 days moving says average.',
'content' => '<div>
<span style="font-size:18px;"><strong>Shooting Star</strong></span></div>
<div>
</div>
<div style="text-align: center;">
<span style="font-size:16px;"><strong><img alt="" src="/app/webroot/userfiles/images/Clipboard05%2815%29.jpg" style="width: 800px; height: 799px;" /></strong></span></div>
<div>
</div>
<div>
<strong style="font-size: 16px;">Trend Analysis</strong></div>
<div>
</div>
<div style="text-align: center;">
<img alt="" src="/app/webroot/userfiles/images/Clipboard08%2816%29.jpg" style="width: 800px; height: 319px;" /></div>
<div>
</div>
<div>
NEPSE index gained 21.8 (or up 1.87%) to close at 1187.77 last month. At the beginning of last month, NEPSE index showed bullish momentum by breaching the resistance of 50 days moving average. However, NEPSE index could not breach the 200 days moving average and retraced back forming a shooting star candle. Currently, NEPSE is trading above 50 days moving average and below 200 days moving says average. The average daily turnover has increased to NPR 45.14 crores from NPR 37.90 crores. Currently, NEPSE is trading above the retracement level of 38.2% of the recent swing from 1109.32 to 1232.74. Since NEPSE is trading above the 38.2% level, NEPSE still shows the presence of bullish sentiment in the market.</div>
<div>
</div>
<div>
<span style="font-size:16px;"><strong>Resistance and Support</strong></span></div>
<div>
</div>
<div style="text-align: center;">
<img alt="" src="/app/webroot/userfiles/images/Clipboard02%2817%29.jpg" style="width: 800px; height: 252px;" /></div>
<div>
</div>
<div>
In course of month, the index broke the resistance level of 1210, reached the high level of 1232.74 and retraced back to the low level of 1170.11. However, at the end of month, NEPSE showed bullish momentum and closed at 1187.77. The average traded volume was higher than the previous month indicating an increased market participation. The immediate support and resistance stand same at 1150 and 1210 respectively.</div>
<div>
</div>
<div>
<span style="font-size:16px;"><strong>Nepse Trend Indicator</strong></span></div>
<div>
<strong>a. MACD</strong></div>
<div>
The MACD is a momentum oscillator formed by using two different types of moving averages, which provides specific buying or selling signals. When a MACD line crosses above the signal line, it is considered to be a positive sign and indicates a time to buy, and vice-versa.</div>
<div>
</div>
<div>
The MACD and the signal line, at the beginning of last month, stood at -6.39 and –12.52 respectively. By the end of the month, MACD line and signal increased by 9.01 and 14.76 to close at 2.62 and 2.25 respectively. The MACD line crossed the signal line from the below indicating a bullish crossover in the market. Both lines are moving in the positive zone indicating a positive sign in the market.</div>
<div>
</div>
<div style="text-align: center;">
<img alt="" src="/app/webroot/userfiles/images/Clipboard09%2813%29.jpg" style="width: 800px; height: 152px;" /></div>
<div>
</div>
<div>
<strong>b. RSI</strong></div>
<div>
RSI is a form of leading indicator that is believed to be most effective during periods of sideways movement. Such indicators may create numerous buy and sell signals that are useful when the market is not clearly trending upwards or downwards.</div>
<div>
</div>
<div>
The RSI at the beginning of the month, stood at 50.19 level. In the course of month, RSI increased by 3.34 points to close at 53.53. Last month, RSI reached the high level of 64 and retraced back to the low level of 46. At the end of month, NEPSE showed some bullish momentum and RSI gained some points to close at 53.53. Positive divergence can be seen between the NEPSE and RSI as NEPSE and RSI are forming lower low and lower high.</div>
<div>
</div>
<div style="text-align: center;">
<img alt="" src="/app/webroot/userfiles/images/Clipboard10%2814%29.jpg" style="width: 800px; height: 138px;" /></div>
<div>
</div>
<div>
<strong>c. (OBV)</strong></div>
<div>
On balance volume is a momentum indicator that uses volume flow to predict changes in stock prices. It measures buying and selling pressure as a cumulative indicator that adds volume in up days and subtracts volume on down days.</div>
<div>
</div>
<div>
On balance volume at the beginning of last month, stood at -9.7 b level. In the course of month, it lost 2.4 b points to close at -12.1 b. Last month, OBV has decreased by 2.4 b indicating a rise of selling pressure in the market.</div>
<div>
</div>
<div style="text-align: center;">
<img alt="" src="/app/webroot/userfiles/images/Clipboard11%2817%29.jpg" style="width: 800px; height: 377px;" /></div>
<div>
</div>
<div>
<strong>d. Bollinger Bands</strong></div>
<div>
The Bollinger Band is a technical indicator that consists of a moving average (21-day) along with two trading bands above (upper band) and below it (lower band). The bands are an indication of volatility, which are represented by calculating standard deviation.</div>
<div>
At the beginning of the month, NEPSE index retraced back from the upper Bollinger band to the mid Bollinger band. However, at the mid-month, NEPSE showed sideways movement and closed at mid Bollinger band. The distance between upper and lower Bollinger band has decreased indicating a low volatility in the market.</div>
<div>
</div>
<div style="text-align: center;">
<img alt="" src="/app/webroot/userfiles/images/Clipboard12%2816%29.jpg" style="width: 800px; height: 139px;" /></div>
<div>
</div>
<div>
<strong>e. Overview</strong></div>
<div>
NEPSE index gained 21.8 (or up 1.87%) to close at 1187.77 last month. At the beginning of last month, NEPSE index showed bullish momentum by breaching the resistance of 50 days moving average. However, NEPSE index could not breach the 200 days moving average and retraced back forming a shooting star candle. Currently, NEPSE is trading above 50 days moving average and below 200 days moving average. The MACD line crossed the signal line from the below indicating a bullish crossover in the market. Both lines are moving in the positive zone indicating a positive sign in the market. Positive divergence can be seen between the NEPSE and RSI as NEPSE and RSI are forming lower low and lower high. Last month, OBV has decreased by 2.4 b indicating a rise of selling pressure in the market. The distance between upper and lower Bollinger band has decreased indicating a low volatility in the market. The immediate support and resistance stand same at 1150 and 1210 respectively. </div>
<div>
</div>
<div>
</div>
',
'status' => true,
'publish_date' => null,
'created' => '2019-02-15 12:42:48',
'modified' => '2019-02-15 12:45:32',
'keywords' => '',
'description' => '',
'sortorder' => '2353',
'feature_article' => true,
'user_id' => '11',
'image1' => null,
'image2' => null,
'image3' => null,
'image4' => null
),
'MagazineIssue' => array(
'id' => '995',
'image' => '20190214094935_NewBiz_February_Cover Page for web.jpg',
'sortorder' => '1543',
'published' => true,
'created' => '2019-02-11 11:16:33',
'modified' => '2019-02-14 09:49:36',
'title' => 'February 2019',
'publish_date' => '2019-02-01',
'parent_id' => '0',
'homepage' => true,
'user_id' => '11'
),
'MagazineCategory' => array(
'id' => '63',
'title' => 'Stock Taking',
'sortorder' => '516',
'status' => true,
'created' => '0000-00-00 00:00:00',
'homepage' => true,
'modified' => '2013-04-01 00:00:00'
),
'User' => array(
'password' => '*****',
'id' => '11',
'user_detail_id' => '0',
'group_id' => '24',
'username' => 'nsingha@abhiyan.com.np',
'name' => '',
'email' => 'nsingha@abhiyan.com.np',
'address' => '',
'gender' => '',
'access' => '1',
'phone' => '',
'access_type' => '0',
'activated' => false,
'sortorder' => '0',
'published' => '0',
'created' => '2015-04-08 13:22:59',
'last_login' => '2023-04-16 09:29:47',
'ip' => '172.69.77.43'
),
'MagazineArticleComment' => array(),
'MagazineView' => array(
(int) 0 => array(
'magazine_article_id' => '2403',
'hit' => '2540'
)
)
)
$current_user = null
$logged_in = false
simplexml_load_file - [internal], line ??
include - APP/View/Elements/side_bar.ctp, line 60
View::_evaluate() - CORE/Cake/View/View.php, line 971
View::_render() - CORE/Cake/View/View.php, line 933
View::_renderElement() - CORE/Cake/View/View.php, line 1224
View::element() - CORE/Cake/View/View.php, line 418
include - APP/View/MagazineArticles/view.ctp, line 279
View::_evaluate() - CORE/Cake/View/View.php, line 971
View::_render() - CORE/Cake/View/View.php, line 933
View::render() - CORE/Cake/View/View.php, line 473
Controller::render() - CORE/Cake/Controller/Controller.php, line 968
Dispatcher::_invoke() - CORE/Cake/Routing/Dispatcher.php, line 200
Dispatcher::dispatch() - CORE/Cake/Routing/Dispatcher.php, line 167
[main] - APP/webroot/index.php, line 117
file not found!
Notice (8): Undefined variable: file [APP/View/Elements/side_bar.ctp, line 133]
$viewFile = '/var/www/html/newbusinessage.com/app/View/Elements/side_bar.ctp'
$dataForView = array(
'magazineArticle' => array(
'MagazineArticle' => array(
'id' => '2403',
'magazine_issue_id' => '995',
'magazine_category_id' => '63',
'title' => 'Monthly Technical Analysis of Nepse (December 23rd 2018 – January 17th 2019)',
'image' => '20190215124248_Clipboard07.jpg',
'short_content' => 'NEPSE index gained 21.8 (or up 1.87%) to close at 1187.77 last month. At the beginning of last month, NEPSE index showed bullish momentum by breaching the resistance of 50 days moving average. However, NEPSE index could not breach the 200 days moving average and retraced back forming a shooting star candle. Currently, NEPSE is trading above 50 days moving average and below 200 days moving says average.',
'content' => '<div>
<span style="font-size:18px;"><strong>Shooting Star</strong></span></div>
<div>
</div>
<div style="text-align: center;">
<span style="font-size:16px;"><strong><img alt="" src="/app/webroot/userfiles/images/Clipboard05%2815%29.jpg" style="width: 800px; height: 799px;" /></strong></span></div>
<div>
</div>
<div>
<strong style="font-size: 16px;">Trend Analysis</strong></div>
<div>
</div>
<div style="text-align: center;">
<img alt="" src="/app/webroot/userfiles/images/Clipboard08%2816%29.jpg" style="width: 800px; height: 319px;" /></div>
<div>
</div>
<div>
NEPSE index gained 21.8 (or up 1.87%) to close at 1187.77 last month. At the beginning of last month, NEPSE index showed bullish momentum by breaching the resistance of 50 days moving average. However, NEPSE index could not breach the 200 days moving average and retraced back forming a shooting star candle. Currently, NEPSE is trading above 50 days moving average and below 200 days moving says average. The average daily turnover has increased to NPR 45.14 crores from NPR 37.90 crores. Currently, NEPSE is trading above the retracement level of 38.2% of the recent swing from 1109.32 to 1232.74. Since NEPSE is trading above the 38.2% level, NEPSE still shows the presence of bullish sentiment in the market.</div>
<div>
</div>
<div>
<span style="font-size:16px;"><strong>Resistance and Support</strong></span></div>
<div>
</div>
<div style="text-align: center;">
<img alt="" src="/app/webroot/userfiles/images/Clipboard02%2817%29.jpg" style="width: 800px; height: 252px;" /></div>
<div>
</div>
<div>
In course of month, the index broke the resistance level of 1210, reached the high level of 1232.74 and retraced back to the low level of 1170.11. However, at the end of month, NEPSE showed bullish momentum and closed at 1187.77. The average traded volume was higher than the previous month indicating an increased market participation. The immediate support and resistance stand same at 1150 and 1210 respectively.</div>
<div>
</div>
<div>
<span style="font-size:16px;"><strong>Nepse Trend Indicator</strong></span></div>
<div>
<strong>a. MACD</strong></div>
<div>
The MACD is a momentum oscillator formed by using two different types of moving averages, which provides specific buying or selling signals. When a MACD line crosses above the signal line, it is considered to be a positive sign and indicates a time to buy, and vice-versa.</div>
<div>
</div>
<div>
The MACD and the signal line, at the beginning of last month, stood at -6.39 and –12.52 respectively. By the end of the month, MACD line and signal increased by 9.01 and 14.76 to close at 2.62 and 2.25 respectively. The MACD line crossed the signal line from the below indicating a bullish crossover in the market. Both lines are moving in the positive zone indicating a positive sign in the market.</div>
<div>
</div>
<div style="text-align: center;">
<img alt="" src="/app/webroot/userfiles/images/Clipboard09%2813%29.jpg" style="width: 800px; height: 152px;" /></div>
<div>
</div>
<div>
<strong>b. RSI</strong></div>
<div>
RSI is a form of leading indicator that is believed to be most effective during periods of sideways movement. Such indicators may create numerous buy and sell signals that are useful when the market is not clearly trending upwards or downwards.</div>
<div>
</div>
<div>
The RSI at the beginning of the month, stood at 50.19 level. In the course of month, RSI increased by 3.34 points to close at 53.53. Last month, RSI reached the high level of 64 and retraced back to the low level of 46. At the end of month, NEPSE showed some bullish momentum and RSI gained some points to close at 53.53. Positive divergence can be seen between the NEPSE and RSI as NEPSE and RSI are forming lower low and lower high.</div>
<div>
</div>
<div style="text-align: center;">
<img alt="" src="/app/webroot/userfiles/images/Clipboard10%2814%29.jpg" style="width: 800px; height: 138px;" /></div>
<div>
</div>
<div>
<strong>c. (OBV)</strong></div>
<div>
On balance volume is a momentum indicator that uses volume flow to predict changes in stock prices. It measures buying and selling pressure as a cumulative indicator that adds volume in up days and subtracts volume on down days.</div>
<div>
</div>
<div>
On balance volume at the beginning of last month, stood at -9.7 b level. In the course of month, it lost 2.4 b points to close at -12.1 b. Last month, OBV has decreased by 2.4 b indicating a rise of selling pressure in the market.</div>
<div>
</div>
<div style="text-align: center;">
<img alt="" src="/app/webroot/userfiles/images/Clipboard11%2817%29.jpg" style="width: 800px; height: 377px;" /></div>
<div>
</div>
<div>
<strong>d. Bollinger Bands</strong></div>
<div>
The Bollinger Band is a technical indicator that consists of a moving average (21-day) along with two trading bands above (upper band) and below it (lower band). The bands are an indication of volatility, which are represented by calculating standard deviation.</div>
<div>
At the beginning of the month, NEPSE index retraced back from the upper Bollinger band to the mid Bollinger band. However, at the mid-month, NEPSE showed sideways movement and closed at mid Bollinger band. The distance between upper and lower Bollinger band has decreased indicating a low volatility in the market.</div>
<div>
</div>
<div style="text-align: center;">
<img alt="" src="/app/webroot/userfiles/images/Clipboard12%2816%29.jpg" style="width: 800px; height: 139px;" /></div>
<div>
</div>
<div>
<strong>e. Overview</strong></div>
<div>
NEPSE index gained 21.8 (or up 1.87%) to close at 1187.77 last month. At the beginning of last month, NEPSE index showed bullish momentum by breaching the resistance of 50 days moving average. However, NEPSE index could not breach the 200 days moving average and retraced back forming a shooting star candle. Currently, NEPSE is trading above 50 days moving average and below 200 days moving average. The MACD line crossed the signal line from the below indicating a bullish crossover in the market. Both lines are moving in the positive zone indicating a positive sign in the market. Positive divergence can be seen between the NEPSE and RSI as NEPSE and RSI are forming lower low and lower high. Last month, OBV has decreased by 2.4 b indicating a rise of selling pressure in the market. The distance between upper and lower Bollinger band has decreased indicating a low volatility in the market. The immediate support and resistance stand same at 1150 and 1210 respectively. </div>
<div>
</div>
<div>
</div>
',
'status' => true,
'publish_date' => null,
'created' => '2019-02-15 12:42:48',
'modified' => '2019-02-15 12:45:32',
'keywords' => '',
'description' => '',
'sortorder' => '2353',
'feature_article' => true,
'user_id' => '11',
'image1' => null,
'image2' => null,
'image3' => null,
'image4' => null
),
'MagazineIssue' => array(
'id' => '995',
'image' => '20190214094935_NewBiz_February_Cover Page for web.jpg',
'sortorder' => '1543',
'published' => true,
'created' => '2019-02-11 11:16:33',
'modified' => '2019-02-14 09:49:36',
'title' => 'February 2019',
'publish_date' => '2019-02-01',
'parent_id' => '0',
'homepage' => true,
'user_id' => '11'
),
'MagazineCategory' => array(
'id' => '63',
'title' => 'Stock Taking',
'sortorder' => '516',
'status' => true,
'created' => '0000-00-00 00:00:00',
'homepage' => true,
'modified' => '2013-04-01 00:00:00'
),
'User' => array(
'password' => '*****',
'id' => '11',
'user_detail_id' => '0',
'group_id' => '24',
'username' => 'nsingha@abhiyan.com.np',
'name' => '',
'email' => 'nsingha@abhiyan.com.np',
'address' => '',
'gender' => '',
'access' => '1',
'phone' => '',
'access_type' => '0',
'activated' => false,
'sortorder' => '0',
'published' => '0',
'created' => '2015-04-08 13:22:59',
'last_login' => '2023-04-16 09:29:47',
'ip' => '172.69.77.43'
),
'MagazineArticleComment' => array(),
'MagazineView' => array(
(int) 0 => array(
[maximum depth reached]
)
)
),
'current_user' => null,
'logged_in' => false
)
$magazineArticle = array(
'MagazineArticle' => array(
'id' => '2403',
'magazine_issue_id' => '995',
'magazine_category_id' => '63',
'title' => 'Monthly Technical Analysis of Nepse (December 23rd 2018 – January 17th 2019)',
'image' => '20190215124248_Clipboard07.jpg',
'short_content' => 'NEPSE index gained 21.8 (or up 1.87%) to close at 1187.77 last month. At the beginning of last month, NEPSE index showed bullish momentum by breaching the resistance of 50 days moving average. However, NEPSE index could not breach the 200 days moving average and retraced back forming a shooting star candle. Currently, NEPSE is trading above 50 days moving average and below 200 days moving says average.',
'content' => '<div>
<span style="font-size:18px;"><strong>Shooting Star</strong></span></div>
<div>
</div>
<div style="text-align: center;">
<span style="font-size:16px;"><strong><img alt="" src="/app/webroot/userfiles/images/Clipboard05%2815%29.jpg" style="width: 800px; height: 799px;" /></strong></span></div>
<div>
</div>
<div>
<strong style="font-size: 16px;">Trend Analysis</strong></div>
<div>
</div>
<div style="text-align: center;">
<img alt="" src="/app/webroot/userfiles/images/Clipboard08%2816%29.jpg" style="width: 800px; height: 319px;" /></div>
<div>
</div>
<div>
NEPSE index gained 21.8 (or up 1.87%) to close at 1187.77 last month. At the beginning of last month, NEPSE index showed bullish momentum by breaching the resistance of 50 days moving average. However, NEPSE index could not breach the 200 days moving average and retraced back forming a shooting star candle. Currently, NEPSE is trading above 50 days moving average and below 200 days moving says average. The average daily turnover has increased to NPR 45.14 crores from NPR 37.90 crores. Currently, NEPSE is trading above the retracement level of 38.2% of the recent swing from 1109.32 to 1232.74. Since NEPSE is trading above the 38.2% level, NEPSE still shows the presence of bullish sentiment in the market.</div>
<div>
</div>
<div>
<span style="font-size:16px;"><strong>Resistance and Support</strong></span></div>
<div>
</div>
<div style="text-align: center;">
<img alt="" src="/app/webroot/userfiles/images/Clipboard02%2817%29.jpg" style="width: 800px; height: 252px;" /></div>
<div>
</div>
<div>
In course of month, the index broke the resistance level of 1210, reached the high level of 1232.74 and retraced back to the low level of 1170.11. However, at the end of month, NEPSE showed bullish momentum and closed at 1187.77. The average traded volume was higher than the previous month indicating an increased market participation. The immediate support and resistance stand same at 1150 and 1210 respectively.</div>
<div>
</div>
<div>
<span style="font-size:16px;"><strong>Nepse Trend Indicator</strong></span></div>
<div>
<strong>a. MACD</strong></div>
<div>
The MACD is a momentum oscillator formed by using two different types of moving averages, which provides specific buying or selling signals. When a MACD line crosses above the signal line, it is considered to be a positive sign and indicates a time to buy, and vice-versa.</div>
<div>
</div>
<div>
The MACD and the signal line, at the beginning of last month, stood at -6.39 and –12.52 respectively. By the end of the month, MACD line and signal increased by 9.01 and 14.76 to close at 2.62 and 2.25 respectively. The MACD line crossed the signal line from the below indicating a bullish crossover in the market. Both lines are moving in the positive zone indicating a positive sign in the market.</div>
<div>
</div>
<div style="text-align: center;">
<img alt="" src="/app/webroot/userfiles/images/Clipboard09%2813%29.jpg" style="width: 800px; height: 152px;" /></div>
<div>
</div>
<div>
<strong>b. RSI</strong></div>
<div>
RSI is a form of leading indicator that is believed to be most effective during periods of sideways movement. Such indicators may create numerous buy and sell signals that are useful when the market is not clearly trending upwards or downwards.</div>
<div>
</div>
<div>
The RSI at the beginning of the month, stood at 50.19 level. In the course of month, RSI increased by 3.34 points to close at 53.53. Last month, RSI reached the high level of 64 and retraced back to the low level of 46. At the end of month, NEPSE showed some bullish momentum and RSI gained some points to close at 53.53. Positive divergence can be seen between the NEPSE and RSI as NEPSE and RSI are forming lower low and lower high.</div>
<div>
</div>
<div style="text-align: center;">
<img alt="" src="/app/webroot/userfiles/images/Clipboard10%2814%29.jpg" style="width: 800px; height: 138px;" /></div>
<div>
</div>
<div>
<strong>c. (OBV)</strong></div>
<div>
On balance volume is a momentum indicator that uses volume flow to predict changes in stock prices. It measures buying and selling pressure as a cumulative indicator that adds volume in up days and subtracts volume on down days.</div>
<div>
</div>
<div>
On balance volume at the beginning of last month, stood at -9.7 b level. In the course of month, it lost 2.4 b points to close at -12.1 b. Last month, OBV has decreased by 2.4 b indicating a rise of selling pressure in the market.</div>
<div>
</div>
<div style="text-align: center;">
<img alt="" src="/app/webroot/userfiles/images/Clipboard11%2817%29.jpg" style="width: 800px; height: 377px;" /></div>
<div>
</div>
<div>
<strong>d. Bollinger Bands</strong></div>
<div>
The Bollinger Band is a technical indicator that consists of a moving average (21-day) along with two trading bands above (upper band) and below it (lower band). The bands are an indication of volatility, which are represented by calculating standard deviation.</div>
<div>
At the beginning of the month, NEPSE index retraced back from the upper Bollinger band to the mid Bollinger band. However, at the mid-month, NEPSE showed sideways movement and closed at mid Bollinger band. The distance between upper and lower Bollinger band has decreased indicating a low volatility in the market.</div>
<div>
</div>
<div style="text-align: center;">
<img alt="" src="/app/webroot/userfiles/images/Clipboard12%2816%29.jpg" style="width: 800px; height: 139px;" /></div>
<div>
</div>
<div>
<strong>e. Overview</strong></div>
<div>
NEPSE index gained 21.8 (or up 1.87%) to close at 1187.77 last month. At the beginning of last month, NEPSE index showed bullish momentum by breaching the resistance of 50 days moving average. However, NEPSE index could not breach the 200 days moving average and retraced back forming a shooting star candle. Currently, NEPSE is trading above 50 days moving average and below 200 days moving average. The MACD line crossed the signal line from the below indicating a bullish crossover in the market. Both lines are moving in the positive zone indicating a positive sign in the market. Positive divergence can be seen between the NEPSE and RSI as NEPSE and RSI are forming lower low and lower high. Last month, OBV has decreased by 2.4 b indicating a rise of selling pressure in the market. The distance between upper and lower Bollinger band has decreased indicating a low volatility in the market. The immediate support and resistance stand same at 1150 and 1210 respectively. </div>
<div>
</div>
<div>
</div>
',
'status' => true,
'publish_date' => null,
'created' => '2019-02-15 12:42:48',
'modified' => '2019-02-15 12:45:32',
'keywords' => '',
'description' => '',
'sortorder' => '2353',
'feature_article' => true,
'user_id' => '11',
'image1' => null,
'image2' => null,
'image3' => null,
'image4' => null
),
'MagazineIssue' => array(
'id' => '995',
'image' => '20190214094935_NewBiz_February_Cover Page for web.jpg',
'sortorder' => '1543',
'published' => true,
'created' => '2019-02-11 11:16:33',
'modified' => '2019-02-14 09:49:36',
'title' => 'February 2019',
'publish_date' => '2019-02-01',
'parent_id' => '0',
'homepage' => true,
'user_id' => '11'
),
'MagazineCategory' => array(
'id' => '63',
'title' => 'Stock Taking',
'sortorder' => '516',
'status' => true,
'created' => '0000-00-00 00:00:00',
'homepage' => true,
'modified' => '2013-04-01 00:00:00'
),
'User' => array(
'password' => '*****',
'id' => '11',
'user_detail_id' => '0',
'group_id' => '24',
'username' => 'nsingha@abhiyan.com.np',
'name' => '',
'email' => 'nsingha@abhiyan.com.np',
'address' => '',
'gender' => '',
'access' => '1',
'phone' => '',
'access_type' => '0',
'activated' => false,
'sortorder' => '0',
'published' => '0',
'created' => '2015-04-08 13:22:59',
'last_login' => '2023-04-16 09:29:47',
'ip' => '172.69.77.43'
),
'MagazineArticleComment' => array(),
'MagazineView' => array(
(int) 0 => array(
'magazine_article_id' => '2403',
'hit' => '2540'
)
)
)
$current_user = null
$logged_in = false
$xml = false
include - APP/View/Elements/side_bar.ctp, line 133
View::_evaluate() - CORE/Cake/View/View.php, line 971
View::_render() - CORE/Cake/View/View.php, line 933
View::_renderElement() - CORE/Cake/View/View.php, line 1224
View::element() - CORE/Cake/View/View.php, line 418
include - APP/View/MagazineArticles/view.ctp, line 279
View::_evaluate() - CORE/Cake/View/View.php, line 971
View::_render() - CORE/Cake/View/View.php, line 933
View::render() - CORE/Cake/View/View.php, line 473
Controller::render() - CORE/Cake/Controller/Controller.php, line 968
Dispatcher::_invoke() - CORE/Cake/Routing/Dispatcher.php, line 200
Dispatcher::dispatch() - CORE/Cake/Routing/Dispatcher.php, line 167
[main] - APP/webroot/index.php, line 117
Warning (2): simplexml_load_file() [<a href='http://php.net/function.simplexml-load-file'>function.simplexml-load-file</a>]: I/O warning : failed to load external entity "" [APP/View/Elements/side_bar.ctp, line 133]
$viewFile = '/var/www/html/newbusinessage.com/app/View/Elements/side_bar.ctp'
$dataForView = array(
'magazineArticle' => array(
'MagazineArticle' => array(
'id' => '2403',
'magazine_issue_id' => '995',
'magazine_category_id' => '63',
'title' => 'Monthly Technical Analysis of Nepse (December 23rd 2018 – January 17th 2019)',
'image' => '20190215124248_Clipboard07.jpg',
'short_content' => 'NEPSE index gained 21.8 (or up 1.87%) to close at 1187.77 last month. At the beginning of last month, NEPSE index showed bullish momentum by breaching the resistance of 50 days moving average. However, NEPSE index could not breach the 200 days moving average and retraced back forming a shooting star candle. Currently, NEPSE is trading above 50 days moving average and below 200 days moving says average.',
'content' => '<div>
<span style="font-size:18px;"><strong>Shooting Star</strong></span></div>
<div>
</div>
<div style="text-align: center;">
<span style="font-size:16px;"><strong><img alt="" src="/app/webroot/userfiles/images/Clipboard05%2815%29.jpg" style="width: 800px; height: 799px;" /></strong></span></div>
<div>
</div>
<div>
<strong style="font-size: 16px;">Trend Analysis</strong></div>
<div>
</div>
<div style="text-align: center;">
<img alt="" src="/app/webroot/userfiles/images/Clipboard08%2816%29.jpg" style="width: 800px; height: 319px;" /></div>
<div>
</div>
<div>
NEPSE index gained 21.8 (or up 1.87%) to close at 1187.77 last month. At the beginning of last month, NEPSE index showed bullish momentum by breaching the resistance of 50 days moving average. However, NEPSE index could not breach the 200 days moving average and retraced back forming a shooting star candle. Currently, NEPSE is trading above 50 days moving average and below 200 days moving says average. The average daily turnover has increased to NPR 45.14 crores from NPR 37.90 crores. Currently, NEPSE is trading above the retracement level of 38.2% of the recent swing from 1109.32 to 1232.74. Since NEPSE is trading above the 38.2% level, NEPSE still shows the presence of bullish sentiment in the market.</div>
<div>
</div>
<div>
<span style="font-size:16px;"><strong>Resistance and Support</strong></span></div>
<div>
</div>
<div style="text-align: center;">
<img alt="" src="/app/webroot/userfiles/images/Clipboard02%2817%29.jpg" style="width: 800px; height: 252px;" /></div>
<div>
</div>
<div>
In course of month, the index broke the resistance level of 1210, reached the high level of 1232.74 and retraced back to the low level of 1170.11. However, at the end of month, NEPSE showed bullish momentum and closed at 1187.77. The average traded volume was higher than the previous month indicating an increased market participation. The immediate support and resistance stand same at 1150 and 1210 respectively.</div>
<div>
</div>
<div>
<span style="font-size:16px;"><strong>Nepse Trend Indicator</strong></span></div>
<div>
<strong>a. MACD</strong></div>
<div>
The MACD is a momentum oscillator formed by using two different types of moving averages, which provides specific buying or selling signals. When a MACD line crosses above the signal line, it is considered to be a positive sign and indicates a time to buy, and vice-versa.</div>
<div>
</div>
<div>
The MACD and the signal line, at the beginning of last month, stood at -6.39 and –12.52 respectively. By the end of the month, MACD line and signal increased by 9.01 and 14.76 to close at 2.62 and 2.25 respectively. The MACD line crossed the signal line from the below indicating a bullish crossover in the market. Both lines are moving in the positive zone indicating a positive sign in the market.</div>
<div>
</div>
<div style="text-align: center;">
<img alt="" src="/app/webroot/userfiles/images/Clipboard09%2813%29.jpg" style="width: 800px; height: 152px;" /></div>
<div>
</div>
<div>
<strong>b. RSI</strong></div>
<div>
RSI is a form of leading indicator that is believed to be most effective during periods of sideways movement. Such indicators may create numerous buy and sell signals that are useful when the market is not clearly trending upwards or downwards.</div>
<div>
</div>
<div>
The RSI at the beginning of the month, stood at 50.19 level. In the course of month, RSI increased by 3.34 points to close at 53.53. Last month, RSI reached the high level of 64 and retraced back to the low level of 46. At the end of month, NEPSE showed some bullish momentum and RSI gained some points to close at 53.53. Positive divergence can be seen between the NEPSE and RSI as NEPSE and RSI are forming lower low and lower high.</div>
<div>
</div>
<div style="text-align: center;">
<img alt="" src="/app/webroot/userfiles/images/Clipboard10%2814%29.jpg" style="width: 800px; height: 138px;" /></div>
<div>
</div>
<div>
<strong>c. (OBV)</strong></div>
<div>
On balance volume is a momentum indicator that uses volume flow to predict changes in stock prices. It measures buying and selling pressure as a cumulative indicator that adds volume in up days and subtracts volume on down days.</div>
<div>
</div>
<div>
On balance volume at the beginning of last month, stood at -9.7 b level. In the course of month, it lost 2.4 b points to close at -12.1 b. Last month, OBV has decreased by 2.4 b indicating a rise of selling pressure in the market.</div>
<div>
</div>
<div style="text-align: center;">
<img alt="" src="/app/webroot/userfiles/images/Clipboard11%2817%29.jpg" style="width: 800px; height: 377px;" /></div>
<div>
</div>
<div>
<strong>d. Bollinger Bands</strong></div>
<div>
The Bollinger Band is a technical indicator that consists of a moving average (21-day) along with two trading bands above (upper band) and below it (lower band). The bands are an indication of volatility, which are represented by calculating standard deviation.</div>
<div>
At the beginning of the month, NEPSE index retraced back from the upper Bollinger band to the mid Bollinger band. However, at the mid-month, NEPSE showed sideways movement and closed at mid Bollinger band. The distance between upper and lower Bollinger band has decreased indicating a low volatility in the market.</div>
<div>
</div>
<div style="text-align: center;">
<img alt="" src="/app/webroot/userfiles/images/Clipboard12%2816%29.jpg" style="width: 800px; height: 139px;" /></div>
<div>
</div>
<div>
<strong>e. Overview</strong></div>
<div>
NEPSE index gained 21.8 (or up 1.87%) to close at 1187.77 last month. At the beginning of last month, NEPSE index showed bullish momentum by breaching the resistance of 50 days moving average. However, NEPSE index could not breach the 200 days moving average and retraced back forming a shooting star candle. Currently, NEPSE is trading above 50 days moving average and below 200 days moving average. The MACD line crossed the signal line from the below indicating a bullish crossover in the market. Both lines are moving in the positive zone indicating a positive sign in the market. Positive divergence can be seen between the NEPSE and RSI as NEPSE and RSI are forming lower low and lower high. Last month, OBV has decreased by 2.4 b indicating a rise of selling pressure in the market. The distance between upper and lower Bollinger band has decreased indicating a low volatility in the market. The immediate support and resistance stand same at 1150 and 1210 respectively. </div>
<div>
</div>
<div>
</div>
',
'status' => true,
'publish_date' => null,
'created' => '2019-02-15 12:42:48',
'modified' => '2019-02-15 12:45:32',
'keywords' => '',
'description' => '',
'sortorder' => '2353',
'feature_article' => true,
'user_id' => '11',
'image1' => null,
'image2' => null,
'image3' => null,
'image4' => null
),
'MagazineIssue' => array(
'id' => '995',
'image' => '20190214094935_NewBiz_February_Cover Page for web.jpg',
'sortorder' => '1543',
'published' => true,
'created' => '2019-02-11 11:16:33',
'modified' => '2019-02-14 09:49:36',
'title' => 'February 2019',
'publish_date' => '2019-02-01',
'parent_id' => '0',
'homepage' => true,
'user_id' => '11'
),
'MagazineCategory' => array(
'id' => '63',
'title' => 'Stock Taking',
'sortorder' => '516',
'status' => true,
'created' => '0000-00-00 00:00:00',
'homepage' => true,
'modified' => '2013-04-01 00:00:00'
),
'User' => array(
'password' => '*****',
'id' => '11',
'user_detail_id' => '0',
'group_id' => '24',
'username' => 'nsingha@abhiyan.com.np',
'name' => '',
'email' => 'nsingha@abhiyan.com.np',
'address' => '',
'gender' => '',
'access' => '1',
'phone' => '',
'access_type' => '0',
'activated' => false,
'sortorder' => '0',
'published' => '0',
'created' => '2015-04-08 13:22:59',
'last_login' => '2023-04-16 09:29:47',
'ip' => '172.69.77.43'
),
'MagazineArticleComment' => array(),
'MagazineView' => array(
(int) 0 => array(
[maximum depth reached]
)
)
),
'current_user' => null,
'logged_in' => false
)
$magazineArticle = array(
'MagazineArticle' => array(
'id' => '2403',
'magazine_issue_id' => '995',
'magazine_category_id' => '63',
'title' => 'Monthly Technical Analysis of Nepse (December 23rd 2018 – January 17th 2019)',
'image' => '20190215124248_Clipboard07.jpg',
'short_content' => 'NEPSE index gained 21.8 (or up 1.87%) to close at 1187.77 last month. At the beginning of last month, NEPSE index showed bullish momentum by breaching the resistance of 50 days moving average. However, NEPSE index could not breach the 200 days moving average and retraced back forming a shooting star candle. Currently, NEPSE is trading above 50 days moving average and below 200 days moving says average.',
'content' => '<div>
<span style="font-size:18px;"><strong>Shooting Star</strong></span></div>
<div>
</div>
<div style="text-align: center;">
<span style="font-size:16px;"><strong><img alt="" src="/app/webroot/userfiles/images/Clipboard05%2815%29.jpg" style="width: 800px; height: 799px;" /></strong></span></div>
<div>
</div>
<div>
<strong style="font-size: 16px;">Trend Analysis</strong></div>
<div>
</div>
<div style="text-align: center;">
<img alt="" src="/app/webroot/userfiles/images/Clipboard08%2816%29.jpg" style="width: 800px; height: 319px;" /></div>
<div>
</div>
<div>
NEPSE index gained 21.8 (or up 1.87%) to close at 1187.77 last month. At the beginning of last month, NEPSE index showed bullish momentum by breaching the resistance of 50 days moving average. However, NEPSE index could not breach the 200 days moving average and retraced back forming a shooting star candle. Currently, NEPSE is trading above 50 days moving average and below 200 days moving says average. The average daily turnover has increased to NPR 45.14 crores from NPR 37.90 crores. Currently, NEPSE is trading above the retracement level of 38.2% of the recent swing from 1109.32 to 1232.74. Since NEPSE is trading above the 38.2% level, NEPSE still shows the presence of bullish sentiment in the market.</div>
<div>
</div>
<div>
<span style="font-size:16px;"><strong>Resistance and Support</strong></span></div>
<div>
</div>
<div style="text-align: center;">
<img alt="" src="/app/webroot/userfiles/images/Clipboard02%2817%29.jpg" style="width: 800px; height: 252px;" /></div>
<div>
</div>
<div>
In course of month, the index broke the resistance level of 1210, reached the high level of 1232.74 and retraced back to the low level of 1170.11. However, at the end of month, NEPSE showed bullish momentum and closed at 1187.77. The average traded volume was higher than the previous month indicating an increased market participation. The immediate support and resistance stand same at 1150 and 1210 respectively.</div>
<div>
</div>
<div>
<span style="font-size:16px;"><strong>Nepse Trend Indicator</strong></span></div>
<div>
<strong>a. MACD</strong></div>
<div>
The MACD is a momentum oscillator formed by using two different types of moving averages, which provides specific buying or selling signals. When a MACD line crosses above the signal line, it is considered to be a positive sign and indicates a time to buy, and vice-versa.</div>
<div>
</div>
<div>
The MACD and the signal line, at the beginning of last month, stood at -6.39 and –12.52 respectively. By the end of the month, MACD line and signal increased by 9.01 and 14.76 to close at 2.62 and 2.25 respectively. The MACD line crossed the signal line from the below indicating a bullish crossover in the market. Both lines are moving in the positive zone indicating a positive sign in the market.</div>
<div>
</div>
<div style="text-align: center;">
<img alt="" src="/app/webroot/userfiles/images/Clipboard09%2813%29.jpg" style="width: 800px; height: 152px;" /></div>
<div>
</div>
<div>
<strong>b. RSI</strong></div>
<div>
RSI is a form of leading indicator that is believed to be most effective during periods of sideways movement. Such indicators may create numerous buy and sell signals that are useful when the market is not clearly trending upwards or downwards.</div>
<div>
</div>
<div>
The RSI at the beginning of the month, stood at 50.19 level. In the course of month, RSI increased by 3.34 points to close at 53.53. Last month, RSI reached the high level of 64 and retraced back to the low level of 46. At the end of month, NEPSE showed some bullish momentum and RSI gained some points to close at 53.53. Positive divergence can be seen between the NEPSE and RSI as NEPSE and RSI are forming lower low and lower high.</div>
<div>
</div>
<div style="text-align: center;">
<img alt="" src="/app/webroot/userfiles/images/Clipboard10%2814%29.jpg" style="width: 800px; height: 138px;" /></div>
<div>
</div>
<div>
<strong>c. (OBV)</strong></div>
<div>
On balance volume is a momentum indicator that uses volume flow to predict changes in stock prices. It measures buying and selling pressure as a cumulative indicator that adds volume in up days and subtracts volume on down days.</div>
<div>
</div>
<div>
On balance volume at the beginning of last month, stood at -9.7 b level. In the course of month, it lost 2.4 b points to close at -12.1 b. Last month, OBV has decreased by 2.4 b indicating a rise of selling pressure in the market.</div>
<div>
</div>
<div style="text-align: center;">
<img alt="" src="/app/webroot/userfiles/images/Clipboard11%2817%29.jpg" style="width: 800px; height: 377px;" /></div>
<div>
</div>
<div>
<strong>d. Bollinger Bands</strong></div>
<div>
The Bollinger Band is a technical indicator that consists of a moving average (21-day) along with two trading bands above (upper band) and below it (lower band). The bands are an indication of volatility, which are represented by calculating standard deviation.</div>
<div>
At the beginning of the month, NEPSE index retraced back from the upper Bollinger band to the mid Bollinger band. However, at the mid-month, NEPSE showed sideways movement and closed at mid Bollinger band. The distance between upper and lower Bollinger band has decreased indicating a low volatility in the market.</div>
<div>
</div>
<div style="text-align: center;">
<img alt="" src="/app/webroot/userfiles/images/Clipboard12%2816%29.jpg" style="width: 800px; height: 139px;" /></div>
<div>
</div>
<div>
<strong>e. Overview</strong></div>
<div>
NEPSE index gained 21.8 (or up 1.87%) to close at 1187.77 last month. At the beginning of last month, NEPSE index showed bullish momentum by breaching the resistance of 50 days moving average. However, NEPSE index could not breach the 200 days moving average and retraced back forming a shooting star candle. Currently, NEPSE is trading above 50 days moving average and below 200 days moving average. The MACD line crossed the signal line from the below indicating a bullish crossover in the market. Both lines are moving in the positive zone indicating a positive sign in the market. Positive divergence can be seen between the NEPSE and RSI as NEPSE and RSI are forming lower low and lower high. Last month, OBV has decreased by 2.4 b indicating a rise of selling pressure in the market. The distance between upper and lower Bollinger band has decreased indicating a low volatility in the market. The immediate support and resistance stand same at 1150 and 1210 respectively. </div>
<div>
</div>
<div>
</div>
',
'status' => true,
'publish_date' => null,
'created' => '2019-02-15 12:42:48',
'modified' => '2019-02-15 12:45:32',
'keywords' => '',
'description' => '',
'sortorder' => '2353',
'feature_article' => true,
'user_id' => '11',
'image1' => null,
'image2' => null,
'image3' => null,
'image4' => null
),
'MagazineIssue' => array(
'id' => '995',
'image' => '20190214094935_NewBiz_February_Cover Page for web.jpg',
'sortorder' => '1543',
'published' => true,
'created' => '2019-02-11 11:16:33',
'modified' => '2019-02-14 09:49:36',
'title' => 'February 2019',
'publish_date' => '2019-02-01',
'parent_id' => '0',
'homepage' => true,
'user_id' => '11'
),
'MagazineCategory' => array(
'id' => '63',
'title' => 'Stock Taking',
'sortorder' => '516',
'status' => true,
'created' => '0000-00-00 00:00:00',
'homepage' => true,
'modified' => '2013-04-01 00:00:00'
),
'User' => array(
'password' => '*****',
'id' => '11',
'user_detail_id' => '0',
'group_id' => '24',
'username' => 'nsingha@abhiyan.com.np',
'name' => '',
'email' => 'nsingha@abhiyan.com.np',
'address' => '',
'gender' => '',
'access' => '1',
'phone' => '',
'access_type' => '0',
'activated' => false,
'sortorder' => '0',
'published' => '0',
'created' => '2015-04-08 13:22:59',
'last_login' => '2023-04-16 09:29:47',
'ip' => '172.69.77.43'
),
'MagazineArticleComment' => array(),
'MagazineView' => array(
(int) 0 => array(
'magazine_article_id' => '2403',
'hit' => '2540'
)
)
)
$current_user = null
$logged_in = false
$xml = false
simplexml_load_file - [internal], line ??
include - APP/View/Elements/side_bar.ctp, line 133
View::_evaluate() - CORE/Cake/View/View.php, line 971
View::_render() - CORE/Cake/View/View.php, line 933
View::_renderElement() - CORE/Cake/View/View.php, line 1224
View::element() - CORE/Cake/View/View.php, line 418
include - APP/View/MagazineArticles/view.ctp, line 279
View::_evaluate() - CORE/Cake/View/View.php, line 971
View::_render() - CORE/Cake/View/View.php, line 933
View::render() - CORE/Cake/View/View.php, line 473
Controller::render() - CORE/Cake/Controller/Controller.php, line 968
Dispatcher::_invoke() - CORE/Cake/Routing/Dispatcher.php, line 200
Dispatcher::dispatch() - CORE/Cake/Routing/Dispatcher.php, line 167
[main] - APP/webroot/index.php, line 117