Notice (8): Trying to access array offset on value of type null [APP/View/MagazineArticles/view.ctp, line 54]Code Context $user = $this->Session->read('Auth.User');
//find the group of logged user
$groupId = $user['Group']['id'];
$viewFile = '/var/www/html/newbusinessage.com/app/View/MagazineArticles/view.ctp'
$dataForView = array(
'magazineArticle' => array(
'MagazineArticle' => array(
'id' => '993',
'magazine_issue_id' => '730',
'magazine_category_id' => '63',
'title' => 'Monthly Technical Analysis of Nepse November 2014',
'image' => null,
'short_content' => 'After two continuous trading periods of huge declines, Nepse has stabilized in recent times. Compared to the previous period, Nepse made an upward gain of 25.96 points (or 2.88%) closing at 925.85 points. ',
'content' => '<div><img alt="" src="/userfiles/images/ta(4).jpg" style="height:364px; margin-left:10px; margin-right:10px; width:720px" /></div>
<div> </div>
<div><strong>Market Trend</strong></div>
<div> </div>
<div><img alt="" src="/userfiles/images/ta1(1).JPG" style="height:350px; margin-left:10px; margin-right:10px; width:720px" /></div>
<div> </div>
<div>After two continuous trading periods of huge declines, Nepse has stabilized in recent times. Compared to the previous period, Nepse made an upward gain of 25.96 points (or 2.88%) closing at 925.85 points. However, ever since it fell below the 50-day moving average, Nepse has not been able to move above the line. The current resistance and support levels stand at 972.17 and 917.58 points. This trading period, the secondary market has witnessed a huge drop in volume of a mere NPR 22.73 crores. The same figure for the last period was NPR 45.46 crores, while it was NPR NPR 52.92 crores prior to that. This decreasing trend in volume has been a significant factor towards the secondary market’s inability to gain footing in the positive direction. The market is in need of increasing volume trend thatcan help it move past the 50-day moving average. </div>
<div> </div>
<div><strong>RSI </strong></div>
<div> </div>
<div><img alt="" src="/userfiles/images/ta2.JPG" style="height:170px; margin-left:10px; margin-right:10px; width:720px" /></div>
<div> </div>
<div>Relative Strength Indicator is a form of leading indicator that is believed to be most effective during periods of sideways movement. Such indicators may create numerous buy and sell signals that are useful when the market is not clearly trending upwards or downwards. </div>
<div> </div>
<div>Since the previous period, the RSI has maintained above the oversold zone. The highest level reached during this period was 51.42, which suggest that there has not been enough buying pressure in the market to push it higher. By the end of the trading period, the RSI stood just below the centerline at 49.42 level. </div>
<div> </div>
<div><strong>MACD </strong></div>
<div> </div>
<div><img alt="" src="/userfiles/images/ta3.JPG" style="height:226px; margin-left:10px; margin-right:10px; width:720px" /></div>
<div> </div>
<div>The MACD is a momentum oscillator formed by using two different types of moving averages, which provides specific buying or selling signals. When a MACD line crosses above the signal line, it is considered to be a positive sign and indicates a time to buy, and vice-versa. </div>
<div> </div>
<div>During the initial days of this trading period, there was a fall in MACD line’s rate of decline. As a result, on September 24, 2014, the MACD line crossed above the Signal line indicating a buy signal. Though there has been less volume in the market, the MACD and Signal lines are gradually shaping upwards suggesting positive momentum in recent times. </div>
<div> </div>
<div><strong>Bollinger Bands</strong></div>
<div> </div>
<div><img alt="" src="/userfiles/images/ta4.jpg" style="height:322px; margin-left:10px; margin-right:10px; width:720px" /></div>
<div> </div>
<div>The Bollinger Band is a technical indicator that consists of a moving average (21-day) along with two trading bands above (upper band) and below it (lower band). The bands are an indication of volatility, which is represented by calculating standard deviation. </div>
<div> </div>
<div>Nepse remained below the mid-band at the beginning of this period. However, on September 28, 2014, the index crossed above the mid-band indicating a buy signal. Since then, Nepse has been able to maintain between the mid-band and upper band. The upper and lower bands have narrowed suggesting decreasing volatility in the market.</div>
',
'status' => true,
'publish_date' => '0000-00-00',
'created' => '2014-11-13 00:00:00',
'modified' => '2015-09-07 12:30:01',
'keywords' => '',
'description' => 'After two continuous trading periods of huge declines, Nepse has stabilized in recent times. Compared to the previous period, Nepse made an upward gain of 25.96 points (or 2.88%) closing at 925.85 points. However, ever since it fell below the 50-day moving average, Nepse has not been able to move above the line. The current resistance and support levels stand at 972.17 and 917.58 points. ',
'sortorder' => '966',
'feature_article' => true,
'user_id' => '0',
'image1' => null,
'image2' => null,
'image3' => null,
'image4' => null
),
'MagazineIssue' => array(
'id' => '730',
'image' => 'small_1415598599.jpg',
'sortorder' => '625',
'published' => true,
'created' => '2014-11-09 10:50:18',
'modified' => '2015-08-30 14:05:58',
'title' => 'November 2014',
'publish_date' => '2014-11-01',
'parent_id' => '0',
'homepage' => false,
'user_id' => '0'
),
'MagazineCategory' => array(
'id' => '63',
'title' => 'Stock Taking',
'sortorder' => '516',
'status' => true,
'created' => '0000-00-00 00:00:00',
'homepage' => true,
'modified' => '2013-04-01 00:00:00'
),
'User' => array(
'password' => '*****',
'id' => null,
'user_detail_id' => null,
'group_id' => null,
'username' => null,
'name' => null,
'email' => null,
'address' => null,
'gender' => null,
'access' => null,
'phone' => null,
'access_type' => null,
'activated' => null,
'sortorder' => null,
'published' => null,
'created' => null,
'last_login' => null,
'ip' => null
),
'MagazineArticleComment' => array(),
'MagazineView' => array(
(int) 0 => array(
[maximum depth reached]
)
)
),
'current_user' => null,
'logged_in' => false
)
$magazineArticle = array(
'MagazineArticle' => array(
'id' => '993',
'magazine_issue_id' => '730',
'magazine_category_id' => '63',
'title' => 'Monthly Technical Analysis of Nepse November 2014',
'image' => null,
'short_content' => 'After two continuous trading periods of huge declines, Nepse has stabilized in recent times. Compared to the previous period, Nepse made an upward gain of 25.96 points (or 2.88%) closing at 925.85 points. ',
'content' => '<div><img alt="" src="/userfiles/images/ta(4).jpg" style="height:364px; margin-left:10px; margin-right:10px; width:720px" /></div>
<div> </div>
<div><strong>Market Trend</strong></div>
<div> </div>
<div><img alt="" src="/userfiles/images/ta1(1).JPG" style="height:350px; margin-left:10px; margin-right:10px; width:720px" /></div>
<div> </div>
<div>After two continuous trading periods of huge declines, Nepse has stabilized in recent times. Compared to the previous period, Nepse made an upward gain of 25.96 points (or 2.88%) closing at 925.85 points. However, ever since it fell below the 50-day moving average, Nepse has not been able to move above the line. The current resistance and support levels stand at 972.17 and 917.58 points. This trading period, the secondary market has witnessed a huge drop in volume of a mere NPR 22.73 crores. The same figure for the last period was NPR 45.46 crores, while it was NPR NPR 52.92 crores prior to that. This decreasing trend in volume has been a significant factor towards the secondary market’s inability to gain footing in the positive direction. The market is in need of increasing volume trend thatcan help it move past the 50-day moving average. </div>
<div> </div>
<div><strong>RSI </strong></div>
<div> </div>
<div><img alt="" src="/userfiles/images/ta2.JPG" style="height:170px; margin-left:10px; margin-right:10px; width:720px" /></div>
<div> </div>
<div>Relative Strength Indicator is a form of leading indicator that is believed to be most effective during periods of sideways movement. Such indicators may create numerous buy and sell signals that are useful when the market is not clearly trending upwards or downwards. </div>
<div> </div>
<div>Since the previous period, the RSI has maintained above the oversold zone. The highest level reached during this period was 51.42, which suggest that there has not been enough buying pressure in the market to push it higher. By the end of the trading period, the RSI stood just below the centerline at 49.42 level. </div>
<div> </div>
<div><strong>MACD </strong></div>
<div> </div>
<div><img alt="" src="/userfiles/images/ta3.JPG" style="height:226px; margin-left:10px; margin-right:10px; width:720px" /></div>
<div> </div>
<div>The MACD is a momentum oscillator formed by using two different types of moving averages, which provides specific buying or selling signals. When a MACD line crosses above the signal line, it is considered to be a positive sign and indicates a time to buy, and vice-versa. </div>
<div> </div>
<div>During the initial days of this trading period, there was a fall in MACD line’s rate of decline. As a result, on September 24, 2014, the MACD line crossed above the Signal line indicating a buy signal. Though there has been less volume in the market, the MACD and Signal lines are gradually shaping upwards suggesting positive momentum in recent times. </div>
<div> </div>
<div><strong>Bollinger Bands</strong></div>
<div> </div>
<div><img alt="" src="/userfiles/images/ta4.jpg" style="height:322px; margin-left:10px; margin-right:10px; width:720px" /></div>
<div> </div>
<div>The Bollinger Band is a technical indicator that consists of a moving average (21-day) along with two trading bands above (upper band) and below it (lower band). The bands are an indication of volatility, which is represented by calculating standard deviation. </div>
<div> </div>
<div>Nepse remained below the mid-band at the beginning of this period. However, on September 28, 2014, the index crossed above the mid-band indicating a buy signal. Since then, Nepse has been able to maintain between the mid-band and upper band. The upper and lower bands have narrowed suggesting decreasing volatility in the market.</div>
',
'status' => true,
'publish_date' => '0000-00-00',
'created' => '2014-11-13 00:00:00',
'modified' => '2015-09-07 12:30:01',
'keywords' => '',
'description' => 'After two continuous trading periods of huge declines, Nepse has stabilized in recent times. Compared to the previous period, Nepse made an upward gain of 25.96 points (or 2.88%) closing at 925.85 points. However, ever since it fell below the 50-day moving average, Nepse has not been able to move above the line. The current resistance and support levels stand at 972.17 and 917.58 points. ',
'sortorder' => '966',
'feature_article' => true,
'user_id' => '0',
'image1' => null,
'image2' => null,
'image3' => null,
'image4' => null
),
'MagazineIssue' => array(
'id' => '730',
'image' => 'small_1415598599.jpg',
'sortorder' => '625',
'published' => true,
'created' => '2014-11-09 10:50:18',
'modified' => '2015-08-30 14:05:58',
'title' => 'November 2014',
'publish_date' => '2014-11-01',
'parent_id' => '0',
'homepage' => false,
'user_id' => '0'
),
'MagazineCategory' => array(
'id' => '63',
'title' => 'Stock Taking',
'sortorder' => '516',
'status' => true,
'created' => '0000-00-00 00:00:00',
'homepage' => true,
'modified' => '2013-04-01 00:00:00'
),
'User' => array(
'password' => '*****',
'id' => null,
'user_detail_id' => null,
'group_id' => null,
'username' => null,
'name' => null,
'email' => null,
'address' => null,
'gender' => null,
'access' => null,
'phone' => null,
'access_type' => null,
'activated' => null,
'sortorder' => null,
'published' => null,
'created' => null,
'last_login' => null,
'ip' => null
),
'MagazineArticleComment' => array(),
'MagazineView' => array(
(int) 0 => array(
'magazine_article_id' => '993',
'hit' => '3857'
)
)
)
$current_user = null
$logged_in = false
$user = null
include - APP/View/MagazineArticles/view.ctp, line 54
View::_evaluate() - CORE/Cake/View/View.php, line 971
View::_render() - CORE/Cake/View/View.php, line 933
View::render() - CORE/Cake/View/View.php, line 473
Controller::render() - CORE/Cake/Controller/Controller.php, line 968
Dispatcher::_invoke() - CORE/Cake/Routing/Dispatcher.php, line 200
Dispatcher::dispatch() - CORE/Cake/Routing/Dispatcher.php, line 167
[main] - APP/webroot/index.php, line 117
Notice (8): Trying to access array offset on value of type null [APP/View/MagazineArticles/view.ctp, line 55]Code Context //find the group of logged user
$groupId = $user['Group']['id'];
$user_id=$user["id"];
$viewFile = '/var/www/html/newbusinessage.com/app/View/MagazineArticles/view.ctp'
$dataForView = array(
'magazineArticle' => array(
'MagazineArticle' => array(
'id' => '993',
'magazine_issue_id' => '730',
'magazine_category_id' => '63',
'title' => 'Monthly Technical Analysis of Nepse November 2014',
'image' => null,
'short_content' => 'After two continuous trading periods of huge declines, Nepse has stabilized in recent times. Compared to the previous period, Nepse made an upward gain of 25.96 points (or 2.88%) closing at 925.85 points. ',
'content' => '<div><img alt="" src="/userfiles/images/ta(4).jpg" style="height:364px; margin-left:10px; margin-right:10px; width:720px" /></div>
<div> </div>
<div><strong>Market Trend</strong></div>
<div> </div>
<div><img alt="" src="/userfiles/images/ta1(1).JPG" style="height:350px; margin-left:10px; margin-right:10px; width:720px" /></div>
<div> </div>
<div>After two continuous trading periods of huge declines, Nepse has stabilized in recent times. Compared to the previous period, Nepse made an upward gain of 25.96 points (or 2.88%) closing at 925.85 points. However, ever since it fell below the 50-day moving average, Nepse has not been able to move above the line. The current resistance and support levels stand at 972.17 and 917.58 points. This trading period, the secondary market has witnessed a huge drop in volume of a mere NPR 22.73 crores. The same figure for the last period was NPR 45.46 crores, while it was NPR NPR 52.92 crores prior to that. This decreasing trend in volume has been a significant factor towards the secondary market’s inability to gain footing in the positive direction. The market is in need of increasing volume trend thatcan help it move past the 50-day moving average. </div>
<div> </div>
<div><strong>RSI </strong></div>
<div> </div>
<div><img alt="" src="/userfiles/images/ta2.JPG" style="height:170px; margin-left:10px; margin-right:10px; width:720px" /></div>
<div> </div>
<div>Relative Strength Indicator is a form of leading indicator that is believed to be most effective during periods of sideways movement. Such indicators may create numerous buy and sell signals that are useful when the market is not clearly trending upwards or downwards. </div>
<div> </div>
<div>Since the previous period, the RSI has maintained above the oversold zone. The highest level reached during this period was 51.42, which suggest that there has not been enough buying pressure in the market to push it higher. By the end of the trading period, the RSI stood just below the centerline at 49.42 level. </div>
<div> </div>
<div><strong>MACD </strong></div>
<div> </div>
<div><img alt="" src="/userfiles/images/ta3.JPG" style="height:226px; margin-left:10px; margin-right:10px; width:720px" /></div>
<div> </div>
<div>The MACD is a momentum oscillator formed by using two different types of moving averages, which provides specific buying or selling signals. When a MACD line crosses above the signal line, it is considered to be a positive sign and indicates a time to buy, and vice-versa. </div>
<div> </div>
<div>During the initial days of this trading period, there was a fall in MACD line’s rate of decline. As a result, on September 24, 2014, the MACD line crossed above the Signal line indicating a buy signal. Though there has been less volume in the market, the MACD and Signal lines are gradually shaping upwards suggesting positive momentum in recent times. </div>
<div> </div>
<div><strong>Bollinger Bands</strong></div>
<div> </div>
<div><img alt="" src="/userfiles/images/ta4.jpg" style="height:322px; margin-left:10px; margin-right:10px; width:720px" /></div>
<div> </div>
<div>The Bollinger Band is a technical indicator that consists of a moving average (21-day) along with two trading bands above (upper band) and below it (lower band). The bands are an indication of volatility, which is represented by calculating standard deviation. </div>
<div> </div>
<div>Nepse remained below the mid-band at the beginning of this period. However, on September 28, 2014, the index crossed above the mid-band indicating a buy signal. Since then, Nepse has been able to maintain between the mid-band and upper band. The upper and lower bands have narrowed suggesting decreasing volatility in the market.</div>
',
'status' => true,
'publish_date' => '0000-00-00',
'created' => '2014-11-13 00:00:00',
'modified' => '2015-09-07 12:30:01',
'keywords' => '',
'description' => 'After two continuous trading periods of huge declines, Nepse has stabilized in recent times. Compared to the previous period, Nepse made an upward gain of 25.96 points (or 2.88%) closing at 925.85 points. However, ever since it fell below the 50-day moving average, Nepse has not been able to move above the line. The current resistance and support levels stand at 972.17 and 917.58 points. ',
'sortorder' => '966',
'feature_article' => true,
'user_id' => '0',
'image1' => null,
'image2' => null,
'image3' => null,
'image4' => null
),
'MagazineIssue' => array(
'id' => '730',
'image' => 'small_1415598599.jpg',
'sortorder' => '625',
'published' => true,
'created' => '2014-11-09 10:50:18',
'modified' => '2015-08-30 14:05:58',
'title' => 'November 2014',
'publish_date' => '2014-11-01',
'parent_id' => '0',
'homepage' => false,
'user_id' => '0'
),
'MagazineCategory' => array(
'id' => '63',
'title' => 'Stock Taking',
'sortorder' => '516',
'status' => true,
'created' => '0000-00-00 00:00:00',
'homepage' => true,
'modified' => '2013-04-01 00:00:00'
),
'User' => array(
'password' => '*****',
'id' => null,
'user_detail_id' => null,
'group_id' => null,
'username' => null,
'name' => null,
'email' => null,
'address' => null,
'gender' => null,
'access' => null,
'phone' => null,
'access_type' => null,
'activated' => null,
'sortorder' => null,
'published' => null,
'created' => null,
'last_login' => null,
'ip' => null
),
'MagazineArticleComment' => array(),
'MagazineView' => array(
(int) 0 => array(
[maximum depth reached]
)
)
),
'current_user' => null,
'logged_in' => false
)
$magazineArticle = array(
'MagazineArticle' => array(
'id' => '993',
'magazine_issue_id' => '730',
'magazine_category_id' => '63',
'title' => 'Monthly Technical Analysis of Nepse November 2014',
'image' => null,
'short_content' => 'After two continuous trading periods of huge declines, Nepse has stabilized in recent times. Compared to the previous period, Nepse made an upward gain of 25.96 points (or 2.88%) closing at 925.85 points. ',
'content' => '<div><img alt="" src="/userfiles/images/ta(4).jpg" style="height:364px; margin-left:10px; margin-right:10px; width:720px" /></div>
<div> </div>
<div><strong>Market Trend</strong></div>
<div> </div>
<div><img alt="" src="/userfiles/images/ta1(1).JPG" style="height:350px; margin-left:10px; margin-right:10px; width:720px" /></div>
<div> </div>
<div>After two continuous trading periods of huge declines, Nepse has stabilized in recent times. Compared to the previous period, Nepse made an upward gain of 25.96 points (or 2.88%) closing at 925.85 points. However, ever since it fell below the 50-day moving average, Nepse has not been able to move above the line. The current resistance and support levels stand at 972.17 and 917.58 points. This trading period, the secondary market has witnessed a huge drop in volume of a mere NPR 22.73 crores. The same figure for the last period was NPR 45.46 crores, while it was NPR NPR 52.92 crores prior to that. This decreasing trend in volume has been a significant factor towards the secondary market’s inability to gain footing in the positive direction. The market is in need of increasing volume trend thatcan help it move past the 50-day moving average. </div>
<div> </div>
<div><strong>RSI </strong></div>
<div> </div>
<div><img alt="" src="/userfiles/images/ta2.JPG" style="height:170px; margin-left:10px; margin-right:10px; width:720px" /></div>
<div> </div>
<div>Relative Strength Indicator is a form of leading indicator that is believed to be most effective during periods of sideways movement. Such indicators may create numerous buy and sell signals that are useful when the market is not clearly trending upwards or downwards. </div>
<div> </div>
<div>Since the previous period, the RSI has maintained above the oversold zone. The highest level reached during this period was 51.42, which suggest that there has not been enough buying pressure in the market to push it higher. By the end of the trading period, the RSI stood just below the centerline at 49.42 level. </div>
<div> </div>
<div><strong>MACD </strong></div>
<div> </div>
<div><img alt="" src="/userfiles/images/ta3.JPG" style="height:226px; margin-left:10px; margin-right:10px; width:720px" /></div>
<div> </div>
<div>The MACD is a momentum oscillator formed by using two different types of moving averages, which provides specific buying or selling signals. When a MACD line crosses above the signal line, it is considered to be a positive sign and indicates a time to buy, and vice-versa. </div>
<div> </div>
<div>During the initial days of this trading period, there was a fall in MACD line’s rate of decline. As a result, on September 24, 2014, the MACD line crossed above the Signal line indicating a buy signal. Though there has been less volume in the market, the MACD and Signal lines are gradually shaping upwards suggesting positive momentum in recent times. </div>
<div> </div>
<div><strong>Bollinger Bands</strong></div>
<div> </div>
<div><img alt="" src="/userfiles/images/ta4.jpg" style="height:322px; margin-left:10px; margin-right:10px; width:720px" /></div>
<div> </div>
<div>The Bollinger Band is a technical indicator that consists of a moving average (21-day) along with two trading bands above (upper band) and below it (lower band). The bands are an indication of volatility, which is represented by calculating standard deviation. </div>
<div> </div>
<div>Nepse remained below the mid-band at the beginning of this period. However, on September 28, 2014, the index crossed above the mid-band indicating a buy signal. Since then, Nepse has been able to maintain between the mid-band and upper band. The upper and lower bands have narrowed suggesting decreasing volatility in the market.</div>
',
'status' => true,
'publish_date' => '0000-00-00',
'created' => '2014-11-13 00:00:00',
'modified' => '2015-09-07 12:30:01',
'keywords' => '',
'description' => 'After two continuous trading periods of huge declines, Nepse has stabilized in recent times. Compared to the previous period, Nepse made an upward gain of 25.96 points (or 2.88%) closing at 925.85 points. However, ever since it fell below the 50-day moving average, Nepse has not been able to move above the line. The current resistance and support levels stand at 972.17 and 917.58 points. ',
'sortorder' => '966',
'feature_article' => true,
'user_id' => '0',
'image1' => null,
'image2' => null,
'image3' => null,
'image4' => null
),
'MagazineIssue' => array(
'id' => '730',
'image' => 'small_1415598599.jpg',
'sortorder' => '625',
'published' => true,
'created' => '2014-11-09 10:50:18',
'modified' => '2015-08-30 14:05:58',
'title' => 'November 2014',
'publish_date' => '2014-11-01',
'parent_id' => '0',
'homepage' => false,
'user_id' => '0'
),
'MagazineCategory' => array(
'id' => '63',
'title' => 'Stock Taking',
'sortorder' => '516',
'status' => true,
'created' => '0000-00-00 00:00:00',
'homepage' => true,
'modified' => '2013-04-01 00:00:00'
),
'User' => array(
'password' => '*****',
'id' => null,
'user_detail_id' => null,
'group_id' => null,
'username' => null,
'name' => null,
'email' => null,
'address' => null,
'gender' => null,
'access' => null,
'phone' => null,
'access_type' => null,
'activated' => null,
'sortorder' => null,
'published' => null,
'created' => null,
'last_login' => null,
'ip' => null
),
'MagazineArticleComment' => array(),
'MagazineView' => array(
(int) 0 => array(
'magazine_article_id' => '993',
'hit' => '3857'
)
)
)
$current_user = null
$logged_in = false
$user = null
$groupId = null
include - APP/View/MagazineArticles/view.ctp, line 55
View::_evaluate() - CORE/Cake/View/View.php, line 971
View::_render() - CORE/Cake/View/View.php, line 933
View::render() - CORE/Cake/View/View.php, line 473
Controller::render() - CORE/Cake/Controller/Controller.php, line 968
Dispatcher::_invoke() - CORE/Cake/Routing/Dispatcher.php, line 200
Dispatcher::dispatch() - CORE/Cake/Routing/Dispatcher.php, line 167
[main] - APP/webroot/index.php, line 117
Notice (8): Undefined index: summary [APP/View/MagazineArticles/view.ctp, line 62]Code Context<?php
echo $this->Html->meta(array('name' => 'description', 'type' => 'meta', 'content' => $magazineArticle['MagazineArticle']['summary']), null, array('inline' => false));?>
$viewFile = '/var/www/html/newbusinessage.com/app/View/MagazineArticles/view.ctp'
$dataForView = array(
'magazineArticle' => array(
'MagazineArticle' => array(
'id' => '993',
'magazine_issue_id' => '730',
'magazine_category_id' => '63',
'title' => 'Monthly Technical Analysis of Nepse November 2014',
'image' => null,
'short_content' => 'After two continuous trading periods of huge declines, Nepse has stabilized in recent times. Compared to the previous period, Nepse made an upward gain of 25.96 points (or 2.88%) closing at 925.85 points. ',
'content' => '<div><img alt="" src="/userfiles/images/ta(4).jpg" style="height:364px; margin-left:10px; margin-right:10px; width:720px" /></div>
<div> </div>
<div><strong>Market Trend</strong></div>
<div> </div>
<div><img alt="" src="/userfiles/images/ta1(1).JPG" style="height:350px; margin-left:10px; margin-right:10px; width:720px" /></div>
<div> </div>
<div>After two continuous trading periods of huge declines, Nepse has stabilized in recent times. Compared to the previous period, Nepse made an upward gain of 25.96 points (or 2.88%) closing at 925.85 points. However, ever since it fell below the 50-day moving average, Nepse has not been able to move above the line. The current resistance and support levels stand at 972.17 and 917.58 points. This trading period, the secondary market has witnessed a huge drop in volume of a mere NPR 22.73 crores. The same figure for the last period was NPR 45.46 crores, while it was NPR NPR 52.92 crores prior to that. This decreasing trend in volume has been a significant factor towards the secondary market’s inability to gain footing in the positive direction. The market is in need of increasing volume trend thatcan help it move past the 50-day moving average. </div>
<div> </div>
<div><strong>RSI </strong></div>
<div> </div>
<div><img alt="" src="/userfiles/images/ta2.JPG" style="height:170px; margin-left:10px; margin-right:10px; width:720px" /></div>
<div> </div>
<div>Relative Strength Indicator is a form of leading indicator that is believed to be most effective during periods of sideways movement. Such indicators may create numerous buy and sell signals that are useful when the market is not clearly trending upwards or downwards. </div>
<div> </div>
<div>Since the previous period, the RSI has maintained above the oversold zone. The highest level reached during this period was 51.42, which suggest that there has not been enough buying pressure in the market to push it higher. By the end of the trading period, the RSI stood just below the centerline at 49.42 level. </div>
<div> </div>
<div><strong>MACD </strong></div>
<div> </div>
<div><img alt="" src="/userfiles/images/ta3.JPG" style="height:226px; margin-left:10px; margin-right:10px; width:720px" /></div>
<div> </div>
<div>The MACD is a momentum oscillator formed by using two different types of moving averages, which provides specific buying or selling signals. When a MACD line crosses above the signal line, it is considered to be a positive sign and indicates a time to buy, and vice-versa. </div>
<div> </div>
<div>During the initial days of this trading period, there was a fall in MACD line’s rate of decline. As a result, on September 24, 2014, the MACD line crossed above the Signal line indicating a buy signal. Though there has been less volume in the market, the MACD and Signal lines are gradually shaping upwards suggesting positive momentum in recent times. </div>
<div> </div>
<div><strong>Bollinger Bands</strong></div>
<div> </div>
<div><img alt="" src="/userfiles/images/ta4.jpg" style="height:322px; margin-left:10px; margin-right:10px; width:720px" /></div>
<div> </div>
<div>The Bollinger Band is a technical indicator that consists of a moving average (21-day) along with two trading bands above (upper band) and below it (lower band). The bands are an indication of volatility, which is represented by calculating standard deviation. </div>
<div> </div>
<div>Nepse remained below the mid-band at the beginning of this period. However, on September 28, 2014, the index crossed above the mid-band indicating a buy signal. Since then, Nepse has been able to maintain between the mid-band and upper band. The upper and lower bands have narrowed suggesting decreasing volatility in the market.</div>
',
'status' => true,
'publish_date' => '0000-00-00',
'created' => '2014-11-13 00:00:00',
'modified' => '2015-09-07 12:30:01',
'keywords' => '',
'description' => 'After two continuous trading periods of huge declines, Nepse has stabilized in recent times. Compared to the previous period, Nepse made an upward gain of 25.96 points (or 2.88%) closing at 925.85 points. However, ever since it fell below the 50-day moving average, Nepse has not been able to move above the line. The current resistance and support levels stand at 972.17 and 917.58 points. ',
'sortorder' => '966',
'feature_article' => true,
'user_id' => '0',
'image1' => null,
'image2' => null,
'image3' => null,
'image4' => null
),
'MagazineIssue' => array(
'id' => '730',
'image' => 'small_1415598599.jpg',
'sortorder' => '625',
'published' => true,
'created' => '2014-11-09 10:50:18',
'modified' => '2015-08-30 14:05:58',
'title' => 'November 2014',
'publish_date' => '2014-11-01',
'parent_id' => '0',
'homepage' => false,
'user_id' => '0'
),
'MagazineCategory' => array(
'id' => '63',
'title' => 'Stock Taking',
'sortorder' => '516',
'status' => true,
'created' => '0000-00-00 00:00:00',
'homepage' => true,
'modified' => '2013-04-01 00:00:00'
),
'User' => array(
'password' => '*****',
'id' => null,
'user_detail_id' => null,
'group_id' => null,
'username' => null,
'name' => null,
'email' => null,
'address' => null,
'gender' => null,
'access' => null,
'phone' => null,
'access_type' => null,
'activated' => null,
'sortorder' => null,
'published' => null,
'created' => null,
'last_login' => null,
'ip' => null
),
'MagazineArticleComment' => array(),
'MagazineView' => array(
(int) 0 => array(
[maximum depth reached]
)
)
),
'current_user' => null,
'logged_in' => false
)
$magazineArticle = array(
'MagazineArticle' => array(
'id' => '993',
'magazine_issue_id' => '730',
'magazine_category_id' => '63',
'title' => 'Monthly Technical Analysis of Nepse November 2014',
'image' => null,
'short_content' => 'After two continuous trading periods of huge declines, Nepse has stabilized in recent times. Compared to the previous period, Nepse made an upward gain of 25.96 points (or 2.88%) closing at 925.85 points. ',
'content' => '<div><img alt="" src="/userfiles/images/ta(4).jpg" style="height:364px; margin-left:10px; margin-right:10px; width:720px" /></div>
<div> </div>
<div><strong>Market Trend</strong></div>
<div> </div>
<div><img alt="" src="/userfiles/images/ta1(1).JPG" style="height:350px; margin-left:10px; margin-right:10px; width:720px" /></div>
<div> </div>
<div>After two continuous trading periods of huge declines, Nepse has stabilized in recent times. Compared to the previous period, Nepse made an upward gain of 25.96 points (or 2.88%) closing at 925.85 points. However, ever since it fell below the 50-day moving average, Nepse has not been able to move above the line. The current resistance and support levels stand at 972.17 and 917.58 points. This trading period, the secondary market has witnessed a huge drop in volume of a mere NPR 22.73 crores. The same figure for the last period was NPR 45.46 crores, while it was NPR NPR 52.92 crores prior to that. This decreasing trend in volume has been a significant factor towards the secondary market’s inability to gain footing in the positive direction. The market is in need of increasing volume trend thatcan help it move past the 50-day moving average. </div>
<div> </div>
<div><strong>RSI </strong></div>
<div> </div>
<div><img alt="" src="/userfiles/images/ta2.JPG" style="height:170px; margin-left:10px; margin-right:10px; width:720px" /></div>
<div> </div>
<div>Relative Strength Indicator is a form of leading indicator that is believed to be most effective during periods of sideways movement. Such indicators may create numerous buy and sell signals that are useful when the market is not clearly trending upwards or downwards. </div>
<div> </div>
<div>Since the previous period, the RSI has maintained above the oversold zone. The highest level reached during this period was 51.42, which suggest that there has not been enough buying pressure in the market to push it higher. By the end of the trading period, the RSI stood just below the centerline at 49.42 level. </div>
<div> </div>
<div><strong>MACD </strong></div>
<div> </div>
<div><img alt="" src="/userfiles/images/ta3.JPG" style="height:226px; margin-left:10px; margin-right:10px; width:720px" /></div>
<div> </div>
<div>The MACD is a momentum oscillator formed by using two different types of moving averages, which provides specific buying or selling signals. When a MACD line crosses above the signal line, it is considered to be a positive sign and indicates a time to buy, and vice-versa. </div>
<div> </div>
<div>During the initial days of this trading period, there was a fall in MACD line’s rate of decline. As a result, on September 24, 2014, the MACD line crossed above the Signal line indicating a buy signal. Though there has been less volume in the market, the MACD and Signal lines are gradually shaping upwards suggesting positive momentum in recent times. </div>
<div> </div>
<div><strong>Bollinger Bands</strong></div>
<div> </div>
<div><img alt="" src="/userfiles/images/ta4.jpg" style="height:322px; margin-left:10px; margin-right:10px; width:720px" /></div>
<div> </div>
<div>The Bollinger Band is a technical indicator that consists of a moving average (21-day) along with two trading bands above (upper band) and below it (lower band). The bands are an indication of volatility, which is represented by calculating standard deviation. </div>
<div> </div>
<div>Nepse remained below the mid-band at the beginning of this period. However, on September 28, 2014, the index crossed above the mid-band indicating a buy signal. Since then, Nepse has been able to maintain between the mid-band and upper band. The upper and lower bands have narrowed suggesting decreasing volatility in the market.</div>
',
'status' => true,
'publish_date' => '0000-00-00',
'created' => '2014-11-13 00:00:00',
'modified' => '2015-09-07 12:30:01',
'keywords' => '',
'description' => 'After two continuous trading periods of huge declines, Nepse has stabilized in recent times. Compared to the previous period, Nepse made an upward gain of 25.96 points (or 2.88%) closing at 925.85 points. However, ever since it fell below the 50-day moving average, Nepse has not been able to move above the line. The current resistance and support levels stand at 972.17 and 917.58 points. ',
'sortorder' => '966',
'feature_article' => true,
'user_id' => '0',
'image1' => null,
'image2' => null,
'image3' => null,
'image4' => null
),
'MagazineIssue' => array(
'id' => '730',
'image' => 'small_1415598599.jpg',
'sortorder' => '625',
'published' => true,
'created' => '2014-11-09 10:50:18',
'modified' => '2015-08-30 14:05:58',
'title' => 'November 2014',
'publish_date' => '2014-11-01',
'parent_id' => '0',
'homepage' => false,
'user_id' => '0'
),
'MagazineCategory' => array(
'id' => '63',
'title' => 'Stock Taking',
'sortorder' => '516',
'status' => true,
'created' => '0000-00-00 00:00:00',
'homepage' => true,
'modified' => '2013-04-01 00:00:00'
),
'User' => array(
'password' => '*****',
'id' => null,
'user_detail_id' => null,
'group_id' => null,
'username' => null,
'name' => null,
'email' => null,
'address' => null,
'gender' => null,
'access' => null,
'phone' => null,
'access_type' => null,
'activated' => null,
'sortorder' => null,
'published' => null,
'created' => null,
'last_login' => null,
'ip' => null
),
'MagazineArticleComment' => array(),
'MagazineView' => array(
(int) 0 => array(
'magazine_article_id' => '993',
'hit' => '3857'
)
)
)
$current_user = null
$logged_in = false
$user = null
$groupId = null
$user_id = null
include - APP/View/MagazineArticles/view.ctp, line 62
View::_evaluate() - CORE/Cake/View/View.php, line 971
View::_render() - CORE/Cake/View/View.php, line 933
View::render() - CORE/Cake/View/View.php, line 473
Controller::render() - CORE/Cake/Controller/Controller.php, line 968
Dispatcher::_invoke() - CORE/Cake/Routing/Dispatcher.php, line 200
Dispatcher::dispatch() - CORE/Cake/Routing/Dispatcher.php, line 167
[main] - APP/webroot/index.php, line 117
Notice (8): Undefined index: summary [APP/View/MagazineArticles/view.ctp, line 68]Code Context echo $this->Html->meta(array('property' => 'og:title', 'type' => 'meta', 'content' => $magazineArticle['MagazineArticle']['title']), null, array('inline' => false));?>
<?php
echo $this->Html->meta(array('property' => 'og:description', 'type' => 'meta', 'content' => $magazineArticle['MagazineArticle']['summary']), null, array('inline' => false));?>
$viewFile = '/var/www/html/newbusinessage.com/app/View/MagazineArticles/view.ctp'
$dataForView = array(
'magazineArticle' => array(
'MagazineArticle' => array(
'id' => '993',
'magazine_issue_id' => '730',
'magazine_category_id' => '63',
'title' => 'Monthly Technical Analysis of Nepse November 2014',
'image' => null,
'short_content' => 'After two continuous trading periods of huge declines, Nepse has stabilized in recent times. Compared to the previous period, Nepse made an upward gain of 25.96 points (or 2.88%) closing at 925.85 points. ',
'content' => '<div><img alt="" src="/userfiles/images/ta(4).jpg" style="height:364px; margin-left:10px; margin-right:10px; width:720px" /></div>
<div> </div>
<div><strong>Market Trend</strong></div>
<div> </div>
<div><img alt="" src="/userfiles/images/ta1(1).JPG" style="height:350px; margin-left:10px; margin-right:10px; width:720px" /></div>
<div> </div>
<div>After two continuous trading periods of huge declines, Nepse has stabilized in recent times. Compared to the previous period, Nepse made an upward gain of 25.96 points (or 2.88%) closing at 925.85 points. However, ever since it fell below the 50-day moving average, Nepse has not been able to move above the line. The current resistance and support levels stand at 972.17 and 917.58 points. This trading period, the secondary market has witnessed a huge drop in volume of a mere NPR 22.73 crores. The same figure for the last period was NPR 45.46 crores, while it was NPR NPR 52.92 crores prior to that. This decreasing trend in volume has been a significant factor towards the secondary market’s inability to gain footing in the positive direction. The market is in need of increasing volume trend thatcan help it move past the 50-day moving average. </div>
<div> </div>
<div><strong>RSI </strong></div>
<div> </div>
<div><img alt="" src="/userfiles/images/ta2.JPG" style="height:170px; margin-left:10px; margin-right:10px; width:720px" /></div>
<div> </div>
<div>Relative Strength Indicator is a form of leading indicator that is believed to be most effective during periods of sideways movement. Such indicators may create numerous buy and sell signals that are useful when the market is not clearly trending upwards or downwards. </div>
<div> </div>
<div>Since the previous period, the RSI has maintained above the oversold zone. The highest level reached during this period was 51.42, which suggest that there has not been enough buying pressure in the market to push it higher. By the end of the trading period, the RSI stood just below the centerline at 49.42 level. </div>
<div> </div>
<div><strong>MACD </strong></div>
<div> </div>
<div><img alt="" src="/userfiles/images/ta3.JPG" style="height:226px; margin-left:10px; margin-right:10px; width:720px" /></div>
<div> </div>
<div>The MACD is a momentum oscillator formed by using two different types of moving averages, which provides specific buying or selling signals. When a MACD line crosses above the signal line, it is considered to be a positive sign and indicates a time to buy, and vice-versa. </div>
<div> </div>
<div>During the initial days of this trading period, there was a fall in MACD line’s rate of decline. As a result, on September 24, 2014, the MACD line crossed above the Signal line indicating a buy signal. Though there has been less volume in the market, the MACD and Signal lines are gradually shaping upwards suggesting positive momentum in recent times. </div>
<div> </div>
<div><strong>Bollinger Bands</strong></div>
<div> </div>
<div><img alt="" src="/userfiles/images/ta4.jpg" style="height:322px; margin-left:10px; margin-right:10px; width:720px" /></div>
<div> </div>
<div>The Bollinger Band is a technical indicator that consists of a moving average (21-day) along with two trading bands above (upper band) and below it (lower band). The bands are an indication of volatility, which is represented by calculating standard deviation. </div>
<div> </div>
<div>Nepse remained below the mid-band at the beginning of this period. However, on September 28, 2014, the index crossed above the mid-band indicating a buy signal. Since then, Nepse has been able to maintain between the mid-band and upper band. The upper and lower bands have narrowed suggesting decreasing volatility in the market.</div>
',
'status' => true,
'publish_date' => '0000-00-00',
'created' => '2014-11-13 00:00:00',
'modified' => '2015-09-07 12:30:01',
'keywords' => '',
'description' => 'After two continuous trading periods of huge declines, Nepse has stabilized in recent times. Compared to the previous period, Nepse made an upward gain of 25.96 points (or 2.88%) closing at 925.85 points. However, ever since it fell below the 50-day moving average, Nepse has not been able to move above the line. The current resistance and support levels stand at 972.17 and 917.58 points. ',
'sortorder' => '966',
'feature_article' => true,
'user_id' => '0',
'image1' => null,
'image2' => null,
'image3' => null,
'image4' => null
),
'MagazineIssue' => array(
'id' => '730',
'image' => 'small_1415598599.jpg',
'sortorder' => '625',
'published' => true,
'created' => '2014-11-09 10:50:18',
'modified' => '2015-08-30 14:05:58',
'title' => 'November 2014',
'publish_date' => '2014-11-01',
'parent_id' => '0',
'homepage' => false,
'user_id' => '0'
),
'MagazineCategory' => array(
'id' => '63',
'title' => 'Stock Taking',
'sortorder' => '516',
'status' => true,
'created' => '0000-00-00 00:00:00',
'homepage' => true,
'modified' => '2013-04-01 00:00:00'
),
'User' => array(
'password' => '*****',
'id' => null,
'user_detail_id' => null,
'group_id' => null,
'username' => null,
'name' => null,
'email' => null,
'address' => null,
'gender' => null,
'access' => null,
'phone' => null,
'access_type' => null,
'activated' => null,
'sortorder' => null,
'published' => null,
'created' => null,
'last_login' => null,
'ip' => null
),
'MagazineArticleComment' => array(),
'MagazineView' => array(
(int) 0 => array(
[maximum depth reached]
)
)
),
'current_user' => null,
'logged_in' => false
)
$magazineArticle = array(
'MagazineArticle' => array(
'id' => '993',
'magazine_issue_id' => '730',
'magazine_category_id' => '63',
'title' => 'Monthly Technical Analysis of Nepse November 2014',
'image' => null,
'short_content' => 'After two continuous trading periods of huge declines, Nepse has stabilized in recent times. Compared to the previous period, Nepse made an upward gain of 25.96 points (or 2.88%) closing at 925.85 points. ',
'content' => '<div><img alt="" src="/userfiles/images/ta(4).jpg" style="height:364px; margin-left:10px; margin-right:10px; width:720px" /></div>
<div> </div>
<div><strong>Market Trend</strong></div>
<div> </div>
<div><img alt="" src="/userfiles/images/ta1(1).JPG" style="height:350px; margin-left:10px; margin-right:10px; width:720px" /></div>
<div> </div>
<div>After two continuous trading periods of huge declines, Nepse has stabilized in recent times. Compared to the previous period, Nepse made an upward gain of 25.96 points (or 2.88%) closing at 925.85 points. However, ever since it fell below the 50-day moving average, Nepse has not been able to move above the line. The current resistance and support levels stand at 972.17 and 917.58 points. This trading period, the secondary market has witnessed a huge drop in volume of a mere NPR 22.73 crores. The same figure for the last period was NPR 45.46 crores, while it was NPR NPR 52.92 crores prior to that. This decreasing trend in volume has been a significant factor towards the secondary market’s inability to gain footing in the positive direction. The market is in need of increasing volume trend thatcan help it move past the 50-day moving average. </div>
<div> </div>
<div><strong>RSI </strong></div>
<div> </div>
<div><img alt="" src="/userfiles/images/ta2.JPG" style="height:170px; margin-left:10px; margin-right:10px; width:720px" /></div>
<div> </div>
<div>Relative Strength Indicator is a form of leading indicator that is believed to be most effective during periods of sideways movement. Such indicators may create numerous buy and sell signals that are useful when the market is not clearly trending upwards or downwards. </div>
<div> </div>
<div>Since the previous period, the RSI has maintained above the oversold zone. The highest level reached during this period was 51.42, which suggest that there has not been enough buying pressure in the market to push it higher. By the end of the trading period, the RSI stood just below the centerline at 49.42 level. </div>
<div> </div>
<div><strong>MACD </strong></div>
<div> </div>
<div><img alt="" src="/userfiles/images/ta3.JPG" style="height:226px; margin-left:10px; margin-right:10px; width:720px" /></div>
<div> </div>
<div>The MACD is a momentum oscillator formed by using two different types of moving averages, which provides specific buying or selling signals. When a MACD line crosses above the signal line, it is considered to be a positive sign and indicates a time to buy, and vice-versa. </div>
<div> </div>
<div>During the initial days of this trading period, there was a fall in MACD line’s rate of decline. As a result, on September 24, 2014, the MACD line crossed above the Signal line indicating a buy signal. Though there has been less volume in the market, the MACD and Signal lines are gradually shaping upwards suggesting positive momentum in recent times. </div>
<div> </div>
<div><strong>Bollinger Bands</strong></div>
<div> </div>
<div><img alt="" src="/userfiles/images/ta4.jpg" style="height:322px; margin-left:10px; margin-right:10px; width:720px" /></div>
<div> </div>
<div>The Bollinger Band is a technical indicator that consists of a moving average (21-day) along with two trading bands above (upper band) and below it (lower band). The bands are an indication of volatility, which is represented by calculating standard deviation. </div>
<div> </div>
<div>Nepse remained below the mid-band at the beginning of this period. However, on September 28, 2014, the index crossed above the mid-band indicating a buy signal. Since then, Nepse has been able to maintain between the mid-band and upper band. The upper and lower bands have narrowed suggesting decreasing volatility in the market.</div>
',
'status' => true,
'publish_date' => '0000-00-00',
'created' => '2014-11-13 00:00:00',
'modified' => '2015-09-07 12:30:01',
'keywords' => '',
'description' => 'After two continuous trading periods of huge declines, Nepse has stabilized in recent times. Compared to the previous period, Nepse made an upward gain of 25.96 points (or 2.88%) closing at 925.85 points. However, ever since it fell below the 50-day moving average, Nepse has not been able to move above the line. The current resistance and support levels stand at 972.17 and 917.58 points. ',
'sortorder' => '966',
'feature_article' => true,
'user_id' => '0',
'image1' => null,
'image2' => null,
'image3' => null,
'image4' => null
),
'MagazineIssue' => array(
'id' => '730',
'image' => 'small_1415598599.jpg',
'sortorder' => '625',
'published' => true,
'created' => '2014-11-09 10:50:18',
'modified' => '2015-08-30 14:05:58',
'title' => 'November 2014',
'publish_date' => '2014-11-01',
'parent_id' => '0',
'homepage' => false,
'user_id' => '0'
),
'MagazineCategory' => array(
'id' => '63',
'title' => 'Stock Taking',
'sortorder' => '516',
'status' => true,
'created' => '0000-00-00 00:00:00',
'homepage' => true,
'modified' => '2013-04-01 00:00:00'
),
'User' => array(
'password' => '*****',
'id' => null,
'user_detail_id' => null,
'group_id' => null,
'username' => null,
'name' => null,
'email' => null,
'address' => null,
'gender' => null,
'access' => null,
'phone' => null,
'access_type' => null,
'activated' => null,
'sortorder' => null,
'published' => null,
'created' => null,
'last_login' => null,
'ip' => null
),
'MagazineArticleComment' => array(),
'MagazineView' => array(
(int) 0 => array(
'magazine_article_id' => '993',
'hit' => '3857'
)
)
)
$current_user = null
$logged_in = false
$user = null
$groupId = null
$user_id = null
include - APP/View/MagazineArticles/view.ctp, line 68
View::_evaluate() - CORE/Cake/View/View.php, line 971
View::_render() - CORE/Cake/View/View.php, line 933
View::render() - CORE/Cake/View/View.php, line 473
Controller::render() - CORE/Cake/Controller/Controller.php, line 968
Dispatcher::_invoke() - CORE/Cake/Routing/Dispatcher.php, line 200
Dispatcher::dispatch() - CORE/Cake/Routing/Dispatcher.php, line 167
[main] - APP/webroot/index.php, line 117
Monthly Technical Analysis of Nepse November 2014
Market Trend
After two continuous trading periods of huge declines, Nepse has stabilized in recent times. Compared to the previous period, Nepse made an upward gain of 25.96 points (or 2.88%) closing at 925.85 points. However, ever since it fell below the 50-day moving average, Nepse has not been able to move above the line. The current resistance and support levels stand at 972.17 and 917.58 points. This trading period, the secondary market has witnessed a huge drop in volume of a mere NPR 22.73 crores. The same figure for the last period was NPR 45.46 crores, while it was NPR NPR 52.92 crores prior to that. This decreasing trend in volume has been a significant factor towards the secondary market’s inability to gain footing in the positive direction. The market is in need of increasing volume trend thatcan help it move past the 50-day moving average.
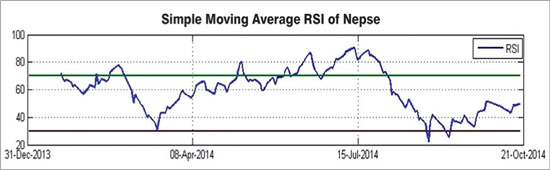
RSI
Relative Strength Indicator is a form of leading indicator that is believed to be most effective during periods of sideways movement. Such indicators may create numerous buy and sell signals that are useful when the market is not clearly trending upwards or downwards.
Since the previous period, the RSI has maintained above the oversold zone. The highest level reached during this period was 51.42, which suggest that there has not been enough buying pressure in the market to push it higher. By the end of the trading period, the RSI stood just below the centerline at 49.42 level.
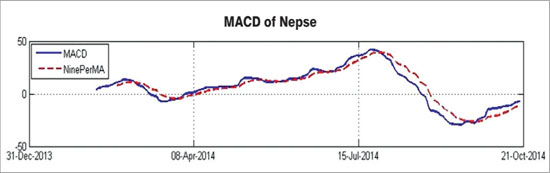
MACD
The MACD is a momentum oscillator formed by using two different types of moving averages, which provides specific buying or selling signals. When a MACD line crosses above the signal line, it is considered to be a positive sign and indicates a time to buy, and vice-versa.
During the initial days of this trading period, there was a fall in MACD line’s rate of decline. As a result, on September 24, 2014, the MACD line crossed above the Signal line indicating a buy signal. Though there has been less volume in the market, the MACD and Signal lines are gradually shaping upwards suggesting positive momentum in recent times.
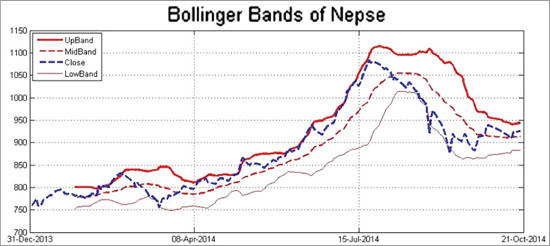
Bollinger Bands
The Bollinger Band is a technical indicator that consists of a moving average (21-day) along with two trading bands above (upper band) and below it (lower band). The bands are an indication of volatility, which is represented by calculating standard deviation.
Nepse remained below the mid-band at the beginning of this period. However, on September 28, 2014, the index crossed above the mid-band indicating a buy signal. Since then, Nepse has been able to maintain between the mid-band and upper band. The upper and lower bands have narrowed suggesting decreasing volatility in the market.

.jpg)
.JPG)