Notice (8): Trying to access array offset on value of type null [APP/View/MagazineArticles/view.ctp, line 54]Code Context $user = $this->Session->read('Auth.User');
//find the group of logged user
$groupId = $user['Group']['id'];
$viewFile = '/var/www/html/newbusinessage.com/app/View/MagazineArticles/view.ctp'
$dataForView = array(
'magazineArticle' => array(
'MagazineArticle' => array(
'id' => '1801',
'magazine_issue_id' => '974',
'magazine_category_id' => '63',
'title' => 'Monthly Technical Analysis of Nepse (26 April to 24 May 2017)',
'image' => null,
'short_content' => 'The benchmark index declined from 1670.3 to 1629.58 in the course of last month. Its new support and resistance level stands at 1612 and 1780 level respectively. With no new bullish trigger, the index will likely test the new support level',
'content' => '<p style="text-align:justify"><span style="font-size:20px"><strong>Waiting for a Bullish Trigger</strong></span></p>
<p style="text-align:center"><span style="font-size:20px"><strong><img alt="" src="/userfiles/images/Clipboard29%281%29.jpg" style="height:479px; width:800px" /></strong></span></p>
<p style="text-align:center"><span style="font-size:20px"><strong><img alt="" src="/userfiles/images/st%2817%29.jpg" style="height:432px; width:800px" /></strong></span></p>
<p style="text-align:justify"><span style="font-size:16px"><strong>Trend Analysis</strong></span><br />
The benchmark index fell by 42.8 points (or down -2.55%) to close at 1629.58 in the course of last month. Nepse continues to hover above the 50-day and 200-day moving average. However, the index and the moving averages have converged and are close to each other, where the 200-day MA continues to act as a support level to the index. This support level will be tested in the coming days as the market did not show much enthusiasm after the completion of the first local level election. The average volume turnover decreased significantly to NPR 75.21 crores from NPR 152.41 crores the month prior. </p>
<p style="text-align:justify"><span style="font-size:16px"><strong>Resistance and Support</strong></span></p>
<p style="text-align:center"><span style="font-size:16px"><strong><img alt="" src="/userfiles/images/sr.jpg" style="height:354px; width:700px" /></strong></span></p>
<p style="text-align:justify">The benchmark index declined from 1670.3 to 1629.58 in the course of last month. Its new support and resistance level stands at 1612 and 1780 level respectively. With no new bullish trigger, the index will likely test the new support level, and hover around the 1600’s level. </p>
<p style="text-align:justify"><span style="font-size:18px"><strong>Nepse Trend Indicator</strong></span></p>
<p style="text-align:justify"><span style="font-size:16px"><strong>a. MACD</strong></span></p>
<p style="text-align:justify">The MACD is a momentum oscillator formed by using two different types of moving averages, which provides specific buying or selling signals. When a MACD line crosses above the signal line, it is considered to be a positive sign and indicates a time to buy, and vice-versa. </p>
<p style="text-align:justify">The MACD and the signal line, at the beginning of last month, stood at 53.41 and 62.65 respectively. In the course of the month, both macd and the signal line declined by 46.92 and 47.01 points to close at 6.49 and 15.64 respectively. The macd indicator moving below the signal line shows presence of bearish momentum in the market. If the macd moves into the negative territory, it will further support this bearish sentiment.</p>
<p style="text-align:center"><img alt="" src="/userfiles/images/Clipboard32%281%29.jpg" style="height:151px; width:800px" /></p>
<p style="text-align:justify"><span style="font-size:16px"><strong>b. RSI</strong></span><br />
RSI is a form of leading indicator that is believed to be most effective during periods of sideways movement. Such indicators may create numerous buy and sell signals that are useful when the market is not clearly trending upwards or downwards. </p>
<p style="text-align:justify">The RSI, at the beginning of last month, stood at 62.58 level. Towards the end of the month, it decreased by 12.81 points to close at 49.77 level. This decrease in RSI level shows that the market is moving away from the overbought zone.</p>
<p style="text-align:center"><img alt="" src="/userfiles/images/Clipboard33%281%29.jpg" style="height:144px; width:800px" /></p>
<p style="text-align:justify"><span style="font-size:16px"><strong>c. Bollinger Bands</strong></span><br />
The Bollinger Band is a technical indicator that consists of a moving average (21-day) along with two trading bands above (upper band) and below it (lower band). The bands are an indication of volatility, which are represented by calculating standard deviation. </p>
<p style="text-align:justify">The benchmark index moved away from the middle bollinger band and towards the lower band last month, indicating an increase in selling pressure in the market. The distance between the upper and lower bands has converged significantly, indicating a decrease in market volatility.</p>
<p style="text-align:center"><img alt="" src="/userfiles/images/Clipboard34%281%29.jpg" style="height:367px; width:800px" /></p>
<p style="text-align:justify"><span style="font-size:18px"><strong>Overview</strong></span><br />
The benchmark index lost 42.8 points (or down-2.55%) to close at 1629.58 last month. Completion of the first level local elections did little to spur positive market sentiment. The index continues to hover above the 50-day and 200-day moving average, where the 200-day MA acts as a support level to the index. The macd, as well as the signal line continue to decline, where the macd is moving below the signal line, giving a bearish signal. The RSI is hovering at 49.77 level, indicating a shift from buying to selling pressure in the market. The bollinger bands show a decrease in the market volatility as the distance between the upper and lower bands has converged. The new support and resistance level stands at 1612 and 1780 respectively. </p>
',
'status' => true,
'publish_date' => '0000-00-00',
'created' => '2017-06-14 08:55:46',
'modified' => '2017-06-14 11:45:02',
'keywords' => '',
'description' => '',
'sortorder' => '1773',
'feature_article' => true,
'user_id' => '11',
'image1' => null,
'image2' => null,
'image3' => null,
'image4' => null
),
'MagazineIssue' => array(
'id' => '974',
'image' => '20170608101518_cover.JPG',
'sortorder' => '1523',
'published' => true,
'created' => '2017-06-08 10:15:18',
'modified' => '2017-06-13 09:04:35',
'title' => 'June 2017',
'publish_date' => '2017-06-08',
'parent_id' => '0',
'homepage' => true,
'user_id' => '11'
),
'MagazineCategory' => array(
'id' => '63',
'title' => 'Stock Taking',
'sortorder' => '516',
'status' => true,
'created' => '0000-00-00 00:00:00',
'homepage' => true,
'modified' => '2013-04-01 00:00:00'
),
'User' => array(
'password' => '*****',
'id' => '11',
'user_detail_id' => '0',
'group_id' => '24',
'username' => 'nsingha@abhiyan.com.np',
'name' => '',
'email' => 'nsingha@abhiyan.com.np',
'address' => '',
'gender' => '',
'access' => '1',
'phone' => '',
'access_type' => '0',
'activated' => false,
'sortorder' => '0',
'published' => '0',
'created' => '2015-04-08 13:22:59',
'last_login' => '2023-04-16 09:29:47',
'ip' => '172.69.77.43'
),
'MagazineArticleComment' => array(),
'MagazineView' => array(
(int) 0 => array(
[maximum depth reached]
)
)
),
'current_user' => null,
'logged_in' => false
)
$magazineArticle = array(
'MagazineArticle' => array(
'id' => '1801',
'magazine_issue_id' => '974',
'magazine_category_id' => '63',
'title' => 'Monthly Technical Analysis of Nepse (26 April to 24 May 2017)',
'image' => null,
'short_content' => 'The benchmark index declined from 1670.3 to 1629.58 in the course of last month. Its new support and resistance level stands at 1612 and 1780 level respectively. With no new bullish trigger, the index will likely test the new support level',
'content' => '<p style="text-align:justify"><span style="font-size:20px"><strong>Waiting for a Bullish Trigger</strong></span></p>
<p style="text-align:center"><span style="font-size:20px"><strong><img alt="" src="/userfiles/images/Clipboard29%281%29.jpg" style="height:479px; width:800px" /></strong></span></p>
<p style="text-align:center"><span style="font-size:20px"><strong><img alt="" src="/userfiles/images/st%2817%29.jpg" style="height:432px; width:800px" /></strong></span></p>
<p style="text-align:justify"><span style="font-size:16px"><strong>Trend Analysis</strong></span><br />
The benchmark index fell by 42.8 points (or down -2.55%) to close at 1629.58 in the course of last month. Nepse continues to hover above the 50-day and 200-day moving average. However, the index and the moving averages have converged and are close to each other, where the 200-day MA continues to act as a support level to the index. This support level will be tested in the coming days as the market did not show much enthusiasm after the completion of the first local level election. The average volume turnover decreased significantly to NPR 75.21 crores from NPR 152.41 crores the month prior. </p>
<p style="text-align:justify"><span style="font-size:16px"><strong>Resistance and Support</strong></span></p>
<p style="text-align:center"><span style="font-size:16px"><strong><img alt="" src="/userfiles/images/sr.jpg" style="height:354px; width:700px" /></strong></span></p>
<p style="text-align:justify">The benchmark index declined from 1670.3 to 1629.58 in the course of last month. Its new support and resistance level stands at 1612 and 1780 level respectively. With no new bullish trigger, the index will likely test the new support level, and hover around the 1600’s level. </p>
<p style="text-align:justify"><span style="font-size:18px"><strong>Nepse Trend Indicator</strong></span></p>
<p style="text-align:justify"><span style="font-size:16px"><strong>a. MACD</strong></span></p>
<p style="text-align:justify">The MACD is a momentum oscillator formed by using two different types of moving averages, which provides specific buying or selling signals. When a MACD line crosses above the signal line, it is considered to be a positive sign and indicates a time to buy, and vice-versa. </p>
<p style="text-align:justify">The MACD and the signal line, at the beginning of last month, stood at 53.41 and 62.65 respectively. In the course of the month, both macd and the signal line declined by 46.92 and 47.01 points to close at 6.49 and 15.64 respectively. The macd indicator moving below the signal line shows presence of bearish momentum in the market. If the macd moves into the negative territory, it will further support this bearish sentiment.</p>
<p style="text-align:center"><img alt="" src="/userfiles/images/Clipboard32%281%29.jpg" style="height:151px; width:800px" /></p>
<p style="text-align:justify"><span style="font-size:16px"><strong>b. RSI</strong></span><br />
RSI is a form of leading indicator that is believed to be most effective during periods of sideways movement. Such indicators may create numerous buy and sell signals that are useful when the market is not clearly trending upwards or downwards. </p>
<p style="text-align:justify">The RSI, at the beginning of last month, stood at 62.58 level. Towards the end of the month, it decreased by 12.81 points to close at 49.77 level. This decrease in RSI level shows that the market is moving away from the overbought zone.</p>
<p style="text-align:center"><img alt="" src="/userfiles/images/Clipboard33%281%29.jpg" style="height:144px; width:800px" /></p>
<p style="text-align:justify"><span style="font-size:16px"><strong>c. Bollinger Bands</strong></span><br />
The Bollinger Band is a technical indicator that consists of a moving average (21-day) along with two trading bands above (upper band) and below it (lower band). The bands are an indication of volatility, which are represented by calculating standard deviation. </p>
<p style="text-align:justify">The benchmark index moved away from the middle bollinger band and towards the lower band last month, indicating an increase in selling pressure in the market. The distance between the upper and lower bands has converged significantly, indicating a decrease in market volatility.</p>
<p style="text-align:center"><img alt="" src="/userfiles/images/Clipboard34%281%29.jpg" style="height:367px; width:800px" /></p>
<p style="text-align:justify"><span style="font-size:18px"><strong>Overview</strong></span><br />
The benchmark index lost 42.8 points (or down-2.55%) to close at 1629.58 last month. Completion of the first level local elections did little to spur positive market sentiment. The index continues to hover above the 50-day and 200-day moving average, where the 200-day MA acts as a support level to the index. The macd, as well as the signal line continue to decline, where the macd is moving below the signal line, giving a bearish signal. The RSI is hovering at 49.77 level, indicating a shift from buying to selling pressure in the market. The bollinger bands show a decrease in the market volatility as the distance between the upper and lower bands has converged. The new support and resistance level stands at 1612 and 1780 respectively. </p>
',
'status' => true,
'publish_date' => '0000-00-00',
'created' => '2017-06-14 08:55:46',
'modified' => '2017-06-14 11:45:02',
'keywords' => '',
'description' => '',
'sortorder' => '1773',
'feature_article' => true,
'user_id' => '11',
'image1' => null,
'image2' => null,
'image3' => null,
'image4' => null
),
'MagazineIssue' => array(
'id' => '974',
'image' => '20170608101518_cover.JPG',
'sortorder' => '1523',
'published' => true,
'created' => '2017-06-08 10:15:18',
'modified' => '2017-06-13 09:04:35',
'title' => 'June 2017',
'publish_date' => '2017-06-08',
'parent_id' => '0',
'homepage' => true,
'user_id' => '11'
),
'MagazineCategory' => array(
'id' => '63',
'title' => 'Stock Taking',
'sortorder' => '516',
'status' => true,
'created' => '0000-00-00 00:00:00',
'homepage' => true,
'modified' => '2013-04-01 00:00:00'
),
'User' => array(
'password' => '*****',
'id' => '11',
'user_detail_id' => '0',
'group_id' => '24',
'username' => 'nsingha@abhiyan.com.np',
'name' => '',
'email' => 'nsingha@abhiyan.com.np',
'address' => '',
'gender' => '',
'access' => '1',
'phone' => '',
'access_type' => '0',
'activated' => false,
'sortorder' => '0',
'published' => '0',
'created' => '2015-04-08 13:22:59',
'last_login' => '2023-04-16 09:29:47',
'ip' => '172.69.77.43'
),
'MagazineArticleComment' => array(),
'MagazineView' => array(
(int) 0 => array(
'magazine_article_id' => '1801',
'hit' => '3805'
)
)
)
$current_user = null
$logged_in = false
$user = null
include - APP/View/MagazineArticles/view.ctp, line 54
View::_evaluate() - CORE/Cake/View/View.php, line 971
View::_render() - CORE/Cake/View/View.php, line 933
View::render() - CORE/Cake/View/View.php, line 473
Controller::render() - CORE/Cake/Controller/Controller.php, line 968
Dispatcher::_invoke() - CORE/Cake/Routing/Dispatcher.php, line 200
Dispatcher::dispatch() - CORE/Cake/Routing/Dispatcher.php, line 167
[main] - APP/webroot/index.php, line 117
Notice (8): Trying to access array offset on value of type null [APP/View/MagazineArticles/view.ctp, line 55]Code Context //find the group of logged user
$groupId = $user['Group']['id'];
$user_id=$user["id"];
$viewFile = '/var/www/html/newbusinessage.com/app/View/MagazineArticles/view.ctp'
$dataForView = array(
'magazineArticle' => array(
'MagazineArticle' => array(
'id' => '1801',
'magazine_issue_id' => '974',
'magazine_category_id' => '63',
'title' => 'Monthly Technical Analysis of Nepse (26 April to 24 May 2017)',
'image' => null,
'short_content' => 'The benchmark index declined from 1670.3 to 1629.58 in the course of last month. Its new support and resistance level stands at 1612 and 1780 level respectively. With no new bullish trigger, the index will likely test the new support level',
'content' => '<p style="text-align:justify"><span style="font-size:20px"><strong>Waiting for a Bullish Trigger</strong></span></p>
<p style="text-align:center"><span style="font-size:20px"><strong><img alt="" src="/userfiles/images/Clipboard29%281%29.jpg" style="height:479px; width:800px" /></strong></span></p>
<p style="text-align:center"><span style="font-size:20px"><strong><img alt="" src="/userfiles/images/st%2817%29.jpg" style="height:432px; width:800px" /></strong></span></p>
<p style="text-align:justify"><span style="font-size:16px"><strong>Trend Analysis</strong></span><br />
The benchmark index fell by 42.8 points (or down -2.55%) to close at 1629.58 in the course of last month. Nepse continues to hover above the 50-day and 200-day moving average. However, the index and the moving averages have converged and are close to each other, where the 200-day MA continues to act as a support level to the index. This support level will be tested in the coming days as the market did not show much enthusiasm after the completion of the first local level election. The average volume turnover decreased significantly to NPR 75.21 crores from NPR 152.41 crores the month prior. </p>
<p style="text-align:justify"><span style="font-size:16px"><strong>Resistance and Support</strong></span></p>
<p style="text-align:center"><span style="font-size:16px"><strong><img alt="" src="/userfiles/images/sr.jpg" style="height:354px; width:700px" /></strong></span></p>
<p style="text-align:justify">The benchmark index declined from 1670.3 to 1629.58 in the course of last month. Its new support and resistance level stands at 1612 and 1780 level respectively. With no new bullish trigger, the index will likely test the new support level, and hover around the 1600’s level. </p>
<p style="text-align:justify"><span style="font-size:18px"><strong>Nepse Trend Indicator</strong></span></p>
<p style="text-align:justify"><span style="font-size:16px"><strong>a. MACD</strong></span></p>
<p style="text-align:justify">The MACD is a momentum oscillator formed by using two different types of moving averages, which provides specific buying or selling signals. When a MACD line crosses above the signal line, it is considered to be a positive sign and indicates a time to buy, and vice-versa. </p>
<p style="text-align:justify">The MACD and the signal line, at the beginning of last month, stood at 53.41 and 62.65 respectively. In the course of the month, both macd and the signal line declined by 46.92 and 47.01 points to close at 6.49 and 15.64 respectively. The macd indicator moving below the signal line shows presence of bearish momentum in the market. If the macd moves into the negative territory, it will further support this bearish sentiment.</p>
<p style="text-align:center"><img alt="" src="/userfiles/images/Clipboard32%281%29.jpg" style="height:151px; width:800px" /></p>
<p style="text-align:justify"><span style="font-size:16px"><strong>b. RSI</strong></span><br />
RSI is a form of leading indicator that is believed to be most effective during periods of sideways movement. Such indicators may create numerous buy and sell signals that are useful when the market is not clearly trending upwards or downwards. </p>
<p style="text-align:justify">The RSI, at the beginning of last month, stood at 62.58 level. Towards the end of the month, it decreased by 12.81 points to close at 49.77 level. This decrease in RSI level shows that the market is moving away from the overbought zone.</p>
<p style="text-align:center"><img alt="" src="/userfiles/images/Clipboard33%281%29.jpg" style="height:144px; width:800px" /></p>
<p style="text-align:justify"><span style="font-size:16px"><strong>c. Bollinger Bands</strong></span><br />
The Bollinger Band is a technical indicator that consists of a moving average (21-day) along with two trading bands above (upper band) and below it (lower band). The bands are an indication of volatility, which are represented by calculating standard deviation. </p>
<p style="text-align:justify">The benchmark index moved away from the middle bollinger band and towards the lower band last month, indicating an increase in selling pressure in the market. The distance between the upper and lower bands has converged significantly, indicating a decrease in market volatility.</p>
<p style="text-align:center"><img alt="" src="/userfiles/images/Clipboard34%281%29.jpg" style="height:367px; width:800px" /></p>
<p style="text-align:justify"><span style="font-size:18px"><strong>Overview</strong></span><br />
The benchmark index lost 42.8 points (or down-2.55%) to close at 1629.58 last month. Completion of the first level local elections did little to spur positive market sentiment. The index continues to hover above the 50-day and 200-day moving average, where the 200-day MA acts as a support level to the index. The macd, as well as the signal line continue to decline, where the macd is moving below the signal line, giving a bearish signal. The RSI is hovering at 49.77 level, indicating a shift from buying to selling pressure in the market. The bollinger bands show a decrease in the market volatility as the distance between the upper and lower bands has converged. The new support and resistance level stands at 1612 and 1780 respectively. </p>
',
'status' => true,
'publish_date' => '0000-00-00',
'created' => '2017-06-14 08:55:46',
'modified' => '2017-06-14 11:45:02',
'keywords' => '',
'description' => '',
'sortorder' => '1773',
'feature_article' => true,
'user_id' => '11',
'image1' => null,
'image2' => null,
'image3' => null,
'image4' => null
),
'MagazineIssue' => array(
'id' => '974',
'image' => '20170608101518_cover.JPG',
'sortorder' => '1523',
'published' => true,
'created' => '2017-06-08 10:15:18',
'modified' => '2017-06-13 09:04:35',
'title' => 'June 2017',
'publish_date' => '2017-06-08',
'parent_id' => '0',
'homepage' => true,
'user_id' => '11'
),
'MagazineCategory' => array(
'id' => '63',
'title' => 'Stock Taking',
'sortorder' => '516',
'status' => true,
'created' => '0000-00-00 00:00:00',
'homepage' => true,
'modified' => '2013-04-01 00:00:00'
),
'User' => array(
'password' => '*****',
'id' => '11',
'user_detail_id' => '0',
'group_id' => '24',
'username' => 'nsingha@abhiyan.com.np',
'name' => '',
'email' => 'nsingha@abhiyan.com.np',
'address' => '',
'gender' => '',
'access' => '1',
'phone' => '',
'access_type' => '0',
'activated' => false,
'sortorder' => '0',
'published' => '0',
'created' => '2015-04-08 13:22:59',
'last_login' => '2023-04-16 09:29:47',
'ip' => '172.69.77.43'
),
'MagazineArticleComment' => array(),
'MagazineView' => array(
(int) 0 => array(
[maximum depth reached]
)
)
),
'current_user' => null,
'logged_in' => false
)
$magazineArticle = array(
'MagazineArticle' => array(
'id' => '1801',
'magazine_issue_id' => '974',
'magazine_category_id' => '63',
'title' => 'Monthly Technical Analysis of Nepse (26 April to 24 May 2017)',
'image' => null,
'short_content' => 'The benchmark index declined from 1670.3 to 1629.58 in the course of last month. Its new support and resistance level stands at 1612 and 1780 level respectively. With no new bullish trigger, the index will likely test the new support level',
'content' => '<p style="text-align:justify"><span style="font-size:20px"><strong>Waiting for a Bullish Trigger</strong></span></p>
<p style="text-align:center"><span style="font-size:20px"><strong><img alt="" src="/userfiles/images/Clipboard29%281%29.jpg" style="height:479px; width:800px" /></strong></span></p>
<p style="text-align:center"><span style="font-size:20px"><strong><img alt="" src="/userfiles/images/st%2817%29.jpg" style="height:432px; width:800px" /></strong></span></p>
<p style="text-align:justify"><span style="font-size:16px"><strong>Trend Analysis</strong></span><br />
The benchmark index fell by 42.8 points (or down -2.55%) to close at 1629.58 in the course of last month. Nepse continues to hover above the 50-day and 200-day moving average. However, the index and the moving averages have converged and are close to each other, where the 200-day MA continues to act as a support level to the index. This support level will be tested in the coming days as the market did not show much enthusiasm after the completion of the first local level election. The average volume turnover decreased significantly to NPR 75.21 crores from NPR 152.41 crores the month prior. </p>
<p style="text-align:justify"><span style="font-size:16px"><strong>Resistance and Support</strong></span></p>
<p style="text-align:center"><span style="font-size:16px"><strong><img alt="" src="/userfiles/images/sr.jpg" style="height:354px; width:700px" /></strong></span></p>
<p style="text-align:justify">The benchmark index declined from 1670.3 to 1629.58 in the course of last month. Its new support and resistance level stands at 1612 and 1780 level respectively. With no new bullish trigger, the index will likely test the new support level, and hover around the 1600’s level. </p>
<p style="text-align:justify"><span style="font-size:18px"><strong>Nepse Trend Indicator</strong></span></p>
<p style="text-align:justify"><span style="font-size:16px"><strong>a. MACD</strong></span></p>
<p style="text-align:justify">The MACD is a momentum oscillator formed by using two different types of moving averages, which provides specific buying or selling signals. When a MACD line crosses above the signal line, it is considered to be a positive sign and indicates a time to buy, and vice-versa. </p>
<p style="text-align:justify">The MACD and the signal line, at the beginning of last month, stood at 53.41 and 62.65 respectively. In the course of the month, both macd and the signal line declined by 46.92 and 47.01 points to close at 6.49 and 15.64 respectively. The macd indicator moving below the signal line shows presence of bearish momentum in the market. If the macd moves into the negative territory, it will further support this bearish sentiment.</p>
<p style="text-align:center"><img alt="" src="/userfiles/images/Clipboard32%281%29.jpg" style="height:151px; width:800px" /></p>
<p style="text-align:justify"><span style="font-size:16px"><strong>b. RSI</strong></span><br />
RSI is a form of leading indicator that is believed to be most effective during periods of sideways movement. Such indicators may create numerous buy and sell signals that are useful when the market is not clearly trending upwards or downwards. </p>
<p style="text-align:justify">The RSI, at the beginning of last month, stood at 62.58 level. Towards the end of the month, it decreased by 12.81 points to close at 49.77 level. This decrease in RSI level shows that the market is moving away from the overbought zone.</p>
<p style="text-align:center"><img alt="" src="/userfiles/images/Clipboard33%281%29.jpg" style="height:144px; width:800px" /></p>
<p style="text-align:justify"><span style="font-size:16px"><strong>c. Bollinger Bands</strong></span><br />
The Bollinger Band is a technical indicator that consists of a moving average (21-day) along with two trading bands above (upper band) and below it (lower band). The bands are an indication of volatility, which are represented by calculating standard deviation. </p>
<p style="text-align:justify">The benchmark index moved away from the middle bollinger band and towards the lower band last month, indicating an increase in selling pressure in the market. The distance between the upper and lower bands has converged significantly, indicating a decrease in market volatility.</p>
<p style="text-align:center"><img alt="" src="/userfiles/images/Clipboard34%281%29.jpg" style="height:367px; width:800px" /></p>
<p style="text-align:justify"><span style="font-size:18px"><strong>Overview</strong></span><br />
The benchmark index lost 42.8 points (or down-2.55%) to close at 1629.58 last month. Completion of the first level local elections did little to spur positive market sentiment. The index continues to hover above the 50-day and 200-day moving average, where the 200-day MA acts as a support level to the index. The macd, as well as the signal line continue to decline, where the macd is moving below the signal line, giving a bearish signal. The RSI is hovering at 49.77 level, indicating a shift from buying to selling pressure in the market. The bollinger bands show a decrease in the market volatility as the distance between the upper and lower bands has converged. The new support and resistance level stands at 1612 and 1780 respectively. </p>
',
'status' => true,
'publish_date' => '0000-00-00',
'created' => '2017-06-14 08:55:46',
'modified' => '2017-06-14 11:45:02',
'keywords' => '',
'description' => '',
'sortorder' => '1773',
'feature_article' => true,
'user_id' => '11',
'image1' => null,
'image2' => null,
'image3' => null,
'image4' => null
),
'MagazineIssue' => array(
'id' => '974',
'image' => '20170608101518_cover.JPG',
'sortorder' => '1523',
'published' => true,
'created' => '2017-06-08 10:15:18',
'modified' => '2017-06-13 09:04:35',
'title' => 'June 2017',
'publish_date' => '2017-06-08',
'parent_id' => '0',
'homepage' => true,
'user_id' => '11'
),
'MagazineCategory' => array(
'id' => '63',
'title' => 'Stock Taking',
'sortorder' => '516',
'status' => true,
'created' => '0000-00-00 00:00:00',
'homepage' => true,
'modified' => '2013-04-01 00:00:00'
),
'User' => array(
'password' => '*****',
'id' => '11',
'user_detail_id' => '0',
'group_id' => '24',
'username' => 'nsingha@abhiyan.com.np',
'name' => '',
'email' => 'nsingha@abhiyan.com.np',
'address' => '',
'gender' => '',
'access' => '1',
'phone' => '',
'access_type' => '0',
'activated' => false,
'sortorder' => '0',
'published' => '0',
'created' => '2015-04-08 13:22:59',
'last_login' => '2023-04-16 09:29:47',
'ip' => '172.69.77.43'
),
'MagazineArticleComment' => array(),
'MagazineView' => array(
(int) 0 => array(
'magazine_article_id' => '1801',
'hit' => '3805'
)
)
)
$current_user = null
$logged_in = false
$user = null
$groupId = null
include - APP/View/MagazineArticles/view.ctp, line 55
View::_evaluate() - CORE/Cake/View/View.php, line 971
View::_render() - CORE/Cake/View/View.php, line 933
View::render() - CORE/Cake/View/View.php, line 473
Controller::render() - CORE/Cake/Controller/Controller.php, line 968
Dispatcher::_invoke() - CORE/Cake/Routing/Dispatcher.php, line 200
Dispatcher::dispatch() - CORE/Cake/Routing/Dispatcher.php, line 167
[main] - APP/webroot/index.php, line 117
Notice (8): Undefined index: summary [APP/View/MagazineArticles/view.ctp, line 62]Code Context<?php
echo $this->Html->meta(array('name' => 'description', 'type' => 'meta', 'content' => $magazineArticle['MagazineArticle']['summary']), null, array('inline' => false));?>
$viewFile = '/var/www/html/newbusinessage.com/app/View/MagazineArticles/view.ctp'
$dataForView = array(
'magazineArticle' => array(
'MagazineArticle' => array(
'id' => '1801',
'magazine_issue_id' => '974',
'magazine_category_id' => '63',
'title' => 'Monthly Technical Analysis of Nepse (26 April to 24 May 2017)',
'image' => null,
'short_content' => 'The benchmark index declined from 1670.3 to 1629.58 in the course of last month. Its new support and resistance level stands at 1612 and 1780 level respectively. With no new bullish trigger, the index will likely test the new support level',
'content' => '<p style="text-align:justify"><span style="font-size:20px"><strong>Waiting for a Bullish Trigger</strong></span></p>
<p style="text-align:center"><span style="font-size:20px"><strong><img alt="" src="/userfiles/images/Clipboard29%281%29.jpg" style="height:479px; width:800px" /></strong></span></p>
<p style="text-align:center"><span style="font-size:20px"><strong><img alt="" src="/userfiles/images/st%2817%29.jpg" style="height:432px; width:800px" /></strong></span></p>
<p style="text-align:justify"><span style="font-size:16px"><strong>Trend Analysis</strong></span><br />
The benchmark index fell by 42.8 points (or down -2.55%) to close at 1629.58 in the course of last month. Nepse continues to hover above the 50-day and 200-day moving average. However, the index and the moving averages have converged and are close to each other, where the 200-day MA continues to act as a support level to the index. This support level will be tested in the coming days as the market did not show much enthusiasm after the completion of the first local level election. The average volume turnover decreased significantly to NPR 75.21 crores from NPR 152.41 crores the month prior. </p>
<p style="text-align:justify"><span style="font-size:16px"><strong>Resistance and Support</strong></span></p>
<p style="text-align:center"><span style="font-size:16px"><strong><img alt="" src="/userfiles/images/sr.jpg" style="height:354px; width:700px" /></strong></span></p>
<p style="text-align:justify">The benchmark index declined from 1670.3 to 1629.58 in the course of last month. Its new support and resistance level stands at 1612 and 1780 level respectively. With no new bullish trigger, the index will likely test the new support level, and hover around the 1600’s level. </p>
<p style="text-align:justify"><span style="font-size:18px"><strong>Nepse Trend Indicator</strong></span></p>
<p style="text-align:justify"><span style="font-size:16px"><strong>a. MACD</strong></span></p>
<p style="text-align:justify">The MACD is a momentum oscillator formed by using two different types of moving averages, which provides specific buying or selling signals. When a MACD line crosses above the signal line, it is considered to be a positive sign and indicates a time to buy, and vice-versa. </p>
<p style="text-align:justify">The MACD and the signal line, at the beginning of last month, stood at 53.41 and 62.65 respectively. In the course of the month, both macd and the signal line declined by 46.92 and 47.01 points to close at 6.49 and 15.64 respectively. The macd indicator moving below the signal line shows presence of bearish momentum in the market. If the macd moves into the negative territory, it will further support this bearish sentiment.</p>
<p style="text-align:center"><img alt="" src="/userfiles/images/Clipboard32%281%29.jpg" style="height:151px; width:800px" /></p>
<p style="text-align:justify"><span style="font-size:16px"><strong>b. RSI</strong></span><br />
RSI is a form of leading indicator that is believed to be most effective during periods of sideways movement. Such indicators may create numerous buy and sell signals that are useful when the market is not clearly trending upwards or downwards. </p>
<p style="text-align:justify">The RSI, at the beginning of last month, stood at 62.58 level. Towards the end of the month, it decreased by 12.81 points to close at 49.77 level. This decrease in RSI level shows that the market is moving away from the overbought zone.</p>
<p style="text-align:center"><img alt="" src="/userfiles/images/Clipboard33%281%29.jpg" style="height:144px; width:800px" /></p>
<p style="text-align:justify"><span style="font-size:16px"><strong>c. Bollinger Bands</strong></span><br />
The Bollinger Band is a technical indicator that consists of a moving average (21-day) along with two trading bands above (upper band) and below it (lower band). The bands are an indication of volatility, which are represented by calculating standard deviation. </p>
<p style="text-align:justify">The benchmark index moved away from the middle bollinger band and towards the lower band last month, indicating an increase in selling pressure in the market. The distance between the upper and lower bands has converged significantly, indicating a decrease in market volatility.</p>
<p style="text-align:center"><img alt="" src="/userfiles/images/Clipboard34%281%29.jpg" style="height:367px; width:800px" /></p>
<p style="text-align:justify"><span style="font-size:18px"><strong>Overview</strong></span><br />
The benchmark index lost 42.8 points (or down-2.55%) to close at 1629.58 last month. Completion of the first level local elections did little to spur positive market sentiment. The index continues to hover above the 50-day and 200-day moving average, where the 200-day MA acts as a support level to the index. The macd, as well as the signal line continue to decline, where the macd is moving below the signal line, giving a bearish signal. The RSI is hovering at 49.77 level, indicating a shift from buying to selling pressure in the market. The bollinger bands show a decrease in the market volatility as the distance between the upper and lower bands has converged. The new support and resistance level stands at 1612 and 1780 respectively. </p>
',
'status' => true,
'publish_date' => '0000-00-00',
'created' => '2017-06-14 08:55:46',
'modified' => '2017-06-14 11:45:02',
'keywords' => '',
'description' => '',
'sortorder' => '1773',
'feature_article' => true,
'user_id' => '11',
'image1' => null,
'image2' => null,
'image3' => null,
'image4' => null
),
'MagazineIssue' => array(
'id' => '974',
'image' => '20170608101518_cover.JPG',
'sortorder' => '1523',
'published' => true,
'created' => '2017-06-08 10:15:18',
'modified' => '2017-06-13 09:04:35',
'title' => 'June 2017',
'publish_date' => '2017-06-08',
'parent_id' => '0',
'homepage' => true,
'user_id' => '11'
),
'MagazineCategory' => array(
'id' => '63',
'title' => 'Stock Taking',
'sortorder' => '516',
'status' => true,
'created' => '0000-00-00 00:00:00',
'homepage' => true,
'modified' => '2013-04-01 00:00:00'
),
'User' => array(
'password' => '*****',
'id' => '11',
'user_detail_id' => '0',
'group_id' => '24',
'username' => 'nsingha@abhiyan.com.np',
'name' => '',
'email' => 'nsingha@abhiyan.com.np',
'address' => '',
'gender' => '',
'access' => '1',
'phone' => '',
'access_type' => '0',
'activated' => false,
'sortorder' => '0',
'published' => '0',
'created' => '2015-04-08 13:22:59',
'last_login' => '2023-04-16 09:29:47',
'ip' => '172.69.77.43'
),
'MagazineArticleComment' => array(),
'MagazineView' => array(
(int) 0 => array(
[maximum depth reached]
)
)
),
'current_user' => null,
'logged_in' => false
)
$magazineArticle = array(
'MagazineArticle' => array(
'id' => '1801',
'magazine_issue_id' => '974',
'magazine_category_id' => '63',
'title' => 'Monthly Technical Analysis of Nepse (26 April to 24 May 2017)',
'image' => null,
'short_content' => 'The benchmark index declined from 1670.3 to 1629.58 in the course of last month. Its new support and resistance level stands at 1612 and 1780 level respectively. With no new bullish trigger, the index will likely test the new support level',
'content' => '<p style="text-align:justify"><span style="font-size:20px"><strong>Waiting for a Bullish Trigger</strong></span></p>
<p style="text-align:center"><span style="font-size:20px"><strong><img alt="" src="/userfiles/images/Clipboard29%281%29.jpg" style="height:479px; width:800px" /></strong></span></p>
<p style="text-align:center"><span style="font-size:20px"><strong><img alt="" src="/userfiles/images/st%2817%29.jpg" style="height:432px; width:800px" /></strong></span></p>
<p style="text-align:justify"><span style="font-size:16px"><strong>Trend Analysis</strong></span><br />
The benchmark index fell by 42.8 points (or down -2.55%) to close at 1629.58 in the course of last month. Nepse continues to hover above the 50-day and 200-day moving average. However, the index and the moving averages have converged and are close to each other, where the 200-day MA continues to act as a support level to the index. This support level will be tested in the coming days as the market did not show much enthusiasm after the completion of the first local level election. The average volume turnover decreased significantly to NPR 75.21 crores from NPR 152.41 crores the month prior. </p>
<p style="text-align:justify"><span style="font-size:16px"><strong>Resistance and Support</strong></span></p>
<p style="text-align:center"><span style="font-size:16px"><strong><img alt="" src="/userfiles/images/sr.jpg" style="height:354px; width:700px" /></strong></span></p>
<p style="text-align:justify">The benchmark index declined from 1670.3 to 1629.58 in the course of last month. Its new support and resistance level stands at 1612 and 1780 level respectively. With no new bullish trigger, the index will likely test the new support level, and hover around the 1600’s level. </p>
<p style="text-align:justify"><span style="font-size:18px"><strong>Nepse Trend Indicator</strong></span></p>
<p style="text-align:justify"><span style="font-size:16px"><strong>a. MACD</strong></span></p>
<p style="text-align:justify">The MACD is a momentum oscillator formed by using two different types of moving averages, which provides specific buying or selling signals. When a MACD line crosses above the signal line, it is considered to be a positive sign and indicates a time to buy, and vice-versa. </p>
<p style="text-align:justify">The MACD and the signal line, at the beginning of last month, stood at 53.41 and 62.65 respectively. In the course of the month, both macd and the signal line declined by 46.92 and 47.01 points to close at 6.49 and 15.64 respectively. The macd indicator moving below the signal line shows presence of bearish momentum in the market. If the macd moves into the negative territory, it will further support this bearish sentiment.</p>
<p style="text-align:center"><img alt="" src="/userfiles/images/Clipboard32%281%29.jpg" style="height:151px; width:800px" /></p>
<p style="text-align:justify"><span style="font-size:16px"><strong>b. RSI</strong></span><br />
RSI is a form of leading indicator that is believed to be most effective during periods of sideways movement. Such indicators may create numerous buy and sell signals that are useful when the market is not clearly trending upwards or downwards. </p>
<p style="text-align:justify">The RSI, at the beginning of last month, stood at 62.58 level. Towards the end of the month, it decreased by 12.81 points to close at 49.77 level. This decrease in RSI level shows that the market is moving away from the overbought zone.</p>
<p style="text-align:center"><img alt="" src="/userfiles/images/Clipboard33%281%29.jpg" style="height:144px; width:800px" /></p>
<p style="text-align:justify"><span style="font-size:16px"><strong>c. Bollinger Bands</strong></span><br />
The Bollinger Band is a technical indicator that consists of a moving average (21-day) along with two trading bands above (upper band) and below it (lower band). The bands are an indication of volatility, which are represented by calculating standard deviation. </p>
<p style="text-align:justify">The benchmark index moved away from the middle bollinger band and towards the lower band last month, indicating an increase in selling pressure in the market. The distance between the upper and lower bands has converged significantly, indicating a decrease in market volatility.</p>
<p style="text-align:center"><img alt="" src="/userfiles/images/Clipboard34%281%29.jpg" style="height:367px; width:800px" /></p>
<p style="text-align:justify"><span style="font-size:18px"><strong>Overview</strong></span><br />
The benchmark index lost 42.8 points (or down-2.55%) to close at 1629.58 last month. Completion of the first level local elections did little to spur positive market sentiment. The index continues to hover above the 50-day and 200-day moving average, where the 200-day MA acts as a support level to the index. The macd, as well as the signal line continue to decline, where the macd is moving below the signal line, giving a bearish signal. The RSI is hovering at 49.77 level, indicating a shift from buying to selling pressure in the market. The bollinger bands show a decrease in the market volatility as the distance between the upper and lower bands has converged. The new support and resistance level stands at 1612 and 1780 respectively. </p>
',
'status' => true,
'publish_date' => '0000-00-00',
'created' => '2017-06-14 08:55:46',
'modified' => '2017-06-14 11:45:02',
'keywords' => '',
'description' => '',
'sortorder' => '1773',
'feature_article' => true,
'user_id' => '11',
'image1' => null,
'image2' => null,
'image3' => null,
'image4' => null
),
'MagazineIssue' => array(
'id' => '974',
'image' => '20170608101518_cover.JPG',
'sortorder' => '1523',
'published' => true,
'created' => '2017-06-08 10:15:18',
'modified' => '2017-06-13 09:04:35',
'title' => 'June 2017',
'publish_date' => '2017-06-08',
'parent_id' => '0',
'homepage' => true,
'user_id' => '11'
),
'MagazineCategory' => array(
'id' => '63',
'title' => 'Stock Taking',
'sortorder' => '516',
'status' => true,
'created' => '0000-00-00 00:00:00',
'homepage' => true,
'modified' => '2013-04-01 00:00:00'
),
'User' => array(
'password' => '*****',
'id' => '11',
'user_detail_id' => '0',
'group_id' => '24',
'username' => 'nsingha@abhiyan.com.np',
'name' => '',
'email' => 'nsingha@abhiyan.com.np',
'address' => '',
'gender' => '',
'access' => '1',
'phone' => '',
'access_type' => '0',
'activated' => false,
'sortorder' => '0',
'published' => '0',
'created' => '2015-04-08 13:22:59',
'last_login' => '2023-04-16 09:29:47',
'ip' => '172.69.77.43'
),
'MagazineArticleComment' => array(),
'MagazineView' => array(
(int) 0 => array(
'magazine_article_id' => '1801',
'hit' => '3805'
)
)
)
$current_user = null
$logged_in = false
$user = null
$groupId = null
$user_id = null
include - APP/View/MagazineArticles/view.ctp, line 62
View::_evaluate() - CORE/Cake/View/View.php, line 971
View::_render() - CORE/Cake/View/View.php, line 933
View::render() - CORE/Cake/View/View.php, line 473
Controller::render() - CORE/Cake/Controller/Controller.php, line 968
Dispatcher::_invoke() - CORE/Cake/Routing/Dispatcher.php, line 200
Dispatcher::dispatch() - CORE/Cake/Routing/Dispatcher.php, line 167
[main] - APP/webroot/index.php, line 117
Notice (8): Undefined index: summary [APP/View/MagazineArticles/view.ctp, line 68]Code Context echo $this->Html->meta(array('property' => 'og:title', 'type' => 'meta', 'content' => $magazineArticle['MagazineArticle']['title']), null, array('inline' => false));?>
<?php
echo $this->Html->meta(array('property' => 'og:description', 'type' => 'meta', 'content' => $magazineArticle['MagazineArticle']['summary']), null, array('inline' => false));?>
$viewFile = '/var/www/html/newbusinessage.com/app/View/MagazineArticles/view.ctp'
$dataForView = array(
'magazineArticle' => array(
'MagazineArticle' => array(
'id' => '1801',
'magazine_issue_id' => '974',
'magazine_category_id' => '63',
'title' => 'Monthly Technical Analysis of Nepse (26 April to 24 May 2017)',
'image' => null,
'short_content' => 'The benchmark index declined from 1670.3 to 1629.58 in the course of last month. Its new support and resistance level stands at 1612 and 1780 level respectively. With no new bullish trigger, the index will likely test the new support level',
'content' => '<p style="text-align:justify"><span style="font-size:20px"><strong>Waiting for a Bullish Trigger</strong></span></p>
<p style="text-align:center"><span style="font-size:20px"><strong><img alt="" src="/userfiles/images/Clipboard29%281%29.jpg" style="height:479px; width:800px" /></strong></span></p>
<p style="text-align:center"><span style="font-size:20px"><strong><img alt="" src="/userfiles/images/st%2817%29.jpg" style="height:432px; width:800px" /></strong></span></p>
<p style="text-align:justify"><span style="font-size:16px"><strong>Trend Analysis</strong></span><br />
The benchmark index fell by 42.8 points (or down -2.55%) to close at 1629.58 in the course of last month. Nepse continues to hover above the 50-day and 200-day moving average. However, the index and the moving averages have converged and are close to each other, where the 200-day MA continues to act as a support level to the index. This support level will be tested in the coming days as the market did not show much enthusiasm after the completion of the first local level election. The average volume turnover decreased significantly to NPR 75.21 crores from NPR 152.41 crores the month prior. </p>
<p style="text-align:justify"><span style="font-size:16px"><strong>Resistance and Support</strong></span></p>
<p style="text-align:center"><span style="font-size:16px"><strong><img alt="" src="/userfiles/images/sr.jpg" style="height:354px; width:700px" /></strong></span></p>
<p style="text-align:justify">The benchmark index declined from 1670.3 to 1629.58 in the course of last month. Its new support and resistance level stands at 1612 and 1780 level respectively. With no new bullish trigger, the index will likely test the new support level, and hover around the 1600’s level. </p>
<p style="text-align:justify"><span style="font-size:18px"><strong>Nepse Trend Indicator</strong></span></p>
<p style="text-align:justify"><span style="font-size:16px"><strong>a. MACD</strong></span></p>
<p style="text-align:justify">The MACD is a momentum oscillator formed by using two different types of moving averages, which provides specific buying or selling signals. When a MACD line crosses above the signal line, it is considered to be a positive sign and indicates a time to buy, and vice-versa. </p>
<p style="text-align:justify">The MACD and the signal line, at the beginning of last month, stood at 53.41 and 62.65 respectively. In the course of the month, both macd and the signal line declined by 46.92 and 47.01 points to close at 6.49 and 15.64 respectively. The macd indicator moving below the signal line shows presence of bearish momentum in the market. If the macd moves into the negative territory, it will further support this bearish sentiment.</p>
<p style="text-align:center"><img alt="" src="/userfiles/images/Clipboard32%281%29.jpg" style="height:151px; width:800px" /></p>
<p style="text-align:justify"><span style="font-size:16px"><strong>b. RSI</strong></span><br />
RSI is a form of leading indicator that is believed to be most effective during periods of sideways movement. Such indicators may create numerous buy and sell signals that are useful when the market is not clearly trending upwards or downwards. </p>
<p style="text-align:justify">The RSI, at the beginning of last month, stood at 62.58 level. Towards the end of the month, it decreased by 12.81 points to close at 49.77 level. This decrease in RSI level shows that the market is moving away from the overbought zone.</p>
<p style="text-align:center"><img alt="" src="/userfiles/images/Clipboard33%281%29.jpg" style="height:144px; width:800px" /></p>
<p style="text-align:justify"><span style="font-size:16px"><strong>c. Bollinger Bands</strong></span><br />
The Bollinger Band is a technical indicator that consists of a moving average (21-day) along with two trading bands above (upper band) and below it (lower band). The bands are an indication of volatility, which are represented by calculating standard deviation. </p>
<p style="text-align:justify">The benchmark index moved away from the middle bollinger band and towards the lower band last month, indicating an increase in selling pressure in the market. The distance between the upper and lower bands has converged significantly, indicating a decrease in market volatility.</p>
<p style="text-align:center"><img alt="" src="/userfiles/images/Clipboard34%281%29.jpg" style="height:367px; width:800px" /></p>
<p style="text-align:justify"><span style="font-size:18px"><strong>Overview</strong></span><br />
The benchmark index lost 42.8 points (or down-2.55%) to close at 1629.58 last month. Completion of the first level local elections did little to spur positive market sentiment. The index continues to hover above the 50-day and 200-day moving average, where the 200-day MA acts as a support level to the index. The macd, as well as the signal line continue to decline, where the macd is moving below the signal line, giving a bearish signal. The RSI is hovering at 49.77 level, indicating a shift from buying to selling pressure in the market. The bollinger bands show a decrease in the market volatility as the distance between the upper and lower bands has converged. The new support and resistance level stands at 1612 and 1780 respectively. </p>
',
'status' => true,
'publish_date' => '0000-00-00',
'created' => '2017-06-14 08:55:46',
'modified' => '2017-06-14 11:45:02',
'keywords' => '',
'description' => '',
'sortorder' => '1773',
'feature_article' => true,
'user_id' => '11',
'image1' => null,
'image2' => null,
'image3' => null,
'image4' => null
),
'MagazineIssue' => array(
'id' => '974',
'image' => '20170608101518_cover.JPG',
'sortorder' => '1523',
'published' => true,
'created' => '2017-06-08 10:15:18',
'modified' => '2017-06-13 09:04:35',
'title' => 'June 2017',
'publish_date' => '2017-06-08',
'parent_id' => '0',
'homepage' => true,
'user_id' => '11'
),
'MagazineCategory' => array(
'id' => '63',
'title' => 'Stock Taking',
'sortorder' => '516',
'status' => true,
'created' => '0000-00-00 00:00:00',
'homepage' => true,
'modified' => '2013-04-01 00:00:00'
),
'User' => array(
'password' => '*****',
'id' => '11',
'user_detail_id' => '0',
'group_id' => '24',
'username' => 'nsingha@abhiyan.com.np',
'name' => '',
'email' => 'nsingha@abhiyan.com.np',
'address' => '',
'gender' => '',
'access' => '1',
'phone' => '',
'access_type' => '0',
'activated' => false,
'sortorder' => '0',
'published' => '0',
'created' => '2015-04-08 13:22:59',
'last_login' => '2023-04-16 09:29:47',
'ip' => '172.69.77.43'
),
'MagazineArticleComment' => array(),
'MagazineView' => array(
(int) 0 => array(
[maximum depth reached]
)
)
),
'current_user' => null,
'logged_in' => false
)
$magazineArticle = array(
'MagazineArticle' => array(
'id' => '1801',
'magazine_issue_id' => '974',
'magazine_category_id' => '63',
'title' => 'Monthly Technical Analysis of Nepse (26 April to 24 May 2017)',
'image' => null,
'short_content' => 'The benchmark index declined from 1670.3 to 1629.58 in the course of last month. Its new support and resistance level stands at 1612 and 1780 level respectively. With no new bullish trigger, the index will likely test the new support level',
'content' => '<p style="text-align:justify"><span style="font-size:20px"><strong>Waiting for a Bullish Trigger</strong></span></p>
<p style="text-align:center"><span style="font-size:20px"><strong><img alt="" src="/userfiles/images/Clipboard29%281%29.jpg" style="height:479px; width:800px" /></strong></span></p>
<p style="text-align:center"><span style="font-size:20px"><strong><img alt="" src="/userfiles/images/st%2817%29.jpg" style="height:432px; width:800px" /></strong></span></p>
<p style="text-align:justify"><span style="font-size:16px"><strong>Trend Analysis</strong></span><br />
The benchmark index fell by 42.8 points (or down -2.55%) to close at 1629.58 in the course of last month. Nepse continues to hover above the 50-day and 200-day moving average. However, the index and the moving averages have converged and are close to each other, where the 200-day MA continues to act as a support level to the index. This support level will be tested in the coming days as the market did not show much enthusiasm after the completion of the first local level election. The average volume turnover decreased significantly to NPR 75.21 crores from NPR 152.41 crores the month prior. </p>
<p style="text-align:justify"><span style="font-size:16px"><strong>Resistance and Support</strong></span></p>
<p style="text-align:center"><span style="font-size:16px"><strong><img alt="" src="/userfiles/images/sr.jpg" style="height:354px; width:700px" /></strong></span></p>
<p style="text-align:justify">The benchmark index declined from 1670.3 to 1629.58 in the course of last month. Its new support and resistance level stands at 1612 and 1780 level respectively. With no new bullish trigger, the index will likely test the new support level, and hover around the 1600’s level. </p>
<p style="text-align:justify"><span style="font-size:18px"><strong>Nepse Trend Indicator</strong></span></p>
<p style="text-align:justify"><span style="font-size:16px"><strong>a. MACD</strong></span></p>
<p style="text-align:justify">The MACD is a momentum oscillator formed by using two different types of moving averages, which provides specific buying or selling signals. When a MACD line crosses above the signal line, it is considered to be a positive sign and indicates a time to buy, and vice-versa. </p>
<p style="text-align:justify">The MACD and the signal line, at the beginning of last month, stood at 53.41 and 62.65 respectively. In the course of the month, both macd and the signal line declined by 46.92 and 47.01 points to close at 6.49 and 15.64 respectively. The macd indicator moving below the signal line shows presence of bearish momentum in the market. If the macd moves into the negative territory, it will further support this bearish sentiment.</p>
<p style="text-align:center"><img alt="" src="/userfiles/images/Clipboard32%281%29.jpg" style="height:151px; width:800px" /></p>
<p style="text-align:justify"><span style="font-size:16px"><strong>b. RSI</strong></span><br />
RSI is a form of leading indicator that is believed to be most effective during periods of sideways movement. Such indicators may create numerous buy and sell signals that are useful when the market is not clearly trending upwards or downwards. </p>
<p style="text-align:justify">The RSI, at the beginning of last month, stood at 62.58 level. Towards the end of the month, it decreased by 12.81 points to close at 49.77 level. This decrease in RSI level shows that the market is moving away from the overbought zone.</p>
<p style="text-align:center"><img alt="" src="/userfiles/images/Clipboard33%281%29.jpg" style="height:144px; width:800px" /></p>
<p style="text-align:justify"><span style="font-size:16px"><strong>c. Bollinger Bands</strong></span><br />
The Bollinger Band is a technical indicator that consists of a moving average (21-day) along with two trading bands above (upper band) and below it (lower band). The bands are an indication of volatility, which are represented by calculating standard deviation. </p>
<p style="text-align:justify">The benchmark index moved away from the middle bollinger band and towards the lower band last month, indicating an increase in selling pressure in the market. The distance between the upper and lower bands has converged significantly, indicating a decrease in market volatility.</p>
<p style="text-align:center"><img alt="" src="/userfiles/images/Clipboard34%281%29.jpg" style="height:367px; width:800px" /></p>
<p style="text-align:justify"><span style="font-size:18px"><strong>Overview</strong></span><br />
The benchmark index lost 42.8 points (or down-2.55%) to close at 1629.58 last month. Completion of the first level local elections did little to spur positive market sentiment. The index continues to hover above the 50-day and 200-day moving average, where the 200-day MA acts as a support level to the index. The macd, as well as the signal line continue to decline, where the macd is moving below the signal line, giving a bearish signal. The RSI is hovering at 49.77 level, indicating a shift from buying to selling pressure in the market. The bollinger bands show a decrease in the market volatility as the distance between the upper and lower bands has converged. The new support and resistance level stands at 1612 and 1780 respectively. </p>
',
'status' => true,
'publish_date' => '0000-00-00',
'created' => '2017-06-14 08:55:46',
'modified' => '2017-06-14 11:45:02',
'keywords' => '',
'description' => '',
'sortorder' => '1773',
'feature_article' => true,
'user_id' => '11',
'image1' => null,
'image2' => null,
'image3' => null,
'image4' => null
),
'MagazineIssue' => array(
'id' => '974',
'image' => '20170608101518_cover.JPG',
'sortorder' => '1523',
'published' => true,
'created' => '2017-06-08 10:15:18',
'modified' => '2017-06-13 09:04:35',
'title' => 'June 2017',
'publish_date' => '2017-06-08',
'parent_id' => '0',
'homepage' => true,
'user_id' => '11'
),
'MagazineCategory' => array(
'id' => '63',
'title' => 'Stock Taking',
'sortorder' => '516',
'status' => true,
'created' => '0000-00-00 00:00:00',
'homepage' => true,
'modified' => '2013-04-01 00:00:00'
),
'User' => array(
'password' => '*****',
'id' => '11',
'user_detail_id' => '0',
'group_id' => '24',
'username' => 'nsingha@abhiyan.com.np',
'name' => '',
'email' => 'nsingha@abhiyan.com.np',
'address' => '',
'gender' => '',
'access' => '1',
'phone' => '',
'access_type' => '0',
'activated' => false,
'sortorder' => '0',
'published' => '0',
'created' => '2015-04-08 13:22:59',
'last_login' => '2023-04-16 09:29:47',
'ip' => '172.69.77.43'
),
'MagazineArticleComment' => array(),
'MagazineView' => array(
(int) 0 => array(
'magazine_article_id' => '1801',
'hit' => '3805'
)
)
)
$current_user = null
$logged_in = false
$user = null
$groupId = null
$user_id = null
include - APP/View/MagazineArticles/view.ctp, line 68
View::_evaluate() - CORE/Cake/View/View.php, line 971
View::_render() - CORE/Cake/View/View.php, line 933
View::render() - CORE/Cake/View/View.php, line 473
Controller::render() - CORE/Cake/Controller/Controller.php, line 968
Dispatcher::_invoke() - CORE/Cake/Routing/Dispatcher.php, line 200
Dispatcher::dispatch() - CORE/Cake/Routing/Dispatcher.php, line 167
[main] - APP/webroot/index.php, line 117
Monthly Technical Analysis of Nepse (26 April to 24 May 2017)
Waiting for a Bullish Trigger
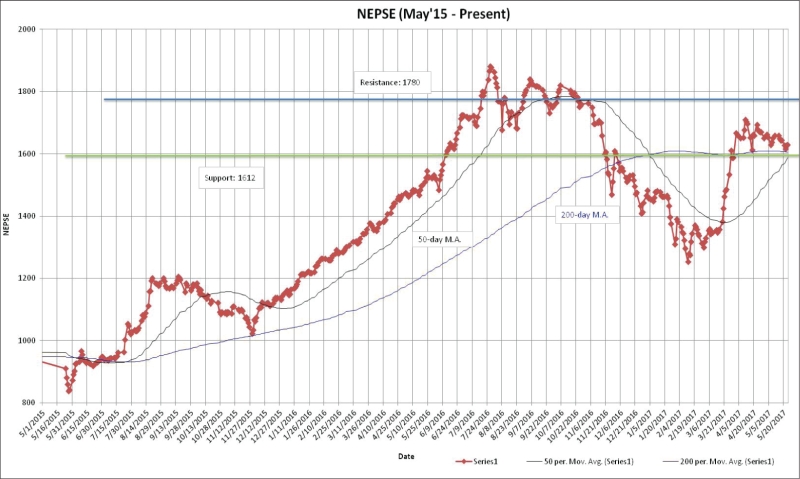
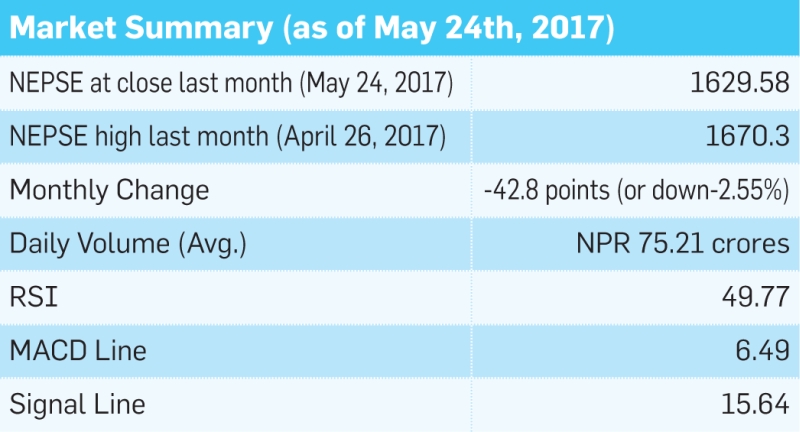
Trend Analysis
The benchmark index fell by 42.8 points (or down -2.55%) to close at 1629.58 in the course of last month. Nepse continues to hover above the 50-day and 200-day moving average. However, the index and the moving averages have converged and are close to each other, where the 200-day MA continues to act as a support level to the index. This support level will be tested in the coming days as the market did not show much enthusiasm after the completion of the first local level election. The average volume turnover decreased significantly to NPR 75.21 crores from NPR 152.41 crores the month prior.
Resistance and Support
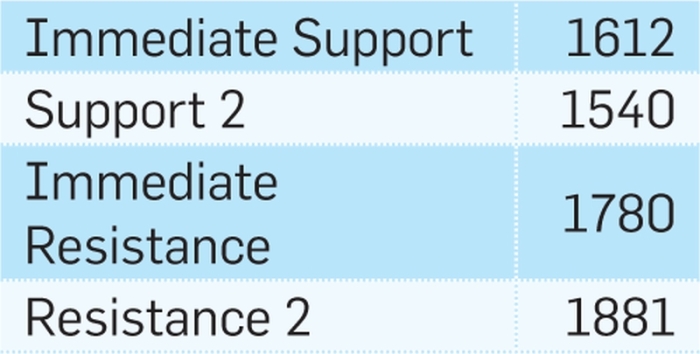
The benchmark index declined from 1670.3 to 1629.58 in the course of last month. Its new support and resistance level stands at 1612 and 1780 level respectively. With no new bullish trigger, the index will likely test the new support level, and hover around the 1600’s level.
Nepse Trend Indicator
a. MACD
The MACD is a momentum oscillator formed by using two different types of moving averages, which provides specific buying or selling signals. When a MACD line crosses above the signal line, it is considered to be a positive sign and indicates a time to buy, and vice-versa.
The MACD and the signal line, at the beginning of last month, stood at 53.41 and 62.65 respectively. In the course of the month, both macd and the signal line declined by 46.92 and 47.01 points to close at 6.49 and 15.64 respectively. The macd indicator moving below the signal line shows presence of bearish momentum in the market. If the macd moves into the negative territory, it will further support this bearish sentiment.
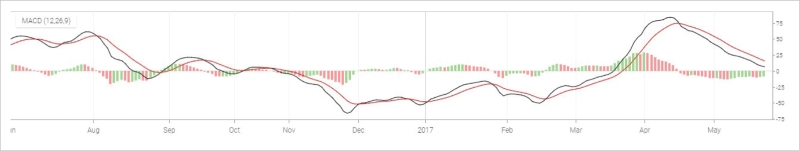
b. RSI
RSI is a form of leading indicator that is believed to be most effective during periods of sideways movement. Such indicators may create numerous buy and sell signals that are useful when the market is not clearly trending upwards or downwards.
The RSI, at the beginning of last month, stood at 62.58 level. Towards the end of the month, it decreased by 12.81 points to close at 49.77 level. This decrease in RSI level shows that the market is moving away from the overbought zone.
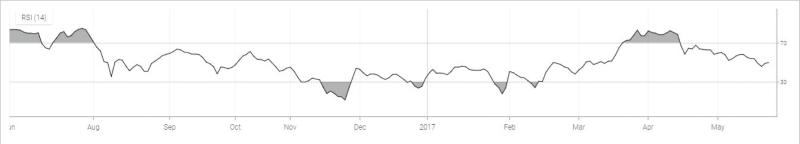
c. Bollinger Bands
The Bollinger Band is a technical indicator that consists of a moving average (21-day) along with two trading bands above (upper band) and below it (lower band). The bands are an indication of volatility, which are represented by calculating standard deviation.
The benchmark index moved away from the middle bollinger band and towards the lower band last month, indicating an increase in selling pressure in the market. The distance between the upper and lower bands has converged significantly, indicating a decrease in market volatility.
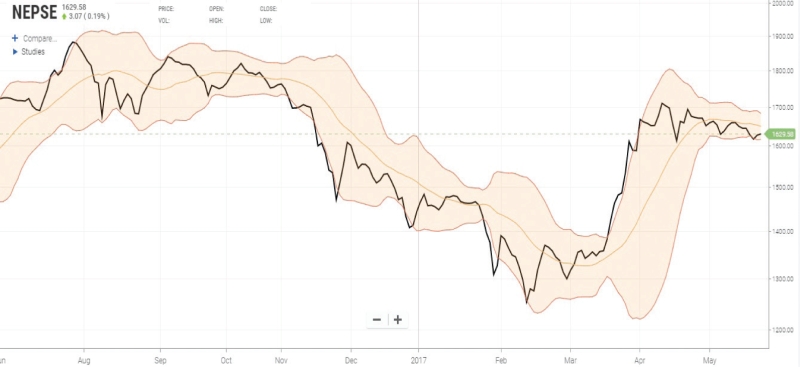
Overview
The benchmark index lost 42.8 points (or down-2.55%) to close at 1629.58 last month. Completion of the first level local elections did little to spur positive market sentiment. The index continues to hover above the 50-day and 200-day moving average, where the 200-day MA acts as a support level to the index. The macd, as well as the signal line continue to decline, where the macd is moving below the signal line, giving a bearish signal. The RSI is hovering at 49.77 level, indicating a shift from buying to selling pressure in the market. The bollinger bands show a decrease in the market volatility as the distance between the upper and lower bands has converged. The new support and resistance level stands at 1612 and 1780 respectively.