Notice (8): Trying to access array offset on value of type null [APP/View/MagazineArticles/view.ctp, line 54]Code Context $user = $this->Session->read('Auth.User');
//find the group of logged user
$groupId = $user['Group']['id'];
$viewFile = '/var/www/html/newbusinessage.com/app/View/MagazineArticles/view.ctp'
$dataForView = array(
'magazineArticle' => array(
'MagazineArticle' => array(
'id' => '1848',
'magazine_issue_id' => '975',
'magazine_category_id' => '63',
'title' => 'Monthly Technical Analysis of Nepse (28 May to 22 June 2017)',
'image' => null,
'short_content' => 'The benchmark index continued to fall in the course of last month. It declined by 70.09 points (or down -4.32%) last month to close at 1559.49. The index fell below the 50-day, as well as the 200-day moving average, giving a bearish signal.',
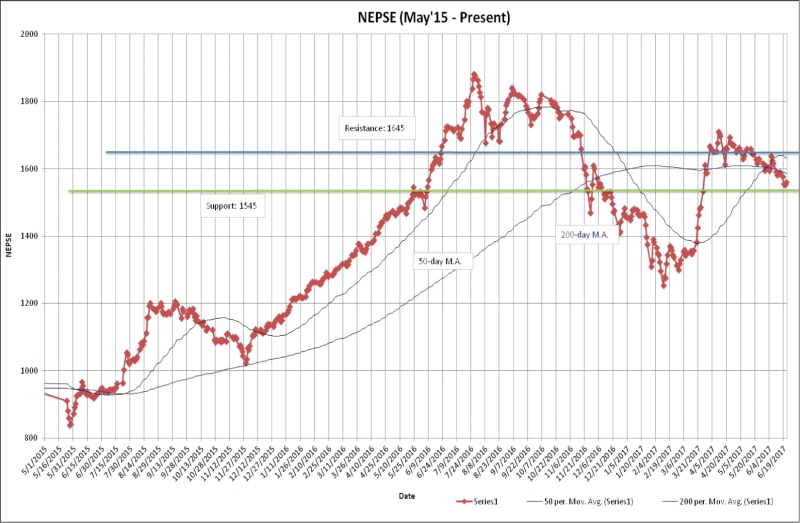
'content' => '<div style="text-align: justify;"><span style="font-size:22px"><strong>Continuing Decline</strong></span></div>
<div style="text-align: center;"><span style="font-size:22px"><strong><img alt="" src="/userfiles/images/Clipboard10%281%29.jpg" style="height:523px; width:800px" /></strong></span></div>
<div style="text-align: center;"><img alt="" src="/userfiles/images/Clipboard09%282%29.jpg" style="height:433px; width:800px" /></div>
<div style="text-align: justify;"> </div>
<div style="text-align: justify;"><span style="font-size:16px"><strong>Trend Analysis</strong></span></div>
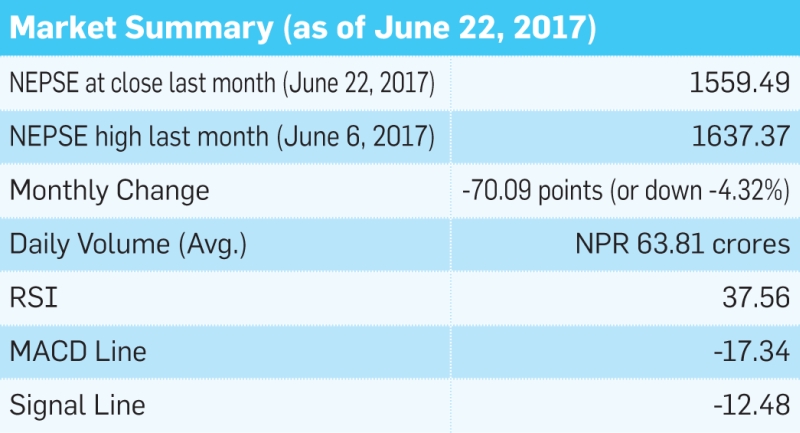
<div style="text-align: justify;">The benchmark index continued to fall in the course of last month. It declined by 70.09 points (or down -4.32%) last month to close at 1559.49. The index fell below the 50-day, as well as the 200-day moving average, giving a bearish signal. Uncertain political environment has left the investors in a confused state. The average volume turnover decreased to NPR 63.81 crores from NPR 75.21 crores the month prior. </div>
<div style="text-align: justify;"> </div>
<div style="text-align: justify;"><span style="font-size:16px"><strong>Resistance and Support</strong></span></div>
<div style="text-align: justify;"> </div>
<div style="text-align: center;"><img alt="" src="/userfiles/images/Clipboard12%285%29.jpg" /></div>
<div style="text-align: justify;"> </div>
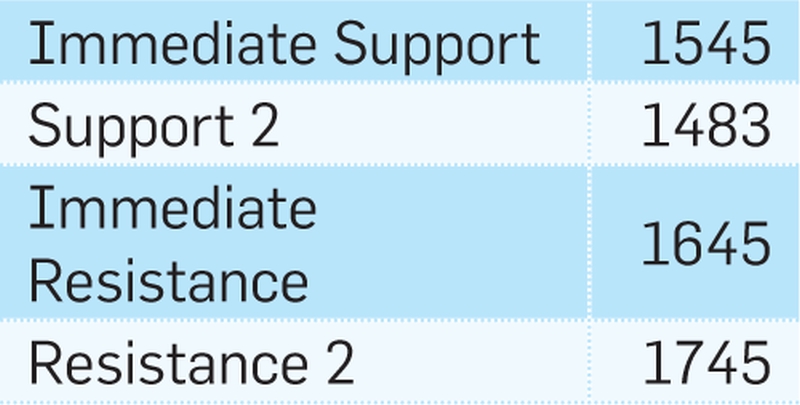
<div style="text-align: justify;">The benchmark index broke the support level of 1612 towards the middle of last month. Since then, the index has hovered around the late 1500’s level. The new support and resistance level now stands at 1545 and 1645. Possible successful completion of the second phase local election will boost investor confidence, which will cause the index to reach or breach the resistance level. </div>
<div style="text-align: justify;"> </div>
<div style="text-align: justify;"><span style="font-size:16px"><strong>Nepse Trend Indicator</strong></span></div>
<div style="text-align: justify;"><strong>a. MACD</strong></div>
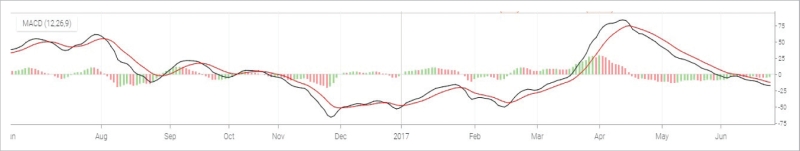
<div style="text-align: justify;">The MACD is a momentum oscillator formed by using two different types of moving averages, which provides specific buying or selling signals. When a MACD line crosses above the signal line, it is considered to be a positive sign and indicates a time to buy, and vice-versa. </div>
<div style="text-align: justify;"> </div>
<div style="text-align: justify;">The MACD and the signal line, at the beginning of last month, stood at 4.20 and 13.35 respectively. In the course of the month, both macd and the signal line declined by 21.54 and 25.83 points to close at -17.34 and -12.48 respectively. The macd indicator continues to give a bearish signal as it is moving below the signal line. Likewise, both the lines have entered the negative territory, further supporting the bearish sign.</div>
<div style="text-align: justify;"> </div>
<div style="text-align: center;"><img alt="" src="/userfiles/images/Clipboard11%283%29.jpg" style="height:151px; width:800px" /></div>
<div style="text-align: center;"><img alt="" src="/userfiles/images/Clipboard13%283%29.jpg" style="height:145px; width:800px" /></div>
<div style="text-align: justify;"> </div>
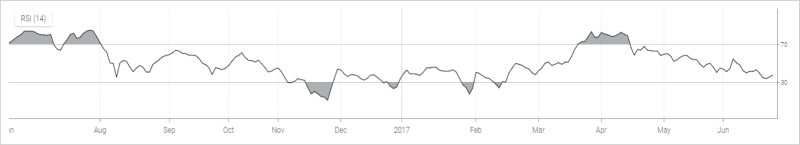
<div style="text-align: justify;"><strong>b. RSI</strong></div>
<div style="text-align: justify;">RSI is a form of leading indicator that is believed to be most effective during periods of sideways movement. Such indicators may create numerous buy and sell signals that are useful when the market is not clearly trending upwards or downwards. </div>
<div style="text-align: justify;"> </div>
<div style="text-align: justify;">The RSI, at the beginning of last month, stood at 45.67 level. Towards the end of the month, it decreased by 8.12 points to close at 37.56 level. The RSI continues to decline, indicating an increase in selling pressure. The RSI level reaching below the 30 zone will signify oversold condition in the market.</div>
<div style="text-align: justify;"> </div>
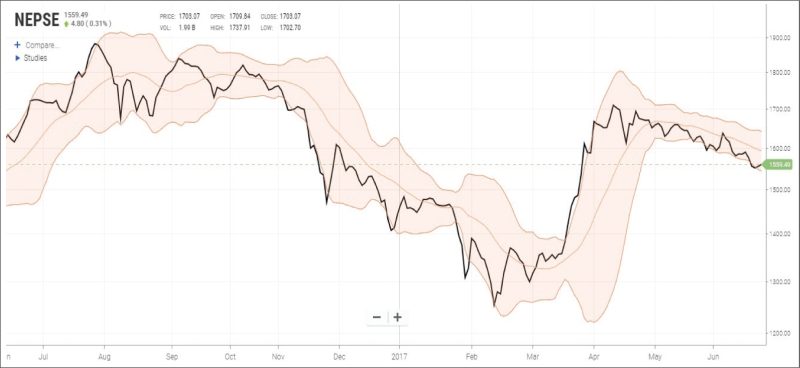
<div style="text-align: justify;"><strong>c. Bollinger Bands</strong></div>
<div style="text-align: justify;">The Bollinger Band is a technical indicator that consists of a moving average (21-day) along with two trading bands above (upper band) and below it (lower band). The bands are an indication of volatility, which are represented by calculating standard deviation. </div>
<div style="text-align: justify;"> </div>
<div style="text-align: justify;">The benchmark index hovered close to the lower Bollinger band for majority of last month, indicating selling pressure in the market. </div>
<div style="text-align: justify;">The close distance between the upper and lower bands continues to signify low market volatility.</div>
<div style="text-align: center;"> </div>
<div style="text-align: center;"><img alt="" src="/userfiles/images/Clipboard14%285%29.jpg" style="height:368px; width:800px" /></div>
<div style="text-align: justify;"> </div>
<div style="text-align: justify;"><span style="font-size:16px"><strong>Overview</strong></span></div>
<div style="text-align: justify;">The benchmark index further lost 70.09 points (or down -4.32%) to close at 1559.49 last month. The index has moved below the 50-day, as well as 200-day moving average, supporting the bearish sentiment in the market. The MACD, as well as the signal line continue to decline, where the MACD is moving below the signal line, giving a bearish signal. The RSI is hovering at 37.56 level, indicating a rise in selling pressure in the course of last month. The Bollinger bands show the market to be in an oversold zone. The bands also indicate low market volatility as the distance between the upper and lower bands remain narrow. The new support and resistance level stands at 1545 and 1645 respectively. </div>
<div style="text-align: justify;"> </div>
<div style="text-align: right;"><em>Disclaimer: This report has been prepared by Kriti Capital & Investments Ltd. on the basis of publicly available information and internal analysis of the market. The information contained herein does not purport to be comprehensive and is strictly for information purposes only.</em></div>
',
'status' => true,
'publish_date' => '0000-00-00',
'created' => '2017-07-08 15:31:08',
'modified' => '2017-07-12 09:11:12',
'keywords' => '',
'description' => '',
'sortorder' => '1796',
'feature_article' => true,
'user_id' => '11',
'image1' => null,
'image2' => null,
'image3' => null,
'image4' => null
),
'MagazineIssue' => array(
'id' => '975',
'image' => '20170707105833_cover.JPG',
'sortorder' => '1524',
'published' => true,
'created' => '2017-07-07 10:58:33',
'modified' => '2017-07-12 09:05:01',
'title' => 'July 2017',
'publish_date' => '2017-07-07',
'parent_id' => '0',
'homepage' => true,
'user_id' => '11'
),
'MagazineCategory' => array(
'id' => '63',
'title' => 'Stock Taking',
'sortorder' => '516',
'status' => true,
'created' => '0000-00-00 00:00:00',
'homepage' => true,
'modified' => '2013-04-01 00:00:00'
),
'User' => array(
'password' => '*****',
'id' => '11',
'user_detail_id' => '0',
'group_id' => '24',
'username' => 'nsingha@abhiyan.com.np',
'name' => '',
'email' => 'nsingha@abhiyan.com.np',
'address' => '',
'gender' => '',
'access' => '1',
'phone' => '',
'access_type' => '0',
'activated' => false,
'sortorder' => '0',
'published' => '0',
'created' => '2015-04-08 13:22:59',
'last_login' => '2023-04-16 09:29:47',
'ip' => '172.69.77.43'
),
'MagazineArticleComment' => array(),
'MagazineView' => array(
(int) 0 => array(
[maximum depth reached]
)
)
),
'current_user' => null,
'logged_in' => false
)
$magazineArticle = array(
'MagazineArticle' => array(
'id' => '1848',
'magazine_issue_id' => '975',
'magazine_category_id' => '63',
'title' => 'Monthly Technical Analysis of Nepse (28 May to 22 June 2017)',
'image' => null,
'short_content' => 'The benchmark index continued to fall in the course of last month. It declined by 70.09 points (or down -4.32%) last month to close at 1559.49. The index fell below the 50-day, as well as the 200-day moving average, giving a bearish signal.',
'content' => '<div style="text-align: justify;"><span style="font-size:22px"><strong>Continuing Decline</strong></span></div>
<div style="text-align: center;"><span style="font-size:22px"><strong><img alt="" src="/userfiles/images/Clipboard10%281%29.jpg" style="height:523px; width:800px" /></strong></span></div>
<div style="text-align: center;"><img alt="" src="/userfiles/images/Clipboard09%282%29.jpg" style="height:433px; width:800px" /></div>
<div style="text-align: justify;"> </div>
<div style="text-align: justify;"><span style="font-size:16px"><strong>Trend Analysis</strong></span></div>
<div style="text-align: justify;">The benchmark index continued to fall in the course of last month. It declined by 70.09 points (or down -4.32%) last month to close at 1559.49. The index fell below the 50-day, as well as the 200-day moving average, giving a bearish signal. Uncertain political environment has left the investors in a confused state. The average volume turnover decreased to NPR 63.81 crores from NPR 75.21 crores the month prior. </div>
<div style="text-align: justify;"> </div>
<div style="text-align: justify;"><span style="font-size:16px"><strong>Resistance and Support</strong></span></div>
<div style="text-align: justify;"> </div>
<div style="text-align: center;"><img alt="" src="/userfiles/images/Clipboard12%285%29.jpg" /></div>
<div style="text-align: justify;"> </div>
<div style="text-align: justify;">The benchmark index broke the support level of 1612 towards the middle of last month. Since then, the index has hovered around the late 1500’s level. The new support and resistance level now stands at 1545 and 1645. Possible successful completion of the second phase local election will boost investor confidence, which will cause the index to reach or breach the resistance level. </div>
<div style="text-align: justify;"> </div>
<div style="text-align: justify;"><span style="font-size:16px"><strong>Nepse Trend Indicator</strong></span></div>
<div style="text-align: justify;"><strong>a. MACD</strong></div>
<div style="text-align: justify;">The MACD is a momentum oscillator formed by using two different types of moving averages, which provides specific buying or selling signals. When a MACD line crosses above the signal line, it is considered to be a positive sign and indicates a time to buy, and vice-versa. </div>
<div style="text-align: justify;"> </div>
<div style="text-align: justify;">The MACD and the signal line, at the beginning of last month, stood at 4.20 and 13.35 respectively. In the course of the month, both macd and the signal line declined by 21.54 and 25.83 points to close at -17.34 and -12.48 respectively. The macd indicator continues to give a bearish signal as it is moving below the signal line. Likewise, both the lines have entered the negative territory, further supporting the bearish sign.</div>
<div style="text-align: justify;"> </div>
<div style="text-align: center;"><img alt="" src="/userfiles/images/Clipboard11%283%29.jpg" style="height:151px; width:800px" /></div>
<div style="text-align: center;"><img alt="" src="/userfiles/images/Clipboard13%283%29.jpg" style="height:145px; width:800px" /></div>
<div style="text-align: justify;"> </div>
<div style="text-align: justify;"><strong>b. RSI</strong></div>
<div style="text-align: justify;">RSI is a form of leading indicator that is believed to be most effective during periods of sideways movement. Such indicators may create numerous buy and sell signals that are useful when the market is not clearly trending upwards or downwards. </div>
<div style="text-align: justify;"> </div>
<div style="text-align: justify;">The RSI, at the beginning of last month, stood at 45.67 level. Towards the end of the month, it decreased by 8.12 points to close at 37.56 level. The RSI continues to decline, indicating an increase in selling pressure. The RSI level reaching below the 30 zone will signify oversold condition in the market.</div>
<div style="text-align: justify;"> </div>
<div style="text-align: justify;"><strong>c. Bollinger Bands</strong></div>
<div style="text-align: justify;">The Bollinger Band is a technical indicator that consists of a moving average (21-day) along with two trading bands above (upper band) and below it (lower band). The bands are an indication of volatility, which are represented by calculating standard deviation. </div>
<div style="text-align: justify;"> </div>
<div style="text-align: justify;">The benchmark index hovered close to the lower Bollinger band for majority of last month, indicating selling pressure in the market. </div>
<div style="text-align: justify;">The close distance between the upper and lower bands continues to signify low market volatility.</div>
<div style="text-align: center;"> </div>
<div style="text-align: center;"><img alt="" src="/userfiles/images/Clipboard14%285%29.jpg" style="height:368px; width:800px" /></div>
<div style="text-align: justify;"> </div>
<div style="text-align: justify;"><span style="font-size:16px"><strong>Overview</strong></span></div>
<div style="text-align: justify;">The benchmark index further lost 70.09 points (or down -4.32%) to close at 1559.49 last month. The index has moved below the 50-day, as well as 200-day moving average, supporting the bearish sentiment in the market. The MACD, as well as the signal line continue to decline, where the MACD is moving below the signal line, giving a bearish signal. The RSI is hovering at 37.56 level, indicating a rise in selling pressure in the course of last month. The Bollinger bands show the market to be in an oversold zone. The bands also indicate low market volatility as the distance between the upper and lower bands remain narrow. The new support and resistance level stands at 1545 and 1645 respectively. </div>
<div style="text-align: justify;"> </div>
<div style="text-align: right;"><em>Disclaimer: This report has been prepared by Kriti Capital & Investments Ltd. on the basis of publicly available information and internal analysis of the market. The information contained herein does not purport to be comprehensive and is strictly for information purposes only.</em></div>
',
'status' => true,
'publish_date' => '0000-00-00',
'created' => '2017-07-08 15:31:08',
'modified' => '2017-07-12 09:11:12',
'keywords' => '',
'description' => '',
'sortorder' => '1796',
'feature_article' => true,
'user_id' => '11',
'image1' => null,
'image2' => null,
'image3' => null,
'image4' => null
),
'MagazineIssue' => array(
'id' => '975',
'image' => '20170707105833_cover.JPG',
'sortorder' => '1524',
'published' => true,
'created' => '2017-07-07 10:58:33',
'modified' => '2017-07-12 09:05:01',
'title' => 'July 2017',
'publish_date' => '2017-07-07',
'parent_id' => '0',
'homepage' => true,
'user_id' => '11'
),
'MagazineCategory' => array(
'id' => '63',
'title' => 'Stock Taking',
'sortorder' => '516',
'status' => true,
'created' => '0000-00-00 00:00:00',
'homepage' => true,
'modified' => '2013-04-01 00:00:00'
),
'User' => array(
'password' => '*****',
'id' => '11',
'user_detail_id' => '0',
'group_id' => '24',
'username' => 'nsingha@abhiyan.com.np',
'name' => '',
'email' => 'nsingha@abhiyan.com.np',
'address' => '',
'gender' => '',
'access' => '1',
'phone' => '',
'access_type' => '0',
'activated' => false,
'sortorder' => '0',
'published' => '0',
'created' => '2015-04-08 13:22:59',
'last_login' => '2023-04-16 09:29:47',
'ip' => '172.69.77.43'
),
'MagazineArticleComment' => array(),
'MagazineView' => array(
(int) 0 => array(
'magazine_article_id' => '1848',
'hit' => '3578'
)
)
)
$current_user = null
$logged_in = false
$user = null
include - APP/View/MagazineArticles/view.ctp, line 54
View::_evaluate() - CORE/Cake/View/View.php, line 971
View::_render() - CORE/Cake/View/View.php, line 933
View::render() - CORE/Cake/View/View.php, line 473
Controller::render() - CORE/Cake/Controller/Controller.php, line 968
Dispatcher::_invoke() - CORE/Cake/Routing/Dispatcher.php, line 200
Dispatcher::dispatch() - CORE/Cake/Routing/Dispatcher.php, line 167
[main] - APP/webroot/index.php, line 117
Notice (8): Trying to access array offset on value of type null [APP/View/MagazineArticles/view.ctp, line 54]Code Context $user = $this->Session->read('Auth.User');
//find the group of logged user
$groupId = $user['Group']['id'];
$viewFile = '/var/www/html/newbusinessage.com/app/View/MagazineArticles/view.ctp'
$dataForView = array(
'magazineArticle' => array(
'MagazineArticle' => array(
'id' => '1848',
'magazine_issue_id' => '975',
'magazine_category_id' => '63',
'title' => 'Monthly Technical Analysis of Nepse (28 May to 22 June 2017)',
'image' => null,
'short_content' => 'The benchmark index continued to fall in the course of last month. It declined by 70.09 points (or down -4.32%) last month to close at 1559.49. The index fell below the 50-day, as well as the 200-day moving average, giving a bearish signal.',
'content' => '<div style="text-align: justify;"><span style="font-size:22px"><strong>Continuing Decline</strong></span></div>
<div style="text-align: center;"><span style="font-size:22px"><strong><img alt="" src="/userfiles/images/Clipboard10%281%29.jpg" style="height:523px; width:800px" /></strong></span></div>
<div style="text-align: center;"><img alt="" src="/userfiles/images/Clipboard09%282%29.jpg" style="height:433px; width:800px" /></div>
<div style="text-align: justify;"> </div>
<div style="text-align: justify;"><span style="font-size:16px"><strong>Trend Analysis</strong></span></div>
<div style="text-align: justify;">The benchmark index continued to fall in the course of last month. It declined by 70.09 points (or down -4.32%) last month to close at 1559.49. The index fell below the 50-day, as well as the 200-day moving average, giving a bearish signal. Uncertain political environment has left the investors in a confused state. The average volume turnover decreased to NPR 63.81 crores from NPR 75.21 crores the month prior. </div>
<div style="text-align: justify;"> </div>
<div style="text-align: justify;"><span style="font-size:16px"><strong>Resistance and Support</strong></span></div>
<div style="text-align: justify;"> </div>
<div style="text-align: center;"><img alt="" src="/userfiles/images/Clipboard12%285%29.jpg" /></div>
<div style="text-align: justify;"> </div>
<div style="text-align: justify;">The benchmark index broke the support level of 1612 towards the middle of last month. Since then, the index has hovered around the late 1500’s level. The new support and resistance level now stands at 1545 and 1645. Possible successful completion of the second phase local election will boost investor confidence, which will cause the index to reach or breach the resistance level. </div>
<div style="text-align: justify;"> </div>
<div style="text-align: justify;"><span style="font-size:16px"><strong>Nepse Trend Indicator</strong></span></div>
<div style="text-align: justify;"><strong>a. MACD</strong></div>
<div style="text-align: justify;">The MACD is a momentum oscillator formed by using two different types of moving averages, which provides specific buying or selling signals. When a MACD line crosses above the signal line, it is considered to be a positive sign and indicates a time to buy, and vice-versa. </div>
<div style="text-align: justify;"> </div>
<div style="text-align: justify;">The MACD and the signal line, at the beginning of last month, stood at 4.20 and 13.35 respectively. In the course of the month, both macd and the signal line declined by 21.54 and 25.83 points to close at -17.34 and -12.48 respectively. The macd indicator continues to give a bearish signal as it is moving below the signal line. Likewise, both the lines have entered the negative territory, further supporting the bearish sign.</div>
<div style="text-align: justify;"> </div>
<div style="text-align: center;"><img alt="" src="/userfiles/images/Clipboard11%283%29.jpg" style="height:151px; width:800px" /></div>
<div style="text-align: center;"><img alt="" src="/userfiles/images/Clipboard13%283%29.jpg" style="height:145px; width:800px" /></div>
<div style="text-align: justify;"> </div>
<div style="text-align: justify;"><strong>b. RSI</strong></div>
<div style="text-align: justify;">RSI is a form of leading indicator that is believed to be most effective during periods of sideways movement. Such indicators may create numerous buy and sell signals that are useful when the market is not clearly trending upwards or downwards. </div>
<div style="text-align: justify;"> </div>
<div style="text-align: justify;">The RSI, at the beginning of last month, stood at 45.67 level. Towards the end of the month, it decreased by 8.12 points to close at 37.56 level. The RSI continues to decline, indicating an increase in selling pressure. The RSI level reaching below the 30 zone will signify oversold condition in the market.</div>
<div style="text-align: justify;"> </div>
<div style="text-align: justify;"><strong>c. Bollinger Bands</strong></div>
<div style="text-align: justify;">The Bollinger Band is a technical indicator that consists of a moving average (21-day) along with two trading bands above (upper band) and below it (lower band). The bands are an indication of volatility, which are represented by calculating standard deviation. </div>
<div style="text-align: justify;"> </div>
<div style="text-align: justify;">The benchmark index hovered close to the lower Bollinger band for majority of last month, indicating selling pressure in the market. </div>
<div style="text-align: justify;">The close distance between the upper and lower bands continues to signify low market volatility.</div>
<div style="text-align: center;"> </div>
<div style="text-align: center;"><img alt="" src="/userfiles/images/Clipboard14%285%29.jpg" style="height:368px; width:800px" /></div>
<div style="text-align: justify;"> </div>
<div style="text-align: justify;"><span style="font-size:16px"><strong>Overview</strong></span></div>
<div style="text-align: justify;">The benchmark index further lost 70.09 points (or down -4.32%) to close at 1559.49 last month. The index has moved below the 50-day, as well as 200-day moving average, supporting the bearish sentiment in the market. The MACD, as well as the signal line continue to decline, where the MACD is moving below the signal line, giving a bearish signal. The RSI is hovering at 37.56 level, indicating a rise in selling pressure in the course of last month. The Bollinger bands show the market to be in an oversold zone. The bands also indicate low market volatility as the distance between the upper and lower bands remain narrow. The new support and resistance level stands at 1545 and 1645 respectively. </div>
<div style="text-align: justify;"> </div>
<div style="text-align: right;"><em>Disclaimer: This report has been prepared by Kriti Capital & Investments Ltd. on the basis of publicly available information and internal analysis of the market. The information contained herein does not purport to be comprehensive and is strictly for information purposes only.</em></div>
',
'status' => true,
'publish_date' => '0000-00-00',
'created' => '2017-07-08 15:31:08',
'modified' => '2017-07-12 09:11:12',
'keywords' => '',
'description' => '',
'sortorder' => '1796',
'feature_article' => true,
'user_id' => '11',
'image1' => null,
'image2' => null,
'image3' => null,
'image4' => null
),
'MagazineIssue' => array(
'id' => '975',
'image' => '20170707105833_cover.JPG',
'sortorder' => '1524',
'published' => true,
'created' => '2017-07-07 10:58:33',
'modified' => '2017-07-12 09:05:01',
'title' => 'July 2017',
'publish_date' => '2017-07-07',
'parent_id' => '0',
'homepage' => true,
'user_id' => '11'
),
'MagazineCategory' => array(
'id' => '63',
'title' => 'Stock Taking',
'sortorder' => '516',
'status' => true,
'created' => '0000-00-00 00:00:00',
'homepage' => true,
'modified' => '2013-04-01 00:00:00'
),
'User' => array(
'password' => '*****',
'id' => '11',
'user_detail_id' => '0',
'group_id' => '24',
'username' => 'nsingha@abhiyan.com.np',
'name' => '',
'email' => 'nsingha@abhiyan.com.np',
'address' => '',
'gender' => '',
'access' => '1',
'phone' => '',
'access_type' => '0',
'activated' => false,
'sortorder' => '0',
'published' => '0',
'created' => '2015-04-08 13:22:59',
'last_login' => '2023-04-16 09:29:47',
'ip' => '172.69.77.43'
),
'MagazineArticleComment' => array(),
'MagazineView' => array(
(int) 0 => array(
[maximum depth reached]
)
)
),
'current_user' => null,
'logged_in' => false
)
$magazineArticle = array(
'MagazineArticle' => array(
'id' => '1848',
'magazine_issue_id' => '975',
'magazine_category_id' => '63',
'title' => 'Monthly Technical Analysis of Nepse (28 May to 22 June 2017)',
'image' => null,
'short_content' => 'The benchmark index continued to fall in the course of last month. It declined by 70.09 points (or down -4.32%) last month to close at 1559.49. The index fell below the 50-day, as well as the 200-day moving average, giving a bearish signal.',
'content' => '<div style="text-align: justify;"><span style="font-size:22px"><strong>Continuing Decline</strong></span></div>
<div style="text-align: center;"><span style="font-size:22px"><strong><img alt="" src="/userfiles/images/Clipboard10%281%29.jpg" style="height:523px; width:800px" /></strong></span></div>
<div style="text-align: center;"><img alt="" src="/userfiles/images/Clipboard09%282%29.jpg" style="height:433px; width:800px" /></div>
<div style="text-align: justify;"> </div>
<div style="text-align: justify;"><span style="font-size:16px"><strong>Trend Analysis</strong></span></div>
<div style="text-align: justify;">The benchmark index continued to fall in the course of last month. It declined by 70.09 points (or down -4.32%) last month to close at 1559.49. The index fell below the 50-day, as well as the 200-day moving average, giving a bearish signal. Uncertain political environment has left the investors in a confused state. The average volume turnover decreased to NPR 63.81 crores from NPR 75.21 crores the month prior. </div>
<div style="text-align: justify;"> </div>
<div style="text-align: justify;"><span style="font-size:16px"><strong>Resistance and Support</strong></span></div>
<div style="text-align: justify;"> </div>
<div style="text-align: center;"><img alt="" src="/userfiles/images/Clipboard12%285%29.jpg" /></div>
<div style="text-align: justify;"> </div>
<div style="text-align: justify;">The benchmark index broke the support level of 1612 towards the middle of last month. Since then, the index has hovered around the late 1500’s level. The new support and resistance level now stands at 1545 and 1645. Possible successful completion of the second phase local election will boost investor confidence, which will cause the index to reach or breach the resistance level. </div>
<div style="text-align: justify;"> </div>
<div style="text-align: justify;"><span style="font-size:16px"><strong>Nepse Trend Indicator</strong></span></div>
<div style="text-align: justify;"><strong>a. MACD</strong></div>
<div style="text-align: justify;">The MACD is a momentum oscillator formed by using two different types of moving averages, which provides specific buying or selling signals. When a MACD line crosses above the signal line, it is considered to be a positive sign and indicates a time to buy, and vice-versa. </div>
<div style="text-align: justify;"> </div>
<div style="text-align: justify;">The MACD and the signal line, at the beginning of last month, stood at 4.20 and 13.35 respectively. In the course of the month, both macd and the signal line declined by 21.54 and 25.83 points to close at -17.34 and -12.48 respectively. The macd indicator continues to give a bearish signal as it is moving below the signal line. Likewise, both the lines have entered the negative territory, further supporting the bearish sign.</div>
<div style="text-align: justify;"> </div>
<div style="text-align: center;"><img alt="" src="/userfiles/images/Clipboard11%283%29.jpg" style="height:151px; width:800px" /></div>
<div style="text-align: center;"><img alt="" src="/userfiles/images/Clipboard13%283%29.jpg" style="height:145px; width:800px" /></div>
<div style="text-align: justify;"> </div>
<div style="text-align: justify;"><strong>b. RSI</strong></div>
<div style="text-align: justify;">RSI is a form of leading indicator that is believed to be most effective during periods of sideways movement. Such indicators may create numerous buy and sell signals that are useful when the market is not clearly trending upwards or downwards. </div>
<div style="text-align: justify;"> </div>
<div style="text-align: justify;">The RSI, at the beginning of last month, stood at 45.67 level. Towards the end of the month, it decreased by 8.12 points to close at 37.56 level. The RSI continues to decline, indicating an increase in selling pressure. The RSI level reaching below the 30 zone will signify oversold condition in the market.</div>
<div style="text-align: justify;"> </div>
<div style="text-align: justify;"><strong>c. Bollinger Bands</strong></div>
<div style="text-align: justify;">The Bollinger Band is a technical indicator that consists of a moving average (21-day) along with two trading bands above (upper band) and below it (lower band). The bands are an indication of volatility, which are represented by calculating standard deviation. </div>
<div style="text-align: justify;"> </div>
<div style="text-align: justify;">The benchmark index hovered close to the lower Bollinger band for majority of last month, indicating selling pressure in the market. </div>
<div style="text-align: justify;">The close distance between the upper and lower bands continues to signify low market volatility.</div>
<div style="text-align: center;"> </div>
<div style="text-align: center;"><img alt="" src="/userfiles/images/Clipboard14%285%29.jpg" style="height:368px; width:800px" /></div>
<div style="text-align: justify;"> </div>
<div style="text-align: justify;"><span style="font-size:16px"><strong>Overview</strong></span></div>
<div style="text-align: justify;">The benchmark index further lost 70.09 points (or down -4.32%) to close at 1559.49 last month. The index has moved below the 50-day, as well as 200-day moving average, supporting the bearish sentiment in the market. The MACD, as well as the signal line continue to decline, where the MACD is moving below the signal line, giving a bearish signal. The RSI is hovering at 37.56 level, indicating a rise in selling pressure in the course of last month. The Bollinger bands show the market to be in an oversold zone. The bands also indicate low market volatility as the distance between the upper and lower bands remain narrow. The new support and resistance level stands at 1545 and 1645 respectively. </div>
<div style="text-align: justify;"> </div>
<div style="text-align: right;"><em>Disclaimer: This report has been prepared by Kriti Capital & Investments Ltd. on the basis of publicly available information and internal analysis of the market. The information contained herein does not purport to be comprehensive and is strictly for information purposes only.</em></div>
',
'status' => true,
'publish_date' => '0000-00-00',
'created' => '2017-07-08 15:31:08',
'modified' => '2017-07-12 09:11:12',
'keywords' => '',
'description' => '',
'sortorder' => '1796',
'feature_article' => true,
'user_id' => '11',
'image1' => null,
'image2' => null,
'image3' => null,
'image4' => null
),
'MagazineIssue' => array(
'id' => '975',
'image' => '20170707105833_cover.JPG',
'sortorder' => '1524',
'published' => true,
'created' => '2017-07-07 10:58:33',
'modified' => '2017-07-12 09:05:01',
'title' => 'July 2017',
'publish_date' => '2017-07-07',
'parent_id' => '0',
'homepage' => true,
'user_id' => '11'
),
'MagazineCategory' => array(
'id' => '63',
'title' => 'Stock Taking',
'sortorder' => '516',
'status' => true,
'created' => '0000-00-00 00:00:00',
'homepage' => true,
'modified' => '2013-04-01 00:00:00'
),
'User' => array(
'password' => '*****',
'id' => '11',
'user_detail_id' => '0',
'group_id' => '24',
'username' => 'nsingha@abhiyan.com.np',
'name' => '',
'email' => 'nsingha@abhiyan.com.np',
'address' => '',
'gender' => '',
'access' => '1',
'phone' => '',
'access_type' => '0',
'activated' => false,
'sortorder' => '0',
'published' => '0',
'created' => '2015-04-08 13:22:59',
'last_login' => '2023-04-16 09:29:47',
'ip' => '172.69.77.43'
),
'MagazineArticleComment' => array(),
'MagazineView' => array(
(int) 0 => array(
'magazine_article_id' => '1848',
'hit' => '3578'
)
)
)
$current_user = null
$logged_in = false
$user = null
include - APP/View/MagazineArticles/view.ctp, line 54
View::_evaluate() - CORE/Cake/View/View.php, line 971
View::_render() - CORE/Cake/View/View.php, line 933
View::render() - CORE/Cake/View/View.php, line 473
Controller::render() - CORE/Cake/Controller/Controller.php, line 968
Dispatcher::_invoke() - CORE/Cake/Routing/Dispatcher.php, line 200
Dispatcher::dispatch() - CORE/Cake/Routing/Dispatcher.php, line 167
[main] - APP/webroot/index.php, line 117
Notice (8): Trying to access array offset on value of type null [APP/View/MagazineArticles/view.ctp, line 55]Code Context //find the group of logged user
$groupId = $user['Group']['id'];
$user_id=$user["id"];
$viewFile = '/var/www/html/newbusinessage.com/app/View/MagazineArticles/view.ctp'
$dataForView = array(
'magazineArticle' => array(
'MagazineArticle' => array(
'id' => '1848',
'magazine_issue_id' => '975',
'magazine_category_id' => '63',
'title' => 'Monthly Technical Analysis of Nepse (28 May to 22 June 2017)',
'image' => null,
'short_content' => 'The benchmark index continued to fall in the course of last month. It declined by 70.09 points (or down -4.32%) last month to close at 1559.49. The index fell below the 50-day, as well as the 200-day moving average, giving a bearish signal.',
'content' => '<div style="text-align: justify;"><span style="font-size:22px"><strong>Continuing Decline</strong></span></div>
<div style="text-align: center;"><span style="font-size:22px"><strong><img alt="" src="/userfiles/images/Clipboard10%281%29.jpg" style="height:523px; width:800px" /></strong></span></div>
<div style="text-align: center;"><img alt="" src="/userfiles/images/Clipboard09%282%29.jpg" style="height:433px; width:800px" /></div>
<div style="text-align: justify;"> </div>
<div style="text-align: justify;"><span style="font-size:16px"><strong>Trend Analysis</strong></span></div>
<div style="text-align: justify;">The benchmark index continued to fall in the course of last month. It declined by 70.09 points (or down -4.32%) last month to close at 1559.49. The index fell below the 50-day, as well as the 200-day moving average, giving a bearish signal. Uncertain political environment has left the investors in a confused state. The average volume turnover decreased to NPR 63.81 crores from NPR 75.21 crores the month prior. </div>
<div style="text-align: justify;"> </div>
<div style="text-align: justify;"><span style="font-size:16px"><strong>Resistance and Support</strong></span></div>
<div style="text-align: justify;"> </div>
<div style="text-align: center;"><img alt="" src="/userfiles/images/Clipboard12%285%29.jpg" /></div>
<div style="text-align: justify;"> </div>
<div style="text-align: justify;">The benchmark index broke the support level of 1612 towards the middle of last month. Since then, the index has hovered around the late 1500’s level. The new support and resistance level now stands at 1545 and 1645. Possible successful completion of the second phase local election will boost investor confidence, which will cause the index to reach or breach the resistance level. </div>
<div style="text-align: justify;"> </div>
<div style="text-align: justify;"><span style="font-size:16px"><strong>Nepse Trend Indicator</strong></span></div>
<div style="text-align: justify;"><strong>a. MACD</strong></div>
<div style="text-align: justify;">The MACD is a momentum oscillator formed by using two different types of moving averages, which provides specific buying or selling signals. When a MACD line crosses above the signal line, it is considered to be a positive sign and indicates a time to buy, and vice-versa. </div>
<div style="text-align: justify;"> </div>
<div style="text-align: justify;">The MACD and the signal line, at the beginning of last month, stood at 4.20 and 13.35 respectively. In the course of the month, both macd and the signal line declined by 21.54 and 25.83 points to close at -17.34 and -12.48 respectively. The macd indicator continues to give a bearish signal as it is moving below the signal line. Likewise, both the lines have entered the negative territory, further supporting the bearish sign.</div>
<div style="text-align: justify;"> </div>
<div style="text-align: center;"><img alt="" src="/userfiles/images/Clipboard11%283%29.jpg" style="height:151px; width:800px" /></div>
<div style="text-align: center;"><img alt="" src="/userfiles/images/Clipboard13%283%29.jpg" style="height:145px; width:800px" /></div>
<div style="text-align: justify;"> </div>
<div style="text-align: justify;"><strong>b. RSI</strong></div>
<div style="text-align: justify;">RSI is a form of leading indicator that is believed to be most effective during periods of sideways movement. Such indicators may create numerous buy and sell signals that are useful when the market is not clearly trending upwards or downwards. </div>
<div style="text-align: justify;"> </div>
<div style="text-align: justify;">The RSI, at the beginning of last month, stood at 45.67 level. Towards the end of the month, it decreased by 8.12 points to close at 37.56 level. The RSI continues to decline, indicating an increase in selling pressure. The RSI level reaching below the 30 zone will signify oversold condition in the market.</div>
<div style="text-align: justify;"> </div>
<div style="text-align: justify;"><strong>c. Bollinger Bands</strong></div>
<div style="text-align: justify;">The Bollinger Band is a technical indicator that consists of a moving average (21-day) along with two trading bands above (upper band) and below it (lower band). The bands are an indication of volatility, which are represented by calculating standard deviation. </div>
<div style="text-align: justify;"> </div>
<div style="text-align: justify;">The benchmark index hovered close to the lower Bollinger band for majority of last month, indicating selling pressure in the market. </div>
<div style="text-align: justify;">The close distance between the upper and lower bands continues to signify low market volatility.</div>
<div style="text-align: center;"> </div>
<div style="text-align: center;"><img alt="" src="/userfiles/images/Clipboard14%285%29.jpg" style="height:368px; width:800px" /></div>
<div style="text-align: justify;"> </div>
<div style="text-align: justify;"><span style="font-size:16px"><strong>Overview</strong></span></div>
<div style="text-align: justify;">The benchmark index further lost 70.09 points (or down -4.32%) to close at 1559.49 last month. The index has moved below the 50-day, as well as 200-day moving average, supporting the bearish sentiment in the market. The MACD, as well as the signal line continue to decline, where the MACD is moving below the signal line, giving a bearish signal. The RSI is hovering at 37.56 level, indicating a rise in selling pressure in the course of last month. The Bollinger bands show the market to be in an oversold zone. The bands also indicate low market volatility as the distance between the upper and lower bands remain narrow. The new support and resistance level stands at 1545 and 1645 respectively. </div>
<div style="text-align: justify;"> </div>
<div style="text-align: right;"><em>Disclaimer: This report has been prepared by Kriti Capital & Investments Ltd. on the basis of publicly available information and internal analysis of the market. The information contained herein does not purport to be comprehensive and is strictly for information purposes only.</em></div>
',
'status' => true,
'publish_date' => '0000-00-00',
'created' => '2017-07-08 15:31:08',
'modified' => '2017-07-12 09:11:12',
'keywords' => '',
'description' => '',
'sortorder' => '1796',
'feature_article' => true,
'user_id' => '11',
'image1' => null,
'image2' => null,
'image3' => null,
'image4' => null
),
'MagazineIssue' => array(
'id' => '975',
'image' => '20170707105833_cover.JPG',
'sortorder' => '1524',
'published' => true,
'created' => '2017-07-07 10:58:33',
'modified' => '2017-07-12 09:05:01',
'title' => 'July 2017',
'publish_date' => '2017-07-07',
'parent_id' => '0',
'homepage' => true,
'user_id' => '11'
),
'MagazineCategory' => array(
'id' => '63',
'title' => 'Stock Taking',
'sortorder' => '516',
'status' => true,
'created' => '0000-00-00 00:00:00',
'homepage' => true,
'modified' => '2013-04-01 00:00:00'
),
'User' => array(
'password' => '*****',
'id' => '11',
'user_detail_id' => '0',
'group_id' => '24',
'username' => 'nsingha@abhiyan.com.np',
'name' => '',
'email' => 'nsingha@abhiyan.com.np',
'address' => '',
'gender' => '',
'access' => '1',
'phone' => '',
'access_type' => '0',
'activated' => false,
'sortorder' => '0',
'published' => '0',
'created' => '2015-04-08 13:22:59',
'last_login' => '2023-04-16 09:29:47',
'ip' => '172.69.77.43'
),
'MagazineArticleComment' => array(),
'MagazineView' => array(
(int) 0 => array(
[maximum depth reached]
)
)
),
'current_user' => null,
'logged_in' => false
)
$magazineArticle = array(
'MagazineArticle' => array(
'id' => '1848',
'magazine_issue_id' => '975',
'magazine_category_id' => '63',
'title' => 'Monthly Technical Analysis of Nepse (28 May to 22 June 2017)',
'image' => null,
'short_content' => 'The benchmark index continued to fall in the course of last month. It declined by 70.09 points (or down -4.32%) last month to close at 1559.49. The index fell below the 50-day, as well as the 200-day moving average, giving a bearish signal.',
'content' => '<div style="text-align: justify;"><span style="font-size:22px"><strong>Continuing Decline</strong></span></div>
<div style="text-align: center;"><span style="font-size:22px"><strong><img alt="" src="/userfiles/images/Clipboard10%281%29.jpg" style="height:523px; width:800px" /></strong></span></div>
<div style="text-align: center;"><img alt="" src="/userfiles/images/Clipboard09%282%29.jpg" style="height:433px; width:800px" /></div>
<div style="text-align: justify;"> </div>
<div style="text-align: justify;"><span style="font-size:16px"><strong>Trend Analysis</strong></span></div>
<div style="text-align: justify;">The benchmark index continued to fall in the course of last month. It declined by 70.09 points (or down -4.32%) last month to close at 1559.49. The index fell below the 50-day, as well as the 200-day moving average, giving a bearish signal. Uncertain political environment has left the investors in a confused state. The average volume turnover decreased to NPR 63.81 crores from NPR 75.21 crores the month prior. </div>
<div style="text-align: justify;"> </div>
<div style="text-align: justify;"><span style="font-size:16px"><strong>Resistance and Support</strong></span></div>
<div style="text-align: justify;"> </div>
<div style="text-align: center;"><img alt="" src="/userfiles/images/Clipboard12%285%29.jpg" /></div>
<div style="text-align: justify;"> </div>
<div style="text-align: justify;">The benchmark index broke the support level of 1612 towards the middle of last month. Since then, the index has hovered around the late 1500’s level. The new support and resistance level now stands at 1545 and 1645. Possible successful completion of the second phase local election will boost investor confidence, which will cause the index to reach or breach the resistance level. </div>
<div style="text-align: justify;"> </div>
<div style="text-align: justify;"><span style="font-size:16px"><strong>Nepse Trend Indicator</strong></span></div>
<div style="text-align: justify;"><strong>a. MACD</strong></div>
<div style="text-align: justify;">The MACD is a momentum oscillator formed by using two different types of moving averages, which provides specific buying or selling signals. When a MACD line crosses above the signal line, it is considered to be a positive sign and indicates a time to buy, and vice-versa. </div>
<div style="text-align: justify;"> </div>
<div style="text-align: justify;">The MACD and the signal line, at the beginning of last month, stood at 4.20 and 13.35 respectively. In the course of the month, both macd and the signal line declined by 21.54 and 25.83 points to close at -17.34 and -12.48 respectively. The macd indicator continues to give a bearish signal as it is moving below the signal line. Likewise, both the lines have entered the negative territory, further supporting the bearish sign.</div>
<div style="text-align: justify;"> </div>
<div style="text-align: center;"><img alt="" src="/userfiles/images/Clipboard11%283%29.jpg" style="height:151px; width:800px" /></div>
<div style="text-align: center;"><img alt="" src="/userfiles/images/Clipboard13%283%29.jpg" style="height:145px; width:800px" /></div>
<div style="text-align: justify;"> </div>
<div style="text-align: justify;"><strong>b. RSI</strong></div>
<div style="text-align: justify;">RSI is a form of leading indicator that is believed to be most effective during periods of sideways movement. Such indicators may create numerous buy and sell signals that are useful when the market is not clearly trending upwards or downwards. </div>
<div style="text-align: justify;"> </div>
<div style="text-align: justify;">The RSI, at the beginning of last month, stood at 45.67 level. Towards the end of the month, it decreased by 8.12 points to close at 37.56 level. The RSI continues to decline, indicating an increase in selling pressure. The RSI level reaching below the 30 zone will signify oversold condition in the market.</div>
<div style="text-align: justify;"> </div>
<div style="text-align: justify;"><strong>c. Bollinger Bands</strong></div>
<div style="text-align: justify;">The Bollinger Band is a technical indicator that consists of a moving average (21-day) along with two trading bands above (upper band) and below it (lower band). The bands are an indication of volatility, which are represented by calculating standard deviation. </div>
<div style="text-align: justify;"> </div>
<div style="text-align: justify;">The benchmark index hovered close to the lower Bollinger band for majority of last month, indicating selling pressure in the market. </div>
<div style="text-align: justify;">The close distance between the upper and lower bands continues to signify low market volatility.</div>
<div style="text-align: center;"> </div>
<div style="text-align: center;"><img alt="" src="/userfiles/images/Clipboard14%285%29.jpg" style="height:368px; width:800px" /></div>
<div style="text-align: justify;"> </div>
<div style="text-align: justify;"><span style="font-size:16px"><strong>Overview</strong></span></div>
<div style="text-align: justify;">The benchmark index further lost 70.09 points (or down -4.32%) to close at 1559.49 last month. The index has moved below the 50-day, as well as 200-day moving average, supporting the bearish sentiment in the market. The MACD, as well as the signal line continue to decline, where the MACD is moving below the signal line, giving a bearish signal. The RSI is hovering at 37.56 level, indicating a rise in selling pressure in the course of last month. The Bollinger bands show the market to be in an oversold zone. The bands also indicate low market volatility as the distance between the upper and lower bands remain narrow. The new support and resistance level stands at 1545 and 1645 respectively. </div>
<div style="text-align: justify;"> </div>
<div style="text-align: right;"><em>Disclaimer: This report has been prepared by Kriti Capital & Investments Ltd. on the basis of publicly available information and internal analysis of the market. The information contained herein does not purport to be comprehensive and is strictly for information purposes only.</em></div>
',
'status' => true,
'publish_date' => '0000-00-00',
'created' => '2017-07-08 15:31:08',
'modified' => '2017-07-12 09:11:12',
'keywords' => '',
'description' => '',
'sortorder' => '1796',
'feature_article' => true,
'user_id' => '11',
'image1' => null,
'image2' => null,
'image3' => null,
'image4' => null
),
'MagazineIssue' => array(
'id' => '975',
'image' => '20170707105833_cover.JPG',
'sortorder' => '1524',
'published' => true,
'created' => '2017-07-07 10:58:33',
'modified' => '2017-07-12 09:05:01',
'title' => 'July 2017',
'publish_date' => '2017-07-07',
'parent_id' => '0',
'homepage' => true,
'user_id' => '11'
),
'MagazineCategory' => array(
'id' => '63',
'title' => 'Stock Taking',
'sortorder' => '516',
'status' => true,
'created' => '0000-00-00 00:00:00',
'homepage' => true,
'modified' => '2013-04-01 00:00:00'
),
'User' => array(
'password' => '*****',
'id' => '11',
'user_detail_id' => '0',
'group_id' => '24',
'username' => 'nsingha@abhiyan.com.np',
'name' => '',
'email' => 'nsingha@abhiyan.com.np',
'address' => '',
'gender' => '',
'access' => '1',
'phone' => '',
'access_type' => '0',
'activated' => false,
'sortorder' => '0',
'published' => '0',
'created' => '2015-04-08 13:22:59',
'last_login' => '2023-04-16 09:29:47',
'ip' => '172.69.77.43'
),
'MagazineArticleComment' => array(),
'MagazineView' => array(
(int) 0 => array(
'magazine_article_id' => '1848',
'hit' => '3578'
)
)
)
$current_user = null
$logged_in = false
$user = null
$groupId = null
include - APP/View/MagazineArticles/view.ctp, line 55
View::_evaluate() - CORE/Cake/View/View.php, line 971
View::_render() - CORE/Cake/View/View.php, line 933
View::render() - CORE/Cake/View/View.php, line 473
Controller::render() - CORE/Cake/Controller/Controller.php, line 968
Dispatcher::_invoke() - CORE/Cake/Routing/Dispatcher.php, line 200
Dispatcher::dispatch() - CORE/Cake/Routing/Dispatcher.php, line 167
[main] - APP/webroot/index.php, line 117
Notice (8): Undefined index: summary [APP/View/MagazineArticles/view.ctp, line 62]Code Context<?php
echo $this->Html->meta(array('name' => 'description', 'type' => 'meta', 'content' => $magazineArticle['MagazineArticle']['summary']), null, array('inline' => false));?>
$viewFile = '/var/www/html/newbusinessage.com/app/View/MagazineArticles/view.ctp'
$dataForView = array(
'magazineArticle' => array(
'MagazineArticle' => array(
'id' => '1848',
'magazine_issue_id' => '975',
'magazine_category_id' => '63',
'title' => 'Monthly Technical Analysis of Nepse (28 May to 22 June 2017)',
'image' => null,
'short_content' => 'The benchmark index continued to fall in the course of last month. It declined by 70.09 points (or down -4.32%) last month to close at 1559.49. The index fell below the 50-day, as well as the 200-day moving average, giving a bearish signal.',
'content' => '<div style="text-align: justify;"><span style="font-size:22px"><strong>Continuing Decline</strong></span></div>
<div style="text-align: center;"><span style="font-size:22px"><strong><img alt="" src="/userfiles/images/Clipboard10%281%29.jpg" style="height:523px; width:800px" /></strong></span></div>
<div style="text-align: center;"><img alt="" src="/userfiles/images/Clipboard09%282%29.jpg" style="height:433px; width:800px" /></div>
<div style="text-align: justify;"> </div>
<div style="text-align: justify;"><span style="font-size:16px"><strong>Trend Analysis</strong></span></div>
<div style="text-align: justify;">The benchmark index continued to fall in the course of last month. It declined by 70.09 points (or down -4.32%) last month to close at 1559.49. The index fell below the 50-day, as well as the 200-day moving average, giving a bearish signal. Uncertain political environment has left the investors in a confused state. The average volume turnover decreased to NPR 63.81 crores from NPR 75.21 crores the month prior. </div>
<div style="text-align: justify;"> </div>
<div style="text-align: justify;"><span style="font-size:16px"><strong>Resistance and Support</strong></span></div>
<div style="text-align: justify;"> </div>
<div style="text-align: center;"><img alt="" src="/userfiles/images/Clipboard12%285%29.jpg" /></div>
<div style="text-align: justify;"> </div>
<div style="text-align: justify;">The benchmark index broke the support level of 1612 towards the middle of last month. Since then, the index has hovered around the late 1500’s level. The new support and resistance level now stands at 1545 and 1645. Possible successful completion of the second phase local election will boost investor confidence, which will cause the index to reach or breach the resistance level. </div>
<div style="text-align: justify;"> </div>
<div style="text-align: justify;"><span style="font-size:16px"><strong>Nepse Trend Indicator</strong></span></div>
<div style="text-align: justify;"><strong>a. MACD</strong></div>
<div style="text-align: justify;">The MACD is a momentum oscillator formed by using two different types of moving averages, which provides specific buying or selling signals. When a MACD line crosses above the signal line, it is considered to be a positive sign and indicates a time to buy, and vice-versa. </div>
<div style="text-align: justify;"> </div>
<div style="text-align: justify;">The MACD and the signal line, at the beginning of last month, stood at 4.20 and 13.35 respectively. In the course of the month, both macd and the signal line declined by 21.54 and 25.83 points to close at -17.34 and -12.48 respectively. The macd indicator continues to give a bearish signal as it is moving below the signal line. Likewise, both the lines have entered the negative territory, further supporting the bearish sign.</div>
<div style="text-align: justify;"> </div>
<div style="text-align: center;"><img alt="" src="/userfiles/images/Clipboard11%283%29.jpg" style="height:151px; width:800px" /></div>
<div style="text-align: center;"><img alt="" src="/userfiles/images/Clipboard13%283%29.jpg" style="height:145px; width:800px" /></div>
<div style="text-align: justify;"> </div>
<div style="text-align: justify;"><strong>b. RSI</strong></div>
<div style="text-align: justify;">RSI is a form of leading indicator that is believed to be most effective during periods of sideways movement. Such indicators may create numerous buy and sell signals that are useful when the market is not clearly trending upwards or downwards. </div>
<div style="text-align: justify;"> </div>
<div style="text-align: justify;">The RSI, at the beginning of last month, stood at 45.67 level. Towards the end of the month, it decreased by 8.12 points to close at 37.56 level. The RSI continues to decline, indicating an increase in selling pressure. The RSI level reaching below the 30 zone will signify oversold condition in the market.</div>
<div style="text-align: justify;"> </div>
<div style="text-align: justify;"><strong>c. Bollinger Bands</strong></div>
<div style="text-align: justify;">The Bollinger Band is a technical indicator that consists of a moving average (21-day) along with two trading bands above (upper band) and below it (lower band). The bands are an indication of volatility, which are represented by calculating standard deviation. </div>
<div style="text-align: justify;"> </div>
<div style="text-align: justify;">The benchmark index hovered close to the lower Bollinger band for majority of last month, indicating selling pressure in the market. </div>
<div style="text-align: justify;">The close distance between the upper and lower bands continues to signify low market volatility.</div>
<div style="text-align: center;"> </div>
<div style="text-align: center;"><img alt="" src="/userfiles/images/Clipboard14%285%29.jpg" style="height:368px; width:800px" /></div>
<div style="text-align: justify;"> </div>
<div style="text-align: justify;"><span style="font-size:16px"><strong>Overview</strong></span></div>
<div style="text-align: justify;">The benchmark index further lost 70.09 points (or down -4.32%) to close at 1559.49 last month. The index has moved below the 50-day, as well as 200-day moving average, supporting the bearish sentiment in the market. The MACD, as well as the signal line continue to decline, where the MACD is moving below the signal line, giving a bearish signal. The RSI is hovering at 37.56 level, indicating a rise in selling pressure in the course of last month. The Bollinger bands show the market to be in an oversold zone. The bands also indicate low market volatility as the distance between the upper and lower bands remain narrow. The new support and resistance level stands at 1545 and 1645 respectively. </div>
<div style="text-align: justify;"> </div>
<div style="text-align: right;"><em>Disclaimer: This report has been prepared by Kriti Capital & Investments Ltd. on the basis of publicly available information and internal analysis of the market. The information contained herein does not purport to be comprehensive and is strictly for information purposes only.</em></div>
',
'status' => true,
'publish_date' => '0000-00-00',
'created' => '2017-07-08 15:31:08',
'modified' => '2017-07-12 09:11:12',
'keywords' => '',
'description' => '',
'sortorder' => '1796',
'feature_article' => true,
'user_id' => '11',
'image1' => null,
'image2' => null,
'image3' => null,
'image4' => null
),
'MagazineIssue' => array(
'id' => '975',
'image' => '20170707105833_cover.JPG',
'sortorder' => '1524',
'published' => true,
'created' => '2017-07-07 10:58:33',
'modified' => '2017-07-12 09:05:01',
'title' => 'July 2017',
'publish_date' => '2017-07-07',
'parent_id' => '0',
'homepage' => true,
'user_id' => '11'
),
'MagazineCategory' => array(
'id' => '63',
'title' => 'Stock Taking',
'sortorder' => '516',
'status' => true,
'created' => '0000-00-00 00:00:00',
'homepage' => true,
'modified' => '2013-04-01 00:00:00'
),
'User' => array(
'password' => '*****',
'id' => '11',
'user_detail_id' => '0',
'group_id' => '24',
'username' => 'nsingha@abhiyan.com.np',
'name' => '',
'email' => 'nsingha@abhiyan.com.np',
'address' => '',
'gender' => '',
'access' => '1',
'phone' => '',
'access_type' => '0',
'activated' => false,
'sortorder' => '0',
'published' => '0',
'created' => '2015-04-08 13:22:59',
'last_login' => '2023-04-16 09:29:47',
'ip' => '172.69.77.43'
),
'MagazineArticleComment' => array(),
'MagazineView' => array(
(int) 0 => array(
[maximum depth reached]
)
)
),
'current_user' => null,
'logged_in' => false
)
$magazineArticle = array(
'MagazineArticle' => array(
'id' => '1848',
'magazine_issue_id' => '975',
'magazine_category_id' => '63',
'title' => 'Monthly Technical Analysis of Nepse (28 May to 22 June 2017)',
'image' => null,
'short_content' => 'The benchmark index continued to fall in the course of last month. It declined by 70.09 points (or down -4.32%) last month to close at 1559.49. The index fell below the 50-day, as well as the 200-day moving average, giving a bearish signal.',
'content' => '<div style="text-align: justify;"><span style="font-size:22px"><strong>Continuing Decline</strong></span></div>
<div style="text-align: center;"><span style="font-size:22px"><strong><img alt="" src="/userfiles/images/Clipboard10%281%29.jpg" style="height:523px; width:800px" /></strong></span></div>
<div style="text-align: center;"><img alt="" src="/userfiles/images/Clipboard09%282%29.jpg" style="height:433px; width:800px" /></div>
<div style="text-align: justify;"> </div>
<div style="text-align: justify;"><span style="font-size:16px"><strong>Trend Analysis</strong></span></div>
<div style="text-align: justify;">The benchmark index continued to fall in the course of last month. It declined by 70.09 points (or down -4.32%) last month to close at 1559.49. The index fell below the 50-day, as well as the 200-day moving average, giving a bearish signal. Uncertain political environment has left the investors in a confused state. The average volume turnover decreased to NPR 63.81 crores from NPR 75.21 crores the month prior. </div>
<div style="text-align: justify;"> </div>
<div style="text-align: justify;"><span style="font-size:16px"><strong>Resistance and Support</strong></span></div>
<div style="text-align: justify;"> </div>
<div style="text-align: center;"><img alt="" src="/userfiles/images/Clipboard12%285%29.jpg" /></div>
<div style="text-align: justify;"> </div>
<div style="text-align: justify;">The benchmark index broke the support level of 1612 towards the middle of last month. Since then, the index has hovered around the late 1500’s level. The new support and resistance level now stands at 1545 and 1645. Possible successful completion of the second phase local election will boost investor confidence, which will cause the index to reach or breach the resistance level. </div>
<div style="text-align: justify;"> </div>
<div style="text-align: justify;"><span style="font-size:16px"><strong>Nepse Trend Indicator</strong></span></div>
<div style="text-align: justify;"><strong>a. MACD</strong></div>
<div style="text-align: justify;">The MACD is a momentum oscillator formed by using two different types of moving averages, which provides specific buying or selling signals. When a MACD line crosses above the signal line, it is considered to be a positive sign and indicates a time to buy, and vice-versa. </div>
<div style="text-align: justify;"> </div>
<div style="text-align: justify;">The MACD and the signal line, at the beginning of last month, stood at 4.20 and 13.35 respectively. In the course of the month, both macd and the signal line declined by 21.54 and 25.83 points to close at -17.34 and -12.48 respectively. The macd indicator continues to give a bearish signal as it is moving below the signal line. Likewise, both the lines have entered the negative territory, further supporting the bearish sign.</div>
<div style="text-align: justify;"> </div>
<div style="text-align: center;"><img alt="" src="/userfiles/images/Clipboard11%283%29.jpg" style="height:151px; width:800px" /></div>
<div style="text-align: center;"><img alt="" src="/userfiles/images/Clipboard13%283%29.jpg" style="height:145px; width:800px" /></div>
<div style="text-align: justify;"> </div>
<div style="text-align: justify;"><strong>b. RSI</strong></div>
<div style="text-align: justify;">RSI is a form of leading indicator that is believed to be most effective during periods of sideways movement. Such indicators may create numerous buy and sell signals that are useful when the market is not clearly trending upwards or downwards. </div>
<div style="text-align: justify;"> </div>
<div style="text-align: justify;">The RSI, at the beginning of last month, stood at 45.67 level. Towards the end of the month, it decreased by 8.12 points to close at 37.56 level. The RSI continues to decline, indicating an increase in selling pressure. The RSI level reaching below the 30 zone will signify oversold condition in the market.</div>
<div style="text-align: justify;"> </div>
<div style="text-align: justify;"><strong>c. Bollinger Bands</strong></div>
<div style="text-align: justify;">The Bollinger Band is a technical indicator that consists of a moving average (21-day) along with two trading bands above (upper band) and below it (lower band). The bands are an indication of volatility, which are represented by calculating standard deviation. </div>
<div style="text-align: justify;"> </div>
<div style="text-align: justify;">The benchmark index hovered close to the lower Bollinger band for majority of last month, indicating selling pressure in the market. </div>
<div style="text-align: justify;">The close distance between the upper and lower bands continues to signify low market volatility.</div>
<div style="text-align: center;"> </div>
<div style="text-align: center;"><img alt="" src="/userfiles/images/Clipboard14%285%29.jpg" style="height:368px; width:800px" /></div>
<div style="text-align: justify;"> </div>
<div style="text-align: justify;"><span style="font-size:16px"><strong>Overview</strong></span></div>
<div style="text-align: justify;">The benchmark index further lost 70.09 points (or down -4.32%) to close at 1559.49 last month. The index has moved below the 50-day, as well as 200-day moving average, supporting the bearish sentiment in the market. The MACD, as well as the signal line continue to decline, where the MACD is moving below the signal line, giving a bearish signal. The RSI is hovering at 37.56 level, indicating a rise in selling pressure in the course of last month. The Bollinger bands show the market to be in an oversold zone. The bands also indicate low market volatility as the distance between the upper and lower bands remain narrow. The new support and resistance level stands at 1545 and 1645 respectively. </div>
<div style="text-align: justify;"> </div>
<div style="text-align: right;"><em>Disclaimer: This report has been prepared by Kriti Capital & Investments Ltd. on the basis of publicly available information and internal analysis of the market. The information contained herein does not purport to be comprehensive and is strictly for information purposes only.</em></div>
',
'status' => true,
'publish_date' => '0000-00-00',
'created' => '2017-07-08 15:31:08',
'modified' => '2017-07-12 09:11:12',
'keywords' => '',
'description' => '',
'sortorder' => '1796',
'feature_article' => true,
'user_id' => '11',
'image1' => null,
'image2' => null,
'image3' => null,
'image4' => null
),
'MagazineIssue' => array(
'id' => '975',
'image' => '20170707105833_cover.JPG',
'sortorder' => '1524',
'published' => true,
'created' => '2017-07-07 10:58:33',
'modified' => '2017-07-12 09:05:01',
'title' => 'July 2017',
'publish_date' => '2017-07-07',
'parent_id' => '0',
'homepage' => true,
'user_id' => '11'
),
'MagazineCategory' => array(
'id' => '63',
'title' => 'Stock Taking',
'sortorder' => '516',
'status' => true,
'created' => '0000-00-00 00:00:00',
'homepage' => true,
'modified' => '2013-04-01 00:00:00'
),
'User' => array(
'password' => '*****',
'id' => '11',
'user_detail_id' => '0',
'group_id' => '24',
'username' => 'nsingha@abhiyan.com.np',
'name' => '',
'email' => 'nsingha@abhiyan.com.np',
'address' => '',
'gender' => '',
'access' => '1',
'phone' => '',
'access_type' => '0',
'activated' => false,
'sortorder' => '0',
'published' => '0',
'created' => '2015-04-08 13:22:59',
'last_login' => '2023-04-16 09:29:47',
'ip' => '172.69.77.43'
),
'MagazineArticleComment' => array(),
'MagazineView' => array(
(int) 0 => array(
'magazine_article_id' => '1848',
'hit' => '3578'
)
)
)
$current_user = null
$logged_in = false
$user = null
$groupId = null
$user_id = null
include - APP/View/MagazineArticles/view.ctp, line 62
View::_evaluate() - CORE/Cake/View/View.php, line 971
View::_render() - CORE/Cake/View/View.php, line 933
View::render() - CORE/Cake/View/View.php, line 473
Controller::render() - CORE/Cake/Controller/Controller.php, line 968
Dispatcher::_invoke() - CORE/Cake/Routing/Dispatcher.php, line 200
Dispatcher::dispatch() - CORE/Cake/Routing/Dispatcher.php, line 167
[main] - APP/webroot/index.php, line 117
Notice (8): Undefined index: summary [APP/View/MagazineArticles/view.ctp, line 68]Code Context echo $this->Html->meta(array('property' => 'og:title', 'type' => 'meta', 'content' => $magazineArticle['MagazineArticle']['title']), null, array('inline' => false));?>
<?php
echo $this->Html->meta(array('property' => 'og:description', 'type' => 'meta', 'content' => $magazineArticle['MagazineArticle']['summary']), null, array('inline' => false));?>
$viewFile = '/var/www/html/newbusinessage.com/app/View/MagazineArticles/view.ctp'
$dataForView = array(
'magazineArticle' => array(
'MagazineArticle' => array(
'id' => '1848',
'magazine_issue_id' => '975',
'magazine_category_id' => '63',
'title' => 'Monthly Technical Analysis of Nepse (28 May to 22 June 2017)',
'image' => null,
'short_content' => 'The benchmark index continued to fall in the course of last month. It declined by 70.09 points (or down -4.32%) last month to close at 1559.49. The index fell below the 50-day, as well as the 200-day moving average, giving a bearish signal.',
'content' => '<div style="text-align: justify;"><span style="font-size:22px"><strong>Continuing Decline</strong></span></div>
<div style="text-align: center;"><span style="font-size:22px"><strong><img alt="" src="/userfiles/images/Clipboard10%281%29.jpg" style="height:523px; width:800px" /></strong></span></div>
<div style="text-align: center;"><img alt="" src="/userfiles/images/Clipboard09%282%29.jpg" style="height:433px; width:800px" /></div>
<div style="text-align: justify;"> </div>
<div style="text-align: justify;"><span style="font-size:16px"><strong>Trend Analysis</strong></span></div>
<div style="text-align: justify;">The benchmark index continued to fall in the course of last month. It declined by 70.09 points (or down -4.32%) last month to close at 1559.49. The index fell below the 50-day, as well as the 200-day moving average, giving a bearish signal. Uncertain political environment has left the investors in a confused state. The average volume turnover decreased to NPR 63.81 crores from NPR 75.21 crores the month prior. </div>
<div style="text-align: justify;"> </div>
<div style="text-align: justify;"><span style="font-size:16px"><strong>Resistance and Support</strong></span></div>
<div style="text-align: justify;"> </div>
<div style="text-align: center;"><img alt="" src="/userfiles/images/Clipboard12%285%29.jpg" /></div>
<div style="text-align: justify;"> </div>
<div style="text-align: justify;">The benchmark index broke the support level of 1612 towards the middle of last month. Since then, the index has hovered around the late 1500’s level. The new support and resistance level now stands at 1545 and 1645. Possible successful completion of the second phase local election will boost investor confidence, which will cause the index to reach or breach the resistance level. </div>
<div style="text-align: justify;"> </div>
<div style="text-align: justify;"><span style="font-size:16px"><strong>Nepse Trend Indicator</strong></span></div>
<div style="text-align: justify;"><strong>a. MACD</strong></div>
<div style="text-align: justify;">The MACD is a momentum oscillator formed by using two different types of moving averages, which provides specific buying or selling signals. When a MACD line crosses above the signal line, it is considered to be a positive sign and indicates a time to buy, and vice-versa. </div>
<div style="text-align: justify;"> </div>
<div style="text-align: justify;">The MACD and the signal line, at the beginning of last month, stood at 4.20 and 13.35 respectively. In the course of the month, both macd and the signal line declined by 21.54 and 25.83 points to close at -17.34 and -12.48 respectively. The macd indicator continues to give a bearish signal as it is moving below the signal line. Likewise, both the lines have entered the negative territory, further supporting the bearish sign.</div>
<div style="text-align: justify;"> </div>
<div style="text-align: center;"><img alt="" src="/userfiles/images/Clipboard11%283%29.jpg" style="height:151px; width:800px" /></div>
<div style="text-align: center;"><img alt="" src="/userfiles/images/Clipboard13%283%29.jpg" style="height:145px; width:800px" /></div>
<div style="text-align: justify;"> </div>
<div style="text-align: justify;"><strong>b. RSI</strong></div>
<div style="text-align: justify;">RSI is a form of leading indicator that is believed to be most effective during periods of sideways movement. Such indicators may create numerous buy and sell signals that are useful when the market is not clearly trending upwards or downwards. </div>
<div style="text-align: justify;"> </div>
<div style="text-align: justify;">The RSI, at the beginning of last month, stood at 45.67 level. Towards the end of the month, it decreased by 8.12 points to close at 37.56 level. The RSI continues to decline, indicating an increase in selling pressure. The RSI level reaching below the 30 zone will signify oversold condition in the market.</div>
<div style="text-align: justify;"> </div>
<div style="text-align: justify;"><strong>c. Bollinger Bands</strong></div>
<div style="text-align: justify;">The Bollinger Band is a technical indicator that consists of a moving average (21-day) along with two trading bands above (upper band) and below it (lower band). The bands are an indication of volatility, which are represented by calculating standard deviation. </div>
<div style="text-align: justify;"> </div>
<div style="text-align: justify;">The benchmark index hovered close to the lower Bollinger band for majority of last month, indicating selling pressure in the market. </div>
<div style="text-align: justify;">The close distance between the upper and lower bands continues to signify low market volatility.</div>
<div style="text-align: center;"> </div>
<div style="text-align: center;"><img alt="" src="/userfiles/images/Clipboard14%285%29.jpg" style="height:368px; width:800px" /></div>
<div style="text-align: justify;"> </div>
<div style="text-align: justify;"><span style="font-size:16px"><strong>Overview</strong></span></div>
<div style="text-align: justify;">The benchmark index further lost 70.09 points (or down -4.32%) to close at 1559.49 last month. The index has moved below the 50-day, as well as 200-day moving average, supporting the bearish sentiment in the market. The MACD, as well as the signal line continue to decline, where the MACD is moving below the signal line, giving a bearish signal. The RSI is hovering at 37.56 level, indicating a rise in selling pressure in the course of last month. The Bollinger bands show the market to be in an oversold zone. The bands also indicate low market volatility as the distance between the upper and lower bands remain narrow. The new support and resistance level stands at 1545 and 1645 respectively. </div>
<div style="text-align: justify;"> </div>
<div style="text-align: right;"><em>Disclaimer: This report has been prepared by Kriti Capital & Investments Ltd. on the basis of publicly available information and internal analysis of the market. The information contained herein does not purport to be comprehensive and is strictly for information purposes only.</em></div>
',
'status' => true,
'publish_date' => '0000-00-00',
'created' => '2017-07-08 15:31:08',
'modified' => '2017-07-12 09:11:12',
'keywords' => '',
'description' => '',
'sortorder' => '1796',
'feature_article' => true,
'user_id' => '11',
'image1' => null,
'image2' => null,
'image3' => null,
'image4' => null
),
'MagazineIssue' => array(
'id' => '975',
'image' => '20170707105833_cover.JPG',
'sortorder' => '1524',
'published' => true,
'created' => '2017-07-07 10:58:33',
'modified' => '2017-07-12 09:05:01',
'title' => 'July 2017',
'publish_date' => '2017-07-07',
'parent_id' => '0',
'homepage' => true,
'user_id' => '11'
),
'MagazineCategory' => array(
'id' => '63',
'title' => 'Stock Taking',
'sortorder' => '516',
'status' => true,
'created' => '0000-00-00 00:00:00',
'homepage' => true,
'modified' => '2013-04-01 00:00:00'
),
'User' => array(
'password' => '*****',
'id' => '11',
'user_detail_id' => '0',
'group_id' => '24',
'username' => 'nsingha@abhiyan.com.np',
'name' => '',
'email' => 'nsingha@abhiyan.com.np',
'address' => '',
'gender' => '',
'access' => '1',
'phone' => '',
'access_type' => '0',
'activated' => false,
'sortorder' => '0',
'published' => '0',
'created' => '2015-04-08 13:22:59',
'last_login' => '2023-04-16 09:29:47',
'ip' => '172.69.77.43'
),
'MagazineArticleComment' => array(),
'MagazineView' => array(
(int) 0 => array(
[maximum depth reached]
)
)
),
'current_user' => null,
'logged_in' => false
)
$magazineArticle = array(
'MagazineArticle' => array(
'id' => '1848',
'magazine_issue_id' => '975',
'magazine_category_id' => '63',
'title' => 'Monthly Technical Analysis of Nepse (28 May to 22 June 2017)',
'image' => null,
'short_content' => 'The benchmark index continued to fall in the course of last month. It declined by 70.09 points (or down -4.32%) last month to close at 1559.49. The index fell below the 50-day, as well as the 200-day moving average, giving a bearish signal.',
'content' => '<div style="text-align: justify;"><span style="font-size:22px"><strong>Continuing Decline</strong></span></div>
<div style="text-align: center;"><span style="font-size:22px"><strong><img alt="" src="/userfiles/images/Clipboard10%281%29.jpg" style="height:523px; width:800px" /></strong></span></div>
<div style="text-align: center;"><img alt="" src="/userfiles/images/Clipboard09%282%29.jpg" style="height:433px; width:800px" /></div>
<div style="text-align: justify;"> </div>
<div style="text-align: justify;"><span style="font-size:16px"><strong>Trend Analysis</strong></span></div>
<div style="text-align: justify;">The benchmark index continued to fall in the course of last month. It declined by 70.09 points (or down -4.32%) last month to close at 1559.49. The index fell below the 50-day, as well as the 200-day moving average, giving a bearish signal. Uncertain political environment has left the investors in a confused state. The average volume turnover decreased to NPR 63.81 crores from NPR 75.21 crores the month prior. </div>
<div style="text-align: justify;"> </div>
<div style="text-align: justify;"><span style="font-size:16px"><strong>Resistance and Support</strong></span></div>
<div style="text-align: justify;"> </div>
<div style="text-align: center;"><img alt="" src="/userfiles/images/Clipboard12%285%29.jpg" /></div>
<div style="text-align: justify;"> </div>
<div style="text-align: justify;">The benchmark index broke the support level of 1612 towards the middle of last month. Since then, the index has hovered around the late 1500’s level. The new support and resistance level now stands at 1545 and 1645. Possible successful completion of the second phase local election will boost investor confidence, which will cause the index to reach or breach the resistance level. </div>
<div style="text-align: justify;"> </div>
<div style="text-align: justify;"><span style="font-size:16px"><strong>Nepse Trend Indicator</strong></span></div>
<div style="text-align: justify;"><strong>a. MACD</strong></div>
<div style="text-align: justify;">The MACD is a momentum oscillator formed by using two different types of moving averages, which provides specific buying or selling signals. When a MACD line crosses above the signal line, it is considered to be a positive sign and indicates a time to buy, and vice-versa. </div>
<div style="text-align: justify;"> </div>
<div style="text-align: justify;">The MACD and the signal line, at the beginning of last month, stood at 4.20 and 13.35 respectively. In the course of the month, both macd and the signal line declined by 21.54 and 25.83 points to close at -17.34 and -12.48 respectively. The macd indicator continues to give a bearish signal as it is moving below the signal line. Likewise, both the lines have entered the negative territory, further supporting the bearish sign.</div>
<div style="text-align: justify;"> </div>
<div style="text-align: center;"><img alt="" src="/userfiles/images/Clipboard11%283%29.jpg" style="height:151px; width:800px" /></div>
<div style="text-align: center;"><img alt="" src="/userfiles/images/Clipboard13%283%29.jpg" style="height:145px; width:800px" /></div>
<div style="text-align: justify;"> </div>
<div style="text-align: justify;"><strong>b. RSI</strong></div>
<div style="text-align: justify;">RSI is a form of leading indicator that is believed to be most effective during periods of sideways movement. Such indicators may create numerous buy and sell signals that are useful when the market is not clearly trending upwards or downwards. </div>
<div style="text-align: justify;"> </div>
<div style="text-align: justify;">The RSI, at the beginning of last month, stood at 45.67 level. Towards the end of the month, it decreased by 8.12 points to close at 37.56 level. The RSI continues to decline, indicating an increase in selling pressure. The RSI level reaching below the 30 zone will signify oversold condition in the market.</div>
<div style="text-align: justify;"> </div>
<div style="text-align: justify;"><strong>c. Bollinger Bands</strong></div>
<div style="text-align: justify;">The Bollinger Band is a technical indicator that consists of a moving average (21-day) along with two trading bands above (upper band) and below it (lower band). The bands are an indication of volatility, which are represented by calculating standard deviation. </div>
<div style="text-align: justify;"> </div>
<div style="text-align: justify;">The benchmark index hovered close to the lower Bollinger band for majority of last month, indicating selling pressure in the market. </div>
<div style="text-align: justify;">The close distance between the upper and lower bands continues to signify low market volatility.</div>
<div style="text-align: center;"> </div>
<div style="text-align: center;"><img alt="" src="/userfiles/images/Clipboard14%285%29.jpg" style="height:368px; width:800px" /></div>
<div style="text-align: justify;"> </div>
<div style="text-align: justify;"><span style="font-size:16px"><strong>Overview</strong></span></div>
<div style="text-align: justify;">The benchmark index further lost 70.09 points (or down -4.32%) to close at 1559.49 last month. The index has moved below the 50-day, as well as 200-day moving average, supporting the bearish sentiment in the market. The MACD, as well as the signal line continue to decline, where the MACD is moving below the signal line, giving a bearish signal. The RSI is hovering at 37.56 level, indicating a rise in selling pressure in the course of last month. The Bollinger bands show the market to be in an oversold zone. The bands also indicate low market volatility as the distance between the upper and lower bands remain narrow. The new support and resistance level stands at 1545 and 1645 respectively. </div>
<div style="text-align: justify;"> </div>
<div style="text-align: right;"><em>Disclaimer: This report has been prepared by Kriti Capital & Investments Ltd. on the basis of publicly available information and internal analysis of the market. The information contained herein does not purport to be comprehensive and is strictly for information purposes only.</em></div>
',
'status' => true,
'publish_date' => '0000-00-00',
'created' => '2017-07-08 15:31:08',
'modified' => '2017-07-12 09:11:12',
'keywords' => '',
'description' => '',
'sortorder' => '1796',
'feature_article' => true,
'user_id' => '11',
'image1' => null,
'image2' => null,
'image3' => null,
'image4' => null
),
'MagazineIssue' => array(
'id' => '975',
'image' => '20170707105833_cover.JPG',
'sortorder' => '1524',
'published' => true,
'created' => '2017-07-07 10:58:33',
'modified' => '2017-07-12 09:05:01',
'title' => 'July 2017',
'publish_date' => '2017-07-07',
'parent_id' => '0',
'homepage' => true,
'user_id' => '11'
),
'MagazineCategory' => array(
'id' => '63',
'title' => 'Stock Taking',
'sortorder' => '516',
'status' => true,
'created' => '0000-00-00 00:00:00',
'homepage' => true,
'modified' => '2013-04-01 00:00:00'
),
'User' => array(
'password' => '*****',
'id' => '11',
'user_detail_id' => '0',
'group_id' => '24',
'username' => 'nsingha@abhiyan.com.np',
'name' => '',
'email' => 'nsingha@abhiyan.com.np',
'address' => '',
'gender' => '',
'access' => '1',
'phone' => '',
'access_type' => '0',
'activated' => false,
'sortorder' => '0',
'published' => '0',
'created' => '2015-04-08 13:22:59',
'last_login' => '2023-04-16 09:29:47',
'ip' => '172.69.77.43'
),
'MagazineArticleComment' => array(),
'MagazineView' => array(
(int) 0 => array(
'magazine_article_id' => '1848',
'hit' => '3578'
)
)
)
$current_user = null
$logged_in = false
$user = null
$groupId = null
$user_id = null
include - APP/View/MagazineArticles/view.ctp, line 68
View::_evaluate() - CORE/Cake/View/View.php, line 971
View::_render() - CORE/Cake/View/View.php, line 933
View::render() - CORE/Cake/View/View.php, line 473
Controller::render() - CORE/Cake/Controller/Controller.php, line 968
Dispatcher::_invoke() - CORE/Cake/Routing/Dispatcher.php, line 200
Dispatcher::dispatch() - CORE/Cake/Routing/Dispatcher.php, line 167
[main] - APP/webroot/index.php, line 117
Monthly Technical Analysis of Nepse (28 May to 22 June 2017)
Continuing Decline
Trend Analysis
The benchmark index continued to fall in the course of last month. It declined by 70.09 points (or down -4.32%) last month to close at 1559.49. The index fell below the 50-day, as well as the 200-day moving average, giving a bearish signal. Uncertain political environment has left the investors in a confused state. The average volume turnover decreased to NPR 63.81 crores from NPR 75.21 crores the month prior.
Resistance and Support
The benchmark index broke the support level of 1612 towards the middle of last month. Since then, the index has hovered around the late 1500’s level. The new support and resistance level now stands at 1545 and 1645. Possible successful completion of the second phase local election will boost investor confidence, which will cause the index to reach or breach the resistance level.
Nepse Trend Indicator
a. MACD
The MACD is a momentum oscillator formed by using two different types of moving averages, which provides specific buying or selling signals. When a MACD line crosses above the signal line, it is considered to be a positive sign and indicates a time to buy, and vice-versa.
The MACD and the signal line, at the beginning of last month, stood at 4.20 and 13.35 respectively. In the course of the month, both macd and the signal line declined by 21.54 and 25.83 points to close at -17.34 and -12.48 respectively. The macd indicator continues to give a bearish signal as it is moving below the signal line. Likewise, both the lines have entered the negative territory, further supporting the bearish sign.
b. RSI
RSI is a form of leading indicator that is believed to be most effective during periods of sideways movement. Such indicators may create numerous buy and sell signals that are useful when the market is not clearly trending upwards or downwards.
The RSI, at the beginning of last month, stood at 45.67 level. Towards the end of the month, it decreased by 8.12 points to close at 37.56 level. The RSI continues to decline, indicating an increase in selling pressure. The RSI level reaching below the 30 zone will signify oversold condition in the market.
c. Bollinger Bands
The Bollinger Band is a technical indicator that consists of a moving average (21-day) along with two trading bands above (upper band) and below it (lower band). The bands are an indication of volatility, which are represented by calculating standard deviation.
The benchmark index hovered close to the lower Bollinger band for majority of last month, indicating selling pressure in the market.
The close distance between the upper and lower bands continues to signify low market volatility.
Overview
The benchmark index further lost 70.09 points (or down -4.32%) to close at 1559.49 last month. The index has moved below the 50-day, as well as 200-day moving average, supporting the bearish sentiment in the market. The MACD, as well as the signal line continue to decline, where the MACD is moving below the signal line, giving a bearish signal. The RSI is hovering at 37.56 level, indicating a rise in selling pressure in the course of last month. The Bollinger bands show the market to be in an oversold zone. The bands also indicate low market volatility as the distance between the upper and lower bands remain narrow. The new support and resistance level stands at 1545 and 1645 respectively.
Disclaimer: This report has been prepared by Kriti Capital & Investments Ltd. on the basis of publicly available information and internal analysis of the market. The information contained herein does not purport to be comprehensive and is strictly for information purposes only.