Notice (8): Trying to access array offset on value of type null [APP/View/MagazineArticles/view.ctp, line 54]Code Context $user = $this->Session->read('Auth.User');
//find the group of logged user
$groupId = $user['Group']['id'];
$viewFile = '/var/www/html/newbusinessage.com/app/View/MagazineArticles/view.ctp'
$dataForView = array(
'magazineArticle' => array(
'MagazineArticle' => array(
'id' => '2171',
'magazine_issue_id' => '987',
'magazine_category_id' => '63',
'title' => 'Monthly Technical Analysis of Nepse (May25th 2018 - June 21th 2018)',
'image' => null,
'short_content' => 'The benchmark index declined in the course of last month. Nepse decreased by 99.76 points (or down 7.57%) to close at 1218.46. The index breached 50-day moving average and still trading below 200-day moving average indicating bearish momentum in the market. ',
'content' => '<p style="text-align:justify"><span style="font-size:20px"><strong>Bearish & Volatile</strong></span></p>
<p style="text-align:center"><span style="font-size:20px"><strong><img alt="" src="/userfiles/images/Clipboard23%287%29.jpg" /></strong></span></p>
<p style="text-align:center"><img alt="" src="/userfiles/images/Clipboard21%286%29.jpg" /></p>
<p style="text-align:justify"><span style="font-size:16px"><strong>Trend Analysis</strong></span><br />
The benchmark index declined in the course of last month. Nepse decreased by 99.76 points (or down 7.57%) to close at 1218.46. The index breached 50-day moving average and still trading below 200-day moving average indicating bearish momentum in the market. The average volume turnover decreased to NPR 34.79 crores from NPR 40.8 crores the month prior.</p>
<p style="text-align:justify"><span style="font-size:16px"><strong>Resistance and Support</strong></span></p>
<p style="text-align:center"><span style="font-size:16px"><strong><img alt="" src="/userfiles/images/Clipboard22%285%29.jpg" /></strong></span></p>
<p style="text-align:justify">The Nepse index has declined from 1318.22 to 1218.46 in the course of last month. It has breached support level of 1305. Such movement indicates a bearish momentum in the market. The immediate support and resistance has changed to 1170 and 1305 respectively.</p>
<p style="text-align:justify"><span style="font-size:16px"><strong>Nepse Trend Indicator</strong></span><br />
<strong>a. MACD</strong><br />
The MACD is a momentum oscillator formed by using two different types of moving averages, which provides specific buying or selling signals. When a MACD line crosses above the signal line, it is considered to be a positive sign and indicates a time to buy, and vice-versa.</p>
<p style="text-align:justify">The MACD and the signal line, at the beginning of last month, stood at 1.38 and 7.44 respectively. By the end of the month, the macd and the signal line decreased by 28.57 and 31.06 points to close at -27.19 and -23.63 respectively. The macd line and signal line have entered into the negative territory indicating a bearish momentum in the market.</p>
<p style="text-align:center"><img alt="" src="/userfiles/images/Clipboard24%2810%29.jpg" /></p>
<p style="text-align:justify"><strong>b. RSI</strong><br />
RSI is a form of leading indicator that is believed to be most effective during periods of sideways movement. Such indicators may create numerous buy and sell signals that are useful when the market is not clearly trending upwards or downwards.</p>
<p style="text-align:justify">The RSI, at the beginning of last month, stood at 43.67 levels. In the course of the month, it lost 13.18 points to close at 30.49 levels. The RSI falling at 30s zone indicates a rise in selling pressure in the market.</p>
<p style="text-align:center"><img alt="" src="/userfiles/images/Clipboard26%284%29.jpg" style="height:157px; width:800px" /></p>
<p style="text-align:justify"><strong>c. Bollinger Bands</strong><br />
The Bollinger Band is a technical indicator that consists of a moving average (21-day) along with two trading bands above (upper band) and below it (lower band). The bands are an indication of volatility, which are represented by calculating standard deviation. The benchmark index moved down towards the lower Bollinger band in the course of last month. Such indication shows an increase in selling pressure in the market. The distance between the upper and lower bands has increased significantly indicating a rise in market volatility.</p>
<p style="text-align:center"><img alt="" src="/userfiles/images/Clipboard27%284%29.jpg" /></p>
<p style="text-align:justify"><span style="font-size:16px"><strong>Overview</strong></span><br />
The benchmark index decreased by 99.76 points (or down 7.57%) to close at 1218.46 last month. The index breached 50-day moving average and still trading below 200-day moving average indicating bearish momentum in the market. The macd line and signal line have entered into the negative territory indicating a bearish momentum in the market. The RSI closed at 30.49 levels, indicating a rise in the selling pressure in the market. The Bollinger bands indicate an increase in market volatility due to increase in the distance between upper and lower bands. The support and resistance level stands at 1170 and 1305 level respectively. </p>
',
'status' => true,
'publish_date' => '0000-00-00',
'created' => '2018-07-05 11:09:50',
'modified' => '2018-07-11 10:17:16',
'keywords' => '',
'description' => '',
'sortorder' => '2128',
'feature_article' => true,
'user_id' => '11',
'image1' => null,
'image2' => null,
'image3' => null,
'image4' => null
),
'MagazineIssue' => array(
'id' => '987',
'image' => '20180705101232_cover.JPG',
'sortorder' => '1536',
'published' => true,
'created' => '2018-07-05 10:12:32',
'modified' => '2018-07-11 10:04:04',
'title' => 'July 2018',
'publish_date' => '2018-07-01',
'parent_id' => '0',
'homepage' => true,
'user_id' => '11'
),
'MagazineCategory' => array(
'id' => '63',
'title' => 'Stock Taking',
'sortorder' => '516',
'status' => true,
'created' => '0000-00-00 00:00:00',
'homepage' => true,
'modified' => '2013-04-01 00:00:00'
),
'User' => array(
'password' => '*****',
'id' => '11',
'user_detail_id' => '0',
'group_id' => '24',
'username' => 'nsingha@abhiyan.com.np',
'name' => '',
'email' => 'nsingha@abhiyan.com.np',
'address' => '',
'gender' => '',
'access' => '1',
'phone' => '',
'access_type' => '0',
'activated' => false,
'sortorder' => '0',
'published' => '0',
'created' => '2015-04-08 13:22:59',
'last_login' => '2023-04-16 09:29:47',
'ip' => '172.69.77.43'
),
'MagazineArticleComment' => array(),
'MagazineView' => array(
(int) 0 => array(
[maximum depth reached]
)
)
),
'current_user' => null,
'logged_in' => false
)
$magazineArticle = array(
'MagazineArticle' => array(
'id' => '2171',
'magazine_issue_id' => '987',
'magazine_category_id' => '63',
'title' => 'Monthly Technical Analysis of Nepse (May25th 2018 - June 21th 2018)',
'image' => null,
'short_content' => 'The benchmark index declined in the course of last month. Nepse decreased by 99.76 points (or down 7.57%) to close at 1218.46. The index breached 50-day moving average and still trading below 200-day moving average indicating bearish momentum in the market. ',
'content' => '<p style="text-align:justify"><span style="font-size:20px"><strong>Bearish & Volatile</strong></span></p>
<p style="text-align:center"><span style="font-size:20px"><strong><img alt="" src="/userfiles/images/Clipboard23%287%29.jpg" /></strong></span></p>
<p style="text-align:center"><img alt="" src="/userfiles/images/Clipboard21%286%29.jpg" /></p>
<p style="text-align:justify"><span style="font-size:16px"><strong>Trend Analysis</strong></span><br />
The benchmark index declined in the course of last month. Nepse decreased by 99.76 points (or down 7.57%) to close at 1218.46. The index breached 50-day moving average and still trading below 200-day moving average indicating bearish momentum in the market. The average volume turnover decreased to NPR 34.79 crores from NPR 40.8 crores the month prior.</p>
<p style="text-align:justify"><span style="font-size:16px"><strong>Resistance and Support</strong></span></p>
<p style="text-align:center"><span style="font-size:16px"><strong><img alt="" src="/userfiles/images/Clipboard22%285%29.jpg" /></strong></span></p>
<p style="text-align:justify">The Nepse index has declined from 1318.22 to 1218.46 in the course of last month. It has breached support level of 1305. Such movement indicates a bearish momentum in the market. The immediate support and resistance has changed to 1170 and 1305 respectively.</p>
<p style="text-align:justify"><span style="font-size:16px"><strong>Nepse Trend Indicator</strong></span><br />
<strong>a. MACD</strong><br />
The MACD is a momentum oscillator formed by using two different types of moving averages, which provides specific buying or selling signals. When a MACD line crosses above the signal line, it is considered to be a positive sign and indicates a time to buy, and vice-versa.</p>
<p style="text-align:justify">The MACD and the signal line, at the beginning of last month, stood at 1.38 and 7.44 respectively. By the end of the month, the macd and the signal line decreased by 28.57 and 31.06 points to close at -27.19 and -23.63 respectively. The macd line and signal line have entered into the negative territory indicating a bearish momentum in the market.</p>
<p style="text-align:center"><img alt="" src="/userfiles/images/Clipboard24%2810%29.jpg" /></p>
<p style="text-align:justify"><strong>b. RSI</strong><br />
RSI is a form of leading indicator that is believed to be most effective during periods of sideways movement. Such indicators may create numerous buy and sell signals that are useful when the market is not clearly trending upwards or downwards.</p>
<p style="text-align:justify">The RSI, at the beginning of last month, stood at 43.67 levels. In the course of the month, it lost 13.18 points to close at 30.49 levels. The RSI falling at 30s zone indicates a rise in selling pressure in the market.</p>
<p style="text-align:center"><img alt="" src="/userfiles/images/Clipboard26%284%29.jpg" style="height:157px; width:800px" /></p>
<p style="text-align:justify"><strong>c. Bollinger Bands</strong><br />
The Bollinger Band is a technical indicator that consists of a moving average (21-day) along with two trading bands above (upper band) and below it (lower band). The bands are an indication of volatility, which are represented by calculating standard deviation. The benchmark index moved down towards the lower Bollinger band in the course of last month. Such indication shows an increase in selling pressure in the market. The distance between the upper and lower bands has increased significantly indicating a rise in market volatility.</p>
<p style="text-align:center"><img alt="" src="/userfiles/images/Clipboard27%284%29.jpg" /></p>
<p style="text-align:justify"><span style="font-size:16px"><strong>Overview</strong></span><br />
The benchmark index decreased by 99.76 points (or down 7.57%) to close at 1218.46 last month. The index breached 50-day moving average and still trading below 200-day moving average indicating bearish momentum in the market. The macd line and signal line have entered into the negative territory indicating a bearish momentum in the market. The RSI closed at 30.49 levels, indicating a rise in the selling pressure in the market. The Bollinger bands indicate an increase in market volatility due to increase in the distance between upper and lower bands. The support and resistance level stands at 1170 and 1305 level respectively. </p>
',
'status' => true,
'publish_date' => '0000-00-00',
'created' => '2018-07-05 11:09:50',
'modified' => '2018-07-11 10:17:16',
'keywords' => '',
'description' => '',
'sortorder' => '2128',
'feature_article' => true,
'user_id' => '11',
'image1' => null,
'image2' => null,
'image3' => null,
'image4' => null
),
'MagazineIssue' => array(
'id' => '987',
'image' => '20180705101232_cover.JPG',
'sortorder' => '1536',
'published' => true,
'created' => '2018-07-05 10:12:32',
'modified' => '2018-07-11 10:04:04',
'title' => 'July 2018',
'publish_date' => '2018-07-01',
'parent_id' => '0',
'homepage' => true,
'user_id' => '11'
),
'MagazineCategory' => array(
'id' => '63',
'title' => 'Stock Taking',
'sortorder' => '516',
'status' => true,
'created' => '0000-00-00 00:00:00',
'homepage' => true,
'modified' => '2013-04-01 00:00:00'
),
'User' => array(
'password' => '*****',
'id' => '11',
'user_detail_id' => '0',
'group_id' => '24',
'username' => 'nsingha@abhiyan.com.np',
'name' => '',
'email' => 'nsingha@abhiyan.com.np',
'address' => '',
'gender' => '',
'access' => '1',
'phone' => '',
'access_type' => '0',
'activated' => false,
'sortorder' => '0',
'published' => '0',
'created' => '2015-04-08 13:22:59',
'last_login' => '2023-04-16 09:29:47',
'ip' => '172.69.77.43'
),
'MagazineArticleComment' => array(),
'MagazineView' => array(
(int) 0 => array(
'magazine_article_id' => '2171',
'hit' => '3740'
)
)
)
$current_user = null
$logged_in = false
$user = null
include - APP/View/MagazineArticles/view.ctp, line 54
View::_evaluate() - CORE/Cake/View/View.php, line 971
View::_render() - CORE/Cake/View/View.php, line 933
View::render() - CORE/Cake/View/View.php, line 473
Controller::render() - CORE/Cake/Controller/Controller.php, line 968
Dispatcher::_invoke() - CORE/Cake/Routing/Dispatcher.php, line 200
Dispatcher::dispatch() - CORE/Cake/Routing/Dispatcher.php, line 167
[main] - APP/webroot/index.php, line 117
Notice (8): Trying to access array offset on value of type null [APP/View/MagazineArticles/view.ctp, line 55]Code Context //find the group of logged user
$groupId = $user['Group']['id'];
$user_id=$user["id"];
$viewFile = '/var/www/html/newbusinessage.com/app/View/MagazineArticles/view.ctp'
$dataForView = array(
'magazineArticle' => array(
'MagazineArticle' => array(
'id' => '2171',
'magazine_issue_id' => '987',
'magazine_category_id' => '63',
'title' => 'Monthly Technical Analysis of Nepse (May25th 2018 - June 21th 2018)',
'image' => null,
'short_content' => 'The benchmark index declined in the course of last month. Nepse decreased by 99.76 points (or down 7.57%) to close at 1218.46. The index breached 50-day moving average and still trading below 200-day moving average indicating bearish momentum in the market. ',
'content' => '<p style="text-align:justify"><span style="font-size:20px"><strong>Bearish & Volatile</strong></span></p>
<p style="text-align:center"><span style="font-size:20px"><strong><img alt="" src="/userfiles/images/Clipboard23%287%29.jpg" /></strong></span></p>
<p style="text-align:center"><img alt="" src="/userfiles/images/Clipboard21%286%29.jpg" /></p>
<p style="text-align:justify"><span style="font-size:16px"><strong>Trend Analysis</strong></span><br />
The benchmark index declined in the course of last month. Nepse decreased by 99.76 points (or down 7.57%) to close at 1218.46. The index breached 50-day moving average and still trading below 200-day moving average indicating bearish momentum in the market. The average volume turnover decreased to NPR 34.79 crores from NPR 40.8 crores the month prior.</p>
<p style="text-align:justify"><span style="font-size:16px"><strong>Resistance and Support</strong></span></p>
<p style="text-align:center"><span style="font-size:16px"><strong><img alt="" src="/userfiles/images/Clipboard22%285%29.jpg" /></strong></span></p>
<p style="text-align:justify">The Nepse index has declined from 1318.22 to 1218.46 in the course of last month. It has breached support level of 1305. Such movement indicates a bearish momentum in the market. The immediate support and resistance has changed to 1170 and 1305 respectively.</p>
<p style="text-align:justify"><span style="font-size:16px"><strong>Nepse Trend Indicator</strong></span><br />
<strong>a. MACD</strong><br />
The MACD is a momentum oscillator formed by using two different types of moving averages, which provides specific buying or selling signals. When a MACD line crosses above the signal line, it is considered to be a positive sign and indicates a time to buy, and vice-versa.</p>
<p style="text-align:justify">The MACD and the signal line, at the beginning of last month, stood at 1.38 and 7.44 respectively. By the end of the month, the macd and the signal line decreased by 28.57 and 31.06 points to close at -27.19 and -23.63 respectively. The macd line and signal line have entered into the negative territory indicating a bearish momentum in the market.</p>
<p style="text-align:center"><img alt="" src="/userfiles/images/Clipboard24%2810%29.jpg" /></p>
<p style="text-align:justify"><strong>b. RSI</strong><br />
RSI is a form of leading indicator that is believed to be most effective during periods of sideways movement. Such indicators may create numerous buy and sell signals that are useful when the market is not clearly trending upwards or downwards.</p>
<p style="text-align:justify">The RSI, at the beginning of last month, stood at 43.67 levels. In the course of the month, it lost 13.18 points to close at 30.49 levels. The RSI falling at 30s zone indicates a rise in selling pressure in the market.</p>
<p style="text-align:center"><img alt="" src="/userfiles/images/Clipboard26%284%29.jpg" style="height:157px; width:800px" /></p>
<p style="text-align:justify"><strong>c. Bollinger Bands</strong><br />
The Bollinger Band is a technical indicator that consists of a moving average (21-day) along with two trading bands above (upper band) and below it (lower band). The bands are an indication of volatility, which are represented by calculating standard deviation. The benchmark index moved down towards the lower Bollinger band in the course of last month. Such indication shows an increase in selling pressure in the market. The distance between the upper and lower bands has increased significantly indicating a rise in market volatility.</p>
<p style="text-align:center"><img alt="" src="/userfiles/images/Clipboard27%284%29.jpg" /></p>
<p style="text-align:justify"><span style="font-size:16px"><strong>Overview</strong></span><br />
The benchmark index decreased by 99.76 points (or down 7.57%) to close at 1218.46 last month. The index breached 50-day moving average and still trading below 200-day moving average indicating bearish momentum in the market. The macd line and signal line have entered into the negative territory indicating a bearish momentum in the market. The RSI closed at 30.49 levels, indicating a rise in the selling pressure in the market. The Bollinger bands indicate an increase in market volatility due to increase in the distance between upper and lower bands. The support and resistance level stands at 1170 and 1305 level respectively. </p>
',
'status' => true,
'publish_date' => '0000-00-00',
'created' => '2018-07-05 11:09:50',
'modified' => '2018-07-11 10:17:16',
'keywords' => '',
'description' => '',
'sortorder' => '2128',
'feature_article' => true,
'user_id' => '11',
'image1' => null,
'image2' => null,
'image3' => null,
'image4' => null
),
'MagazineIssue' => array(
'id' => '987',
'image' => '20180705101232_cover.JPG',
'sortorder' => '1536',
'published' => true,
'created' => '2018-07-05 10:12:32',
'modified' => '2018-07-11 10:04:04',
'title' => 'July 2018',
'publish_date' => '2018-07-01',
'parent_id' => '0',
'homepage' => true,
'user_id' => '11'
),
'MagazineCategory' => array(
'id' => '63',
'title' => 'Stock Taking',
'sortorder' => '516',
'status' => true,
'created' => '0000-00-00 00:00:00',
'homepage' => true,
'modified' => '2013-04-01 00:00:00'
),
'User' => array(
'password' => '*****',
'id' => '11',
'user_detail_id' => '0',
'group_id' => '24',
'username' => 'nsingha@abhiyan.com.np',
'name' => '',
'email' => 'nsingha@abhiyan.com.np',
'address' => '',
'gender' => '',
'access' => '1',
'phone' => '',
'access_type' => '0',
'activated' => false,
'sortorder' => '0',
'published' => '0',
'created' => '2015-04-08 13:22:59',
'last_login' => '2023-04-16 09:29:47',
'ip' => '172.69.77.43'
),
'MagazineArticleComment' => array(),
'MagazineView' => array(
(int) 0 => array(
[maximum depth reached]
)
)
),
'current_user' => null,
'logged_in' => false
)
$magazineArticle = array(
'MagazineArticle' => array(
'id' => '2171',
'magazine_issue_id' => '987',
'magazine_category_id' => '63',
'title' => 'Monthly Technical Analysis of Nepse (May25th 2018 - June 21th 2018)',
'image' => null,
'short_content' => 'The benchmark index declined in the course of last month. Nepse decreased by 99.76 points (or down 7.57%) to close at 1218.46. The index breached 50-day moving average and still trading below 200-day moving average indicating bearish momentum in the market. ',
'content' => '<p style="text-align:justify"><span style="font-size:20px"><strong>Bearish & Volatile</strong></span></p>
<p style="text-align:center"><span style="font-size:20px"><strong><img alt="" src="/userfiles/images/Clipboard23%287%29.jpg" /></strong></span></p>
<p style="text-align:center"><img alt="" src="/userfiles/images/Clipboard21%286%29.jpg" /></p>
<p style="text-align:justify"><span style="font-size:16px"><strong>Trend Analysis</strong></span><br />
The benchmark index declined in the course of last month. Nepse decreased by 99.76 points (or down 7.57%) to close at 1218.46. The index breached 50-day moving average and still trading below 200-day moving average indicating bearish momentum in the market. The average volume turnover decreased to NPR 34.79 crores from NPR 40.8 crores the month prior.</p>
<p style="text-align:justify"><span style="font-size:16px"><strong>Resistance and Support</strong></span></p>
<p style="text-align:center"><span style="font-size:16px"><strong><img alt="" src="/userfiles/images/Clipboard22%285%29.jpg" /></strong></span></p>
<p style="text-align:justify">The Nepse index has declined from 1318.22 to 1218.46 in the course of last month. It has breached support level of 1305. Such movement indicates a bearish momentum in the market. The immediate support and resistance has changed to 1170 and 1305 respectively.</p>
<p style="text-align:justify"><span style="font-size:16px"><strong>Nepse Trend Indicator</strong></span><br />
<strong>a. MACD</strong><br />
The MACD is a momentum oscillator formed by using two different types of moving averages, which provides specific buying or selling signals. When a MACD line crosses above the signal line, it is considered to be a positive sign and indicates a time to buy, and vice-versa.</p>
<p style="text-align:justify">The MACD and the signal line, at the beginning of last month, stood at 1.38 and 7.44 respectively. By the end of the month, the macd and the signal line decreased by 28.57 and 31.06 points to close at -27.19 and -23.63 respectively. The macd line and signal line have entered into the negative territory indicating a bearish momentum in the market.</p>
<p style="text-align:center"><img alt="" src="/userfiles/images/Clipboard24%2810%29.jpg" /></p>
<p style="text-align:justify"><strong>b. RSI</strong><br />
RSI is a form of leading indicator that is believed to be most effective during periods of sideways movement. Such indicators may create numerous buy and sell signals that are useful when the market is not clearly trending upwards or downwards.</p>
<p style="text-align:justify">The RSI, at the beginning of last month, stood at 43.67 levels. In the course of the month, it lost 13.18 points to close at 30.49 levels. The RSI falling at 30s zone indicates a rise in selling pressure in the market.</p>
<p style="text-align:center"><img alt="" src="/userfiles/images/Clipboard26%284%29.jpg" style="height:157px; width:800px" /></p>
<p style="text-align:justify"><strong>c. Bollinger Bands</strong><br />
The Bollinger Band is a technical indicator that consists of a moving average (21-day) along with two trading bands above (upper band) and below it (lower band). The bands are an indication of volatility, which are represented by calculating standard deviation. The benchmark index moved down towards the lower Bollinger band in the course of last month. Such indication shows an increase in selling pressure in the market. The distance between the upper and lower bands has increased significantly indicating a rise in market volatility.</p>
<p style="text-align:center"><img alt="" src="/userfiles/images/Clipboard27%284%29.jpg" /></p>
<p style="text-align:justify"><span style="font-size:16px"><strong>Overview</strong></span><br />
The benchmark index decreased by 99.76 points (or down 7.57%) to close at 1218.46 last month. The index breached 50-day moving average and still trading below 200-day moving average indicating bearish momentum in the market. The macd line and signal line have entered into the negative territory indicating a bearish momentum in the market. The RSI closed at 30.49 levels, indicating a rise in the selling pressure in the market. The Bollinger bands indicate an increase in market volatility due to increase in the distance between upper and lower bands. The support and resistance level stands at 1170 and 1305 level respectively. </p>
',
'status' => true,
'publish_date' => '0000-00-00',
'created' => '2018-07-05 11:09:50',
'modified' => '2018-07-11 10:17:16',
'keywords' => '',
'description' => '',
'sortorder' => '2128',
'feature_article' => true,
'user_id' => '11',
'image1' => null,
'image2' => null,
'image3' => null,
'image4' => null
),
'MagazineIssue' => array(
'id' => '987',
'image' => '20180705101232_cover.JPG',
'sortorder' => '1536',
'published' => true,
'created' => '2018-07-05 10:12:32',
'modified' => '2018-07-11 10:04:04',
'title' => 'July 2018',
'publish_date' => '2018-07-01',
'parent_id' => '0',
'homepage' => true,
'user_id' => '11'
),
'MagazineCategory' => array(
'id' => '63',
'title' => 'Stock Taking',
'sortorder' => '516',
'status' => true,
'created' => '0000-00-00 00:00:00',
'homepage' => true,
'modified' => '2013-04-01 00:00:00'
),
'User' => array(
'password' => '*****',
'id' => '11',
'user_detail_id' => '0',
'group_id' => '24',
'username' => 'nsingha@abhiyan.com.np',
'name' => '',
'email' => 'nsingha@abhiyan.com.np',
'address' => '',
'gender' => '',
'access' => '1',
'phone' => '',
'access_type' => '0',
'activated' => false,
'sortorder' => '0',
'published' => '0',
'created' => '2015-04-08 13:22:59',
'last_login' => '2023-04-16 09:29:47',
'ip' => '172.69.77.43'
),
'MagazineArticleComment' => array(),
'MagazineView' => array(
(int) 0 => array(
'magazine_article_id' => '2171',
'hit' => '3740'
)
)
)
$current_user = null
$logged_in = false
$user = null
$groupId = null
include - APP/View/MagazineArticles/view.ctp, line 55
View::_evaluate() - CORE/Cake/View/View.php, line 971
View::_render() - CORE/Cake/View/View.php, line 933
View::render() - CORE/Cake/View/View.php, line 473
Controller::render() - CORE/Cake/Controller/Controller.php, line 968
Dispatcher::_invoke() - CORE/Cake/Routing/Dispatcher.php, line 200
Dispatcher::dispatch() - CORE/Cake/Routing/Dispatcher.php, line 167
[main] - APP/webroot/index.php, line 117
Notice (8): Undefined index: summary [APP/View/MagazineArticles/view.ctp, line 62]Code Context<?php
echo $this->Html->meta(array('name' => 'description', 'type' => 'meta', 'content' => $magazineArticle['MagazineArticle']['summary']), null, array('inline' => false));?>
$viewFile = '/var/www/html/newbusinessage.com/app/View/MagazineArticles/view.ctp'
$dataForView = array(
'magazineArticle' => array(
'MagazineArticle' => array(
'id' => '2171',
'magazine_issue_id' => '987',
'magazine_category_id' => '63',
'title' => 'Monthly Technical Analysis of Nepse (May25th 2018 - June 21th 2018)',
'image' => null,
'short_content' => 'The benchmark index declined in the course of last month. Nepse decreased by 99.76 points (or down 7.57%) to close at 1218.46. The index breached 50-day moving average and still trading below 200-day moving average indicating bearish momentum in the market. ',
'content' => '<p style="text-align:justify"><span style="font-size:20px"><strong>Bearish & Volatile</strong></span></p>
<p style="text-align:center"><span style="font-size:20px"><strong><img alt="" src="/userfiles/images/Clipboard23%287%29.jpg" /></strong></span></p>
<p style="text-align:center"><img alt="" src="/userfiles/images/Clipboard21%286%29.jpg" /></p>
<p style="text-align:justify"><span style="font-size:16px"><strong>Trend Analysis</strong></span><br />
The benchmark index declined in the course of last month. Nepse decreased by 99.76 points (or down 7.57%) to close at 1218.46. The index breached 50-day moving average and still trading below 200-day moving average indicating bearish momentum in the market. The average volume turnover decreased to NPR 34.79 crores from NPR 40.8 crores the month prior.</p>
<p style="text-align:justify"><span style="font-size:16px"><strong>Resistance and Support</strong></span></p>
<p style="text-align:center"><span style="font-size:16px"><strong><img alt="" src="/userfiles/images/Clipboard22%285%29.jpg" /></strong></span></p>
<p style="text-align:justify">The Nepse index has declined from 1318.22 to 1218.46 in the course of last month. It has breached support level of 1305. Such movement indicates a bearish momentum in the market. The immediate support and resistance has changed to 1170 and 1305 respectively.</p>
<p style="text-align:justify"><span style="font-size:16px"><strong>Nepse Trend Indicator</strong></span><br />
<strong>a. MACD</strong><br />
The MACD is a momentum oscillator formed by using two different types of moving averages, which provides specific buying or selling signals. When a MACD line crosses above the signal line, it is considered to be a positive sign and indicates a time to buy, and vice-versa.</p>
<p style="text-align:justify">The MACD and the signal line, at the beginning of last month, stood at 1.38 and 7.44 respectively. By the end of the month, the macd and the signal line decreased by 28.57 and 31.06 points to close at -27.19 and -23.63 respectively. The macd line and signal line have entered into the negative territory indicating a bearish momentum in the market.</p>
<p style="text-align:center"><img alt="" src="/userfiles/images/Clipboard24%2810%29.jpg" /></p>
<p style="text-align:justify"><strong>b. RSI</strong><br />
RSI is a form of leading indicator that is believed to be most effective during periods of sideways movement. Such indicators may create numerous buy and sell signals that are useful when the market is not clearly trending upwards or downwards.</p>
<p style="text-align:justify">The RSI, at the beginning of last month, stood at 43.67 levels. In the course of the month, it lost 13.18 points to close at 30.49 levels. The RSI falling at 30s zone indicates a rise in selling pressure in the market.</p>
<p style="text-align:center"><img alt="" src="/userfiles/images/Clipboard26%284%29.jpg" style="height:157px; width:800px" /></p>
<p style="text-align:justify"><strong>c. Bollinger Bands</strong><br />
The Bollinger Band is a technical indicator that consists of a moving average (21-day) along with two trading bands above (upper band) and below it (lower band). The bands are an indication of volatility, which are represented by calculating standard deviation. The benchmark index moved down towards the lower Bollinger band in the course of last month. Such indication shows an increase in selling pressure in the market. The distance between the upper and lower bands has increased significantly indicating a rise in market volatility.</p>
<p style="text-align:center"><img alt="" src="/userfiles/images/Clipboard27%284%29.jpg" /></p>
<p style="text-align:justify"><span style="font-size:16px"><strong>Overview</strong></span><br />
The benchmark index decreased by 99.76 points (or down 7.57%) to close at 1218.46 last month. The index breached 50-day moving average and still trading below 200-day moving average indicating bearish momentum in the market. The macd line and signal line have entered into the negative territory indicating a bearish momentum in the market. The RSI closed at 30.49 levels, indicating a rise in the selling pressure in the market. The Bollinger bands indicate an increase in market volatility due to increase in the distance between upper and lower bands. The support and resistance level stands at 1170 and 1305 level respectively. </p>
',
'status' => true,
'publish_date' => '0000-00-00',
'created' => '2018-07-05 11:09:50',
'modified' => '2018-07-11 10:17:16',
'keywords' => '',
'description' => '',
'sortorder' => '2128',
'feature_article' => true,
'user_id' => '11',
'image1' => null,
'image2' => null,
'image3' => null,
'image4' => null
),
'MagazineIssue' => array(
'id' => '987',
'image' => '20180705101232_cover.JPG',
'sortorder' => '1536',
'published' => true,
'created' => '2018-07-05 10:12:32',
'modified' => '2018-07-11 10:04:04',
'title' => 'July 2018',
'publish_date' => '2018-07-01',
'parent_id' => '0',
'homepage' => true,
'user_id' => '11'
),
'MagazineCategory' => array(
'id' => '63',
'title' => 'Stock Taking',
'sortorder' => '516',
'status' => true,
'created' => '0000-00-00 00:00:00',
'homepage' => true,
'modified' => '2013-04-01 00:00:00'
),
'User' => array(
'password' => '*****',
'id' => '11',
'user_detail_id' => '0',
'group_id' => '24',
'username' => 'nsingha@abhiyan.com.np',
'name' => '',
'email' => 'nsingha@abhiyan.com.np',
'address' => '',
'gender' => '',
'access' => '1',
'phone' => '',
'access_type' => '0',
'activated' => false,
'sortorder' => '0',
'published' => '0',
'created' => '2015-04-08 13:22:59',
'last_login' => '2023-04-16 09:29:47',
'ip' => '172.69.77.43'
),
'MagazineArticleComment' => array(),
'MagazineView' => array(
(int) 0 => array(
[maximum depth reached]
)
)
),
'current_user' => null,
'logged_in' => false
)
$magazineArticle = array(
'MagazineArticle' => array(
'id' => '2171',
'magazine_issue_id' => '987',
'magazine_category_id' => '63',
'title' => 'Monthly Technical Analysis of Nepse (May25th 2018 - June 21th 2018)',
'image' => null,
'short_content' => 'The benchmark index declined in the course of last month. Nepse decreased by 99.76 points (or down 7.57%) to close at 1218.46. The index breached 50-day moving average and still trading below 200-day moving average indicating bearish momentum in the market. ',
'content' => '<p style="text-align:justify"><span style="font-size:20px"><strong>Bearish & Volatile</strong></span></p>
<p style="text-align:center"><span style="font-size:20px"><strong><img alt="" src="/userfiles/images/Clipboard23%287%29.jpg" /></strong></span></p>
<p style="text-align:center"><img alt="" src="/userfiles/images/Clipboard21%286%29.jpg" /></p>
<p style="text-align:justify"><span style="font-size:16px"><strong>Trend Analysis</strong></span><br />
The benchmark index declined in the course of last month. Nepse decreased by 99.76 points (or down 7.57%) to close at 1218.46. The index breached 50-day moving average and still trading below 200-day moving average indicating bearish momentum in the market. The average volume turnover decreased to NPR 34.79 crores from NPR 40.8 crores the month prior.</p>
<p style="text-align:justify"><span style="font-size:16px"><strong>Resistance and Support</strong></span></p>
<p style="text-align:center"><span style="font-size:16px"><strong><img alt="" src="/userfiles/images/Clipboard22%285%29.jpg" /></strong></span></p>
<p style="text-align:justify">The Nepse index has declined from 1318.22 to 1218.46 in the course of last month. It has breached support level of 1305. Such movement indicates a bearish momentum in the market. The immediate support and resistance has changed to 1170 and 1305 respectively.</p>
<p style="text-align:justify"><span style="font-size:16px"><strong>Nepse Trend Indicator</strong></span><br />
<strong>a. MACD</strong><br />
The MACD is a momentum oscillator formed by using two different types of moving averages, which provides specific buying or selling signals. When a MACD line crosses above the signal line, it is considered to be a positive sign and indicates a time to buy, and vice-versa.</p>
<p style="text-align:justify">The MACD and the signal line, at the beginning of last month, stood at 1.38 and 7.44 respectively. By the end of the month, the macd and the signal line decreased by 28.57 and 31.06 points to close at -27.19 and -23.63 respectively. The macd line and signal line have entered into the negative territory indicating a bearish momentum in the market.</p>
<p style="text-align:center"><img alt="" src="/userfiles/images/Clipboard24%2810%29.jpg" /></p>
<p style="text-align:justify"><strong>b. RSI</strong><br />
RSI is a form of leading indicator that is believed to be most effective during periods of sideways movement. Such indicators may create numerous buy and sell signals that are useful when the market is not clearly trending upwards or downwards.</p>
<p style="text-align:justify">The RSI, at the beginning of last month, stood at 43.67 levels. In the course of the month, it lost 13.18 points to close at 30.49 levels. The RSI falling at 30s zone indicates a rise in selling pressure in the market.</p>
<p style="text-align:center"><img alt="" src="/userfiles/images/Clipboard26%284%29.jpg" style="height:157px; width:800px" /></p>
<p style="text-align:justify"><strong>c. Bollinger Bands</strong><br />
The Bollinger Band is a technical indicator that consists of a moving average (21-day) along with two trading bands above (upper band) and below it (lower band). The bands are an indication of volatility, which are represented by calculating standard deviation. The benchmark index moved down towards the lower Bollinger band in the course of last month. Such indication shows an increase in selling pressure in the market. The distance between the upper and lower bands has increased significantly indicating a rise in market volatility.</p>
<p style="text-align:center"><img alt="" src="/userfiles/images/Clipboard27%284%29.jpg" /></p>
<p style="text-align:justify"><span style="font-size:16px"><strong>Overview</strong></span><br />
The benchmark index decreased by 99.76 points (or down 7.57%) to close at 1218.46 last month. The index breached 50-day moving average and still trading below 200-day moving average indicating bearish momentum in the market. The macd line and signal line have entered into the negative territory indicating a bearish momentum in the market. The RSI closed at 30.49 levels, indicating a rise in the selling pressure in the market. The Bollinger bands indicate an increase in market volatility due to increase in the distance between upper and lower bands. The support and resistance level stands at 1170 and 1305 level respectively. </p>
',
'status' => true,
'publish_date' => '0000-00-00',
'created' => '2018-07-05 11:09:50',
'modified' => '2018-07-11 10:17:16',
'keywords' => '',
'description' => '',
'sortorder' => '2128',
'feature_article' => true,
'user_id' => '11',
'image1' => null,
'image2' => null,
'image3' => null,
'image4' => null
),
'MagazineIssue' => array(
'id' => '987',
'image' => '20180705101232_cover.JPG',
'sortorder' => '1536',
'published' => true,
'created' => '2018-07-05 10:12:32',
'modified' => '2018-07-11 10:04:04',
'title' => 'July 2018',
'publish_date' => '2018-07-01',
'parent_id' => '0',
'homepage' => true,
'user_id' => '11'
),
'MagazineCategory' => array(
'id' => '63',
'title' => 'Stock Taking',
'sortorder' => '516',
'status' => true,
'created' => '0000-00-00 00:00:00',
'homepage' => true,
'modified' => '2013-04-01 00:00:00'
),
'User' => array(
'password' => '*****',
'id' => '11',
'user_detail_id' => '0',
'group_id' => '24',
'username' => 'nsingha@abhiyan.com.np',
'name' => '',
'email' => 'nsingha@abhiyan.com.np',
'address' => '',
'gender' => '',
'access' => '1',
'phone' => '',
'access_type' => '0',
'activated' => false,
'sortorder' => '0',
'published' => '0',
'created' => '2015-04-08 13:22:59',
'last_login' => '2023-04-16 09:29:47',
'ip' => '172.69.77.43'
),
'MagazineArticleComment' => array(),
'MagazineView' => array(
(int) 0 => array(
'magazine_article_id' => '2171',
'hit' => '3740'
)
)
)
$current_user = null
$logged_in = false
$user = null
$groupId = null
$user_id = null
include - APP/View/MagazineArticles/view.ctp, line 62
View::_evaluate() - CORE/Cake/View/View.php, line 971
View::_render() - CORE/Cake/View/View.php, line 933
View::render() - CORE/Cake/View/View.php, line 473
Controller::render() - CORE/Cake/Controller/Controller.php, line 968
Dispatcher::_invoke() - CORE/Cake/Routing/Dispatcher.php, line 200
Dispatcher::dispatch() - CORE/Cake/Routing/Dispatcher.php, line 167
[main] - APP/webroot/index.php, line 117
Notice (8): Undefined index: summary [APP/View/MagazineArticles/view.ctp, line 68]Code Context echo $this->Html->meta(array('property' => 'og:title', 'type' => 'meta', 'content' => $magazineArticle['MagazineArticle']['title']), null, array('inline' => false));?>
<?php
echo $this->Html->meta(array('property' => 'og:description', 'type' => 'meta', 'content' => $magazineArticle['MagazineArticle']['summary']), null, array('inline' => false));?>
$viewFile = '/var/www/html/newbusinessage.com/app/View/MagazineArticles/view.ctp'
$dataForView = array(
'magazineArticle' => array(
'MagazineArticle' => array(
'id' => '2171',
'magazine_issue_id' => '987',
'magazine_category_id' => '63',
'title' => 'Monthly Technical Analysis of Nepse (May25th 2018 - June 21th 2018)',
'image' => null,
'short_content' => 'The benchmark index declined in the course of last month. Nepse decreased by 99.76 points (or down 7.57%) to close at 1218.46. The index breached 50-day moving average and still trading below 200-day moving average indicating bearish momentum in the market. ',
'content' => '<p style="text-align:justify"><span style="font-size:20px"><strong>Bearish & Volatile</strong></span></p>
<p style="text-align:center"><span style="font-size:20px"><strong><img alt="" src="/userfiles/images/Clipboard23%287%29.jpg" /></strong></span></p>
<p style="text-align:center"><img alt="" src="/userfiles/images/Clipboard21%286%29.jpg" /></p>
<p style="text-align:justify"><span style="font-size:16px"><strong>Trend Analysis</strong></span><br />
The benchmark index declined in the course of last month. Nepse decreased by 99.76 points (or down 7.57%) to close at 1218.46. The index breached 50-day moving average and still trading below 200-day moving average indicating bearish momentum in the market. The average volume turnover decreased to NPR 34.79 crores from NPR 40.8 crores the month prior.</p>
<p style="text-align:justify"><span style="font-size:16px"><strong>Resistance and Support</strong></span></p>
<p style="text-align:center"><span style="font-size:16px"><strong><img alt="" src="/userfiles/images/Clipboard22%285%29.jpg" /></strong></span></p>
<p style="text-align:justify">The Nepse index has declined from 1318.22 to 1218.46 in the course of last month. It has breached support level of 1305. Such movement indicates a bearish momentum in the market. The immediate support and resistance has changed to 1170 and 1305 respectively.</p>
<p style="text-align:justify"><span style="font-size:16px"><strong>Nepse Trend Indicator</strong></span><br />
<strong>a. MACD</strong><br />
The MACD is a momentum oscillator formed by using two different types of moving averages, which provides specific buying or selling signals. When a MACD line crosses above the signal line, it is considered to be a positive sign and indicates a time to buy, and vice-versa.</p>
<p style="text-align:justify">The MACD and the signal line, at the beginning of last month, stood at 1.38 and 7.44 respectively. By the end of the month, the macd and the signal line decreased by 28.57 and 31.06 points to close at -27.19 and -23.63 respectively. The macd line and signal line have entered into the negative territory indicating a bearish momentum in the market.</p>
<p style="text-align:center"><img alt="" src="/userfiles/images/Clipboard24%2810%29.jpg" /></p>
<p style="text-align:justify"><strong>b. RSI</strong><br />
RSI is a form of leading indicator that is believed to be most effective during periods of sideways movement. Such indicators may create numerous buy and sell signals that are useful when the market is not clearly trending upwards or downwards.</p>
<p style="text-align:justify">The RSI, at the beginning of last month, stood at 43.67 levels. In the course of the month, it lost 13.18 points to close at 30.49 levels. The RSI falling at 30s zone indicates a rise in selling pressure in the market.</p>
<p style="text-align:center"><img alt="" src="/userfiles/images/Clipboard26%284%29.jpg" style="height:157px; width:800px" /></p>
<p style="text-align:justify"><strong>c. Bollinger Bands</strong><br />
The Bollinger Band is a technical indicator that consists of a moving average (21-day) along with two trading bands above (upper band) and below it (lower band). The bands are an indication of volatility, which are represented by calculating standard deviation. The benchmark index moved down towards the lower Bollinger band in the course of last month. Such indication shows an increase in selling pressure in the market. The distance between the upper and lower bands has increased significantly indicating a rise in market volatility.</p>
<p style="text-align:center"><img alt="" src="/userfiles/images/Clipboard27%284%29.jpg" /></p>
<p style="text-align:justify"><span style="font-size:16px"><strong>Overview</strong></span><br />
The benchmark index decreased by 99.76 points (or down 7.57%) to close at 1218.46 last month. The index breached 50-day moving average and still trading below 200-day moving average indicating bearish momentum in the market. The macd line and signal line have entered into the negative territory indicating a bearish momentum in the market. The RSI closed at 30.49 levels, indicating a rise in the selling pressure in the market. The Bollinger bands indicate an increase in market volatility due to increase in the distance between upper and lower bands. The support and resistance level stands at 1170 and 1305 level respectively. </p>
',
'status' => true,
'publish_date' => '0000-00-00',
'created' => '2018-07-05 11:09:50',
'modified' => '2018-07-11 10:17:16',
'keywords' => '',
'description' => '',
'sortorder' => '2128',
'feature_article' => true,
'user_id' => '11',
'image1' => null,
'image2' => null,
'image3' => null,
'image4' => null
),
'MagazineIssue' => array(
'id' => '987',
'image' => '20180705101232_cover.JPG',
'sortorder' => '1536',
'published' => true,
'created' => '2018-07-05 10:12:32',
'modified' => '2018-07-11 10:04:04',
'title' => 'July 2018',
'publish_date' => '2018-07-01',
'parent_id' => '0',
'homepage' => true,
'user_id' => '11'
),
'MagazineCategory' => array(
'id' => '63',
'title' => 'Stock Taking',
'sortorder' => '516',
'status' => true,
'created' => '0000-00-00 00:00:00',
'homepage' => true,
'modified' => '2013-04-01 00:00:00'
),
'User' => array(
'password' => '*****',
'id' => '11',
'user_detail_id' => '0',
'group_id' => '24',
'username' => 'nsingha@abhiyan.com.np',
'name' => '',
'email' => 'nsingha@abhiyan.com.np',
'address' => '',
'gender' => '',
'access' => '1',
'phone' => '',
'access_type' => '0',
'activated' => false,
'sortorder' => '0',
'published' => '0',
'created' => '2015-04-08 13:22:59',
'last_login' => '2023-04-16 09:29:47',
'ip' => '172.69.77.43'
),
'MagazineArticleComment' => array(),
'MagazineView' => array(
(int) 0 => array(
[maximum depth reached]
)
)
),
'current_user' => null,
'logged_in' => false
)
$magazineArticle = array(
'MagazineArticle' => array(
'id' => '2171',
'magazine_issue_id' => '987',
'magazine_category_id' => '63',
'title' => 'Monthly Technical Analysis of Nepse (May25th 2018 - June 21th 2018)',
'image' => null,
'short_content' => 'The benchmark index declined in the course of last month. Nepse decreased by 99.76 points (or down 7.57%) to close at 1218.46. The index breached 50-day moving average and still trading below 200-day moving average indicating bearish momentum in the market. ',
'content' => '<p style="text-align:justify"><span style="font-size:20px"><strong>Bearish & Volatile</strong></span></p>
<p style="text-align:center"><span style="font-size:20px"><strong><img alt="" src="/userfiles/images/Clipboard23%287%29.jpg" /></strong></span></p>
<p style="text-align:center"><img alt="" src="/userfiles/images/Clipboard21%286%29.jpg" /></p>
<p style="text-align:justify"><span style="font-size:16px"><strong>Trend Analysis</strong></span><br />
The benchmark index declined in the course of last month. Nepse decreased by 99.76 points (or down 7.57%) to close at 1218.46. The index breached 50-day moving average and still trading below 200-day moving average indicating bearish momentum in the market. The average volume turnover decreased to NPR 34.79 crores from NPR 40.8 crores the month prior.</p>
<p style="text-align:justify"><span style="font-size:16px"><strong>Resistance and Support</strong></span></p>
<p style="text-align:center"><span style="font-size:16px"><strong><img alt="" src="/userfiles/images/Clipboard22%285%29.jpg" /></strong></span></p>
<p style="text-align:justify">The Nepse index has declined from 1318.22 to 1218.46 in the course of last month. It has breached support level of 1305. Such movement indicates a bearish momentum in the market. The immediate support and resistance has changed to 1170 and 1305 respectively.</p>
<p style="text-align:justify"><span style="font-size:16px"><strong>Nepse Trend Indicator</strong></span><br />
<strong>a. MACD</strong><br />
The MACD is a momentum oscillator formed by using two different types of moving averages, which provides specific buying or selling signals. When a MACD line crosses above the signal line, it is considered to be a positive sign and indicates a time to buy, and vice-versa.</p>
<p style="text-align:justify">The MACD and the signal line, at the beginning of last month, stood at 1.38 and 7.44 respectively. By the end of the month, the macd and the signal line decreased by 28.57 and 31.06 points to close at -27.19 and -23.63 respectively. The macd line and signal line have entered into the negative territory indicating a bearish momentum in the market.</p>
<p style="text-align:center"><img alt="" src="/userfiles/images/Clipboard24%2810%29.jpg" /></p>
<p style="text-align:justify"><strong>b. RSI</strong><br />
RSI is a form of leading indicator that is believed to be most effective during periods of sideways movement. Such indicators may create numerous buy and sell signals that are useful when the market is not clearly trending upwards or downwards.</p>
<p style="text-align:justify">The RSI, at the beginning of last month, stood at 43.67 levels. In the course of the month, it lost 13.18 points to close at 30.49 levels. The RSI falling at 30s zone indicates a rise in selling pressure in the market.</p>
<p style="text-align:center"><img alt="" src="/userfiles/images/Clipboard26%284%29.jpg" style="height:157px; width:800px" /></p>
<p style="text-align:justify"><strong>c. Bollinger Bands</strong><br />
The Bollinger Band is a technical indicator that consists of a moving average (21-day) along with two trading bands above (upper band) and below it (lower band). The bands are an indication of volatility, which are represented by calculating standard deviation. The benchmark index moved down towards the lower Bollinger band in the course of last month. Such indication shows an increase in selling pressure in the market. The distance between the upper and lower bands has increased significantly indicating a rise in market volatility.</p>
<p style="text-align:center"><img alt="" src="/userfiles/images/Clipboard27%284%29.jpg" /></p>
<p style="text-align:justify"><span style="font-size:16px"><strong>Overview</strong></span><br />
The benchmark index decreased by 99.76 points (or down 7.57%) to close at 1218.46 last month. The index breached 50-day moving average and still trading below 200-day moving average indicating bearish momentum in the market. The macd line and signal line have entered into the negative territory indicating a bearish momentum in the market. The RSI closed at 30.49 levels, indicating a rise in the selling pressure in the market. The Bollinger bands indicate an increase in market volatility due to increase in the distance between upper and lower bands. The support and resistance level stands at 1170 and 1305 level respectively. </p>
',
'status' => true,
'publish_date' => '0000-00-00',
'created' => '2018-07-05 11:09:50',
'modified' => '2018-07-11 10:17:16',
'keywords' => '',
'description' => '',
'sortorder' => '2128',
'feature_article' => true,
'user_id' => '11',
'image1' => null,
'image2' => null,
'image3' => null,
'image4' => null
),
'MagazineIssue' => array(
'id' => '987',
'image' => '20180705101232_cover.JPG',
'sortorder' => '1536',
'published' => true,
'created' => '2018-07-05 10:12:32',
'modified' => '2018-07-11 10:04:04',
'title' => 'July 2018',
'publish_date' => '2018-07-01',
'parent_id' => '0',
'homepage' => true,
'user_id' => '11'
),
'MagazineCategory' => array(
'id' => '63',
'title' => 'Stock Taking',
'sortorder' => '516',
'status' => true,
'created' => '0000-00-00 00:00:00',
'homepage' => true,
'modified' => '2013-04-01 00:00:00'
),
'User' => array(
'password' => '*****',
'id' => '11',
'user_detail_id' => '0',
'group_id' => '24',
'username' => 'nsingha@abhiyan.com.np',
'name' => '',
'email' => 'nsingha@abhiyan.com.np',
'address' => '',
'gender' => '',
'access' => '1',
'phone' => '',
'access_type' => '0',
'activated' => false,
'sortorder' => '0',
'published' => '0',
'created' => '2015-04-08 13:22:59',
'last_login' => '2023-04-16 09:29:47',
'ip' => '172.69.77.43'
),
'MagazineArticleComment' => array(),
'MagazineView' => array(
(int) 0 => array(
'magazine_article_id' => '2171',
'hit' => '3740'
)
)
)
$current_user = null
$logged_in = false
$user = null
$groupId = null
$user_id = null
include - APP/View/MagazineArticles/view.ctp, line 68
View::_evaluate() - CORE/Cake/View/View.php, line 971
View::_render() - CORE/Cake/View/View.php, line 933
View::render() - CORE/Cake/View/View.php, line 473
Controller::render() - CORE/Cake/Controller/Controller.php, line 968
Dispatcher::_invoke() - CORE/Cake/Routing/Dispatcher.php, line 200
Dispatcher::dispatch() - CORE/Cake/Routing/Dispatcher.php, line 167
[main] - APP/webroot/index.php, line 117
Monthly Technical Analysis of Nepse (May25th 2018 - June 21th 2018)
Bearish & Volatile
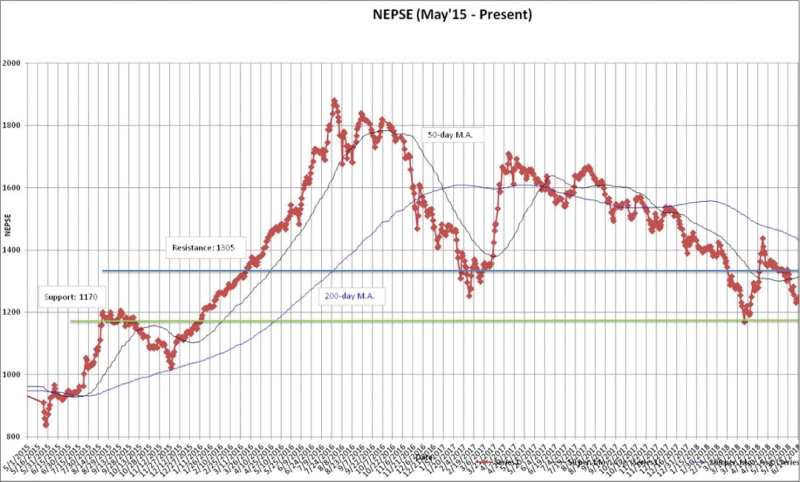
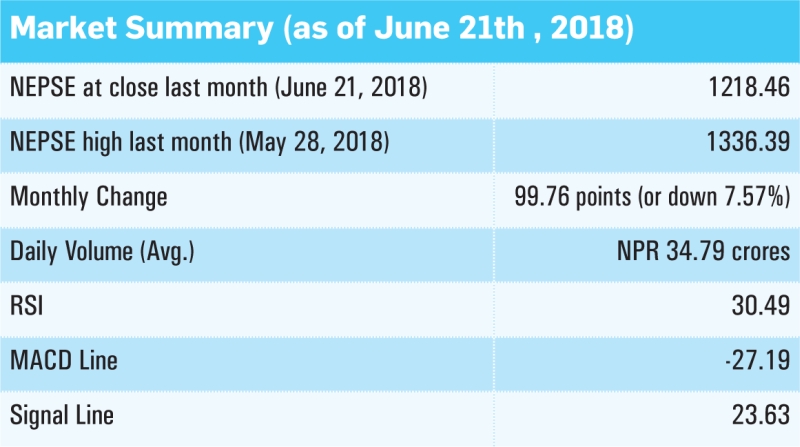
Trend Analysis
The benchmark index declined in the course of last month. Nepse decreased by 99.76 points (or down 7.57%) to close at 1218.46. The index breached 50-day moving average and still trading below 200-day moving average indicating bearish momentum in the market. The average volume turnover decreased to NPR 34.79 crores from NPR 40.8 crores the month prior.
Resistance and Support
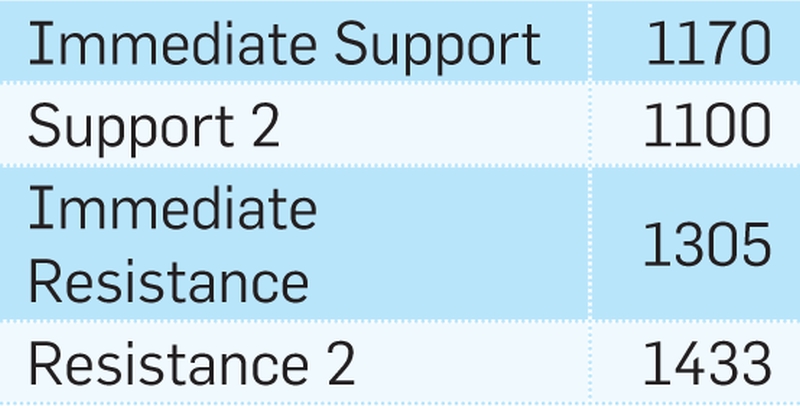
The Nepse index has declined from 1318.22 to 1218.46 in the course of last month. It has breached support level of 1305. Such movement indicates a bearish momentum in the market. The immediate support and resistance has changed to 1170 and 1305 respectively.
Nepse Trend Indicator
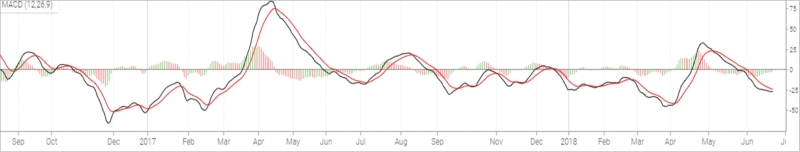
a. MACD
The MACD is a momentum oscillator formed by using two different types of moving averages, which provides specific buying or selling signals. When a MACD line crosses above the signal line, it is considered to be a positive sign and indicates a time to buy, and vice-versa.
The MACD and the signal line, at the beginning of last month, stood at 1.38 and 7.44 respectively. By the end of the month, the macd and the signal line decreased by 28.57 and 31.06 points to close at -27.19 and -23.63 respectively. The macd line and signal line have entered into the negative territory indicating a bearish momentum in the market.
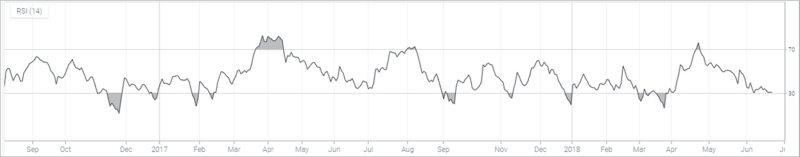
b. RSI
RSI is a form of leading indicator that is believed to be most effective during periods of sideways movement. Such indicators may create numerous buy and sell signals that are useful when the market is not clearly trending upwards or downwards.
The RSI, at the beginning of last month, stood at 43.67 levels. In the course of the month, it lost 13.18 points to close at 30.49 levels. The RSI falling at 30s zone indicates a rise in selling pressure in the market.
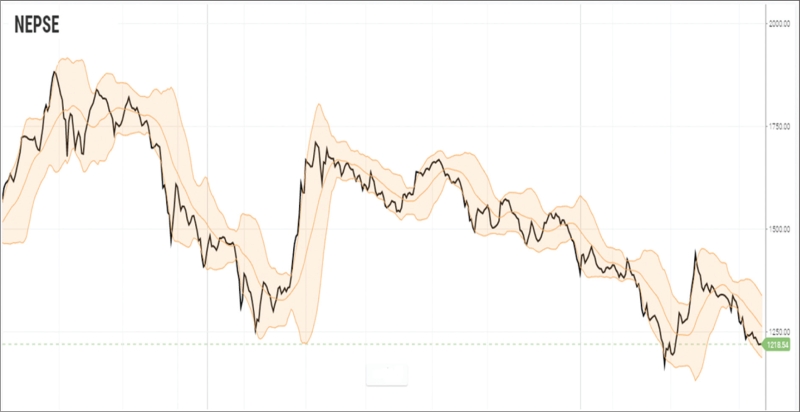
c. Bollinger Bands
The Bollinger Band is a technical indicator that consists of a moving average (21-day) along with two trading bands above (upper band) and below it (lower band). The bands are an indication of volatility, which are represented by calculating standard deviation. The benchmark index moved down towards the lower Bollinger band in the course of last month. Such indication shows an increase in selling pressure in the market. The distance between the upper and lower bands has increased significantly indicating a rise in market volatility.
Overview
The benchmark index decreased by 99.76 points (or down 7.57%) to close at 1218.46 last month. The index breached 50-day moving average and still trading below 200-day moving average indicating bearish momentum in the market. The macd line and signal line have entered into the negative territory indicating a bearish momentum in the market. The RSI closed at 30.49 levels, indicating a rise in the selling pressure in the market. The Bollinger bands indicate an increase in market volatility due to increase in the distance between upper and lower bands. The support and resistance level stands at 1170 and 1305 level respectively.