$user = $this->Session->read('Auth.User');
//find the group of logged user
$groupId = $user['Group']['id'];
$viewFile = '/var/www/html/newbusinessage.com/app/View/Articles/view.ctp'
$dataForView = array(
'article' => array(
'Article' => array(
'id' => '9112',
'article_category_id' => '1',
'title' => 'Nepal’s HDI value up, but below average in South Asia',
'sub_title' => '',
'summary' => 'September 17: Nepal’s HDI value for 2017 is 0.574 which puts the country in the medium human development category, according to a report published by UNDP. ',
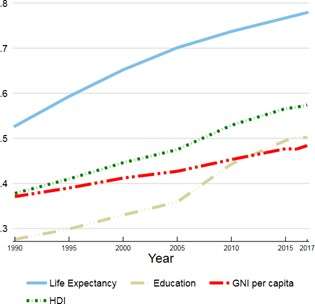
'content' => '<div><span style="font-size:13px">September 17: Nepal’s HDI value for 2017 is 0.574 which puts the country in the medium human development category, according to a report published by UNDP. As per the report, Nepal lies in the 149th position out of 189 countries and territories surveyed by the organisation. </span></div>
<div> </div>
<div><span style="font-size:13px">The report further states that Nepal’s HDI value increased from 0.378 to 0.574 between 1990 and 2017, an increase of 51.9 percent. However, Nepal’s 2017 HDI of 0.574 is below the average of 0.645 for countries in the medium human development group and below the average of 0.638 for countries in South Asia.</span></div>
<div> </div>
<div><span style="font-size:13px">The HDI is a summary measure for assessing long-term progress in three basic dimensions of human development: a long and healthy life, access to knowledge and a decent standard of living. </span></div>
<div> </div>
<div><span style="font-size:13px">A long and healthy life is measured by life expectancy. Knowledge level is measured by mean years of education among the adult population, which is the average number of years of education received in a life-time by people aged 25 years and older; and access to learning and knowledge by expected years of schooling for children of school-entry age, which is the total number of years of schooling a child of school-entry age can expect to receive if prevailing patterns of age-specific enrolment rates stay the same throughout the child's life. Standard of living is measured by Gross National Income (GNI) per capita expressed in constant 2011 international dollars converted using purchasing power parity (PPP) conversion rates.</span></div>
<div> </div>
<div><span style="font-size:13px">Table A reviews Nepal’s progress in each of the HDI indicators. Between 1990 and 2017, Nepal’s life expectancy at birth increased by 16.3 years, mean years of schooling increased by 2.9 years and expected years of schooling increased by 4.7 years. Nepal’s GNI per capita increased by about 111.6 percent between 1990 and 2017.</span></div>
<div> </div>
<div>
<p> </p>
<h2>Table A: Nepal’s HDI trends based on consistent time series data and new goalposts</h2>
<table border="1" cellpadding="0" cellspacing="0">
<tbody>
<tr>
<td style="height:28px; width:103px">
<p> </p>
</td>
<td style="height:28px; width:105px">
<p style="margin-left:4.7pt"><strong>Life expectancy</strong></p>
<p style="margin-left:4.5pt"><strong>at birth</strong></p>
</td>
<td style="height:28px; width:104px">
<p style="margin-left:5.05pt"><strong>Expected years</strong></p>
<p style="margin-left:5.05pt"><strong>of schooling</strong></p>
</td>
<td style="height:28px; width:104px">
<p style="margin-left:7.95pt"><strong>Mean years of</strong></p>
<p style="margin-left:7.95pt"><strong>schooling</strong></p>
</td>
<td style="height:28px; width:104px">
<p style="margin-left:8.15pt"><strong>GNI per capita</strong></p>
<p style="margin-left:12.95pt"><strong>(2011 PPP$)</strong></p>
</td>
<td style="height:28px; width:103px">
<p style="margin-left:17.1pt"><strong>HDI value</strong></p>
</td>
</tr>
<tr>
<td style="height:14px; width:103px">
<p style="margin-left:27.6pt">1990</p>
</td>
<td style="height:14px; width:105px">
<p style="margin-left:4.5pt">54.3</p>
</td>
<td style="height:14px; width:104px">
<p style="margin-left:32.85pt">7.5</p>
</td>
<td style="height:14px; width:104px">
<p style="margin-left:7.95pt">2.0</p>
</td>
<td style="height:14px; width:104px">
<p style="margin-left:27.7pt">1,168</p>
</td>
<td style="height:14px; width:103px">
<p style="margin-left:17.1pt">0.378</p>
</td>
</tr>
<tr>
<td style="height:14px; width:103px">
<p style="margin-left:27.6pt">1995</p>
</td>
<td style="height:14px; width:105px">
<p style="margin-left:4.5pt">58.5</p>
</td>
<td style="height:14px; width:104px">
<p style="margin-left:32.85pt">8.1</p>
</td>
<td style="height:14px; width:104px">
<p style="margin-left:7.95pt">2.2</p>
</td>
<td style="height:14px; width:104px">
<p style="margin-left:27.7pt">1,322</p>
</td>
<td style="height:14px; width:103px">
<p style="margin-left:17.1pt">0.410</p>
</td>
</tr>
<tr>
<td style="height:14px; width:103px">
<p style="margin-left:27.6pt">2000</p>
</td>
<td style="height:14px; width:105px">
<p style="margin-left:4.5pt">62.4</p>
</td>
<td style="height:14px; width:104px">
<p style="margin-left:32.85pt">9.0</p>
</td>
<td style="height:14px; width:104px">
<p style="margin-left:7.95pt">2.4</p>
</td>
<td style="height:14px; width:104px">
<p style="margin-left:27.7pt">1,526</p>
</td>
<td style="height:14px; width:103px">
<p style="margin-left:17.1pt">0.446</p>
</td>
</tr>
<tr>
<td style="height:14px; width:103px">
<p style="margin-left:27.6pt">2005</p>
</td>
<td style="height:14px; width:105px">
<p style="margin-left:4.5pt">65.5</p>
</td>
<td style="height:14px; width:104px">
<p style="margin-left:32.85pt">9.6</p>
</td>
<td style="height:14px; width:104px">
<p style="margin-left:7.95pt">2.8</p>
</td>
<td style="height:14px; width:104px">
<p style="margin-left:27.7pt">1,689</p>
</td>
<td style="height:14px; width:103px">
<p style="margin-left:17.1pt">0.475</p>
</td>
</tr>
<tr>
<td style="height:14px; width:103px">
<p style="margin-left:27.6pt">2010</p>
</td>
<td style="height:14px; width:105px">
<p style="margin-left:4.5pt">67.9</p>
</td>
<td style="height:14px; width:104px">
<p style="margin-left:30.35pt">12.0</p>
</td>
<td style="height:14px; width:104px">
<p style="margin-left:7.95pt">3.3</p>
</td>
<td style="height:14px; width:104px">
<p style="margin-left:27.7pt">2,001</p>
</td>
<td style="height:14px; width:103px">
<p style="margin-left:17.1pt">0.529</p>
</td>
</tr>
<tr>
<td style="height:14px; width:103px">
<p style="margin-left:27.6pt">2015</p>
</td>
<td style="height:14px; width:105px">
<p style="margin-left:4.5pt">69.9</p>
</td>
<td style="height:14px; width:104px">
<p style="margin-left:30.35pt">12.2</p>
</td>
<td style="height:14px; width:104px">
<p style="margin-left:7.95pt">4.7</p>
</td>
<td style="height:14px; width:104px">
<p style="margin-left:27.7pt">2,353</p>
</td>
<td style="height:14px; width:103px">
<p style="margin-left:17.1pt">0.566</p>
</td>
</tr>
<tr>
<td style="height:14px; width:103px">
<p style="margin-left:27.6pt">2016</p>
</td>
<td style="height:14px; width:105px">
<p style="margin-left:4.5pt">70.3</p>
</td>
<td style="height:14px; width:104px">
<p style="margin-left:30.35pt">12.2</p>
</td>
<td style="height:14px; width:104px">
<p style="margin-left:7.95pt">4.9</p>
</td>
<td style="height:14px; width:104px">
<p style="margin-left:27.7pt">2,334</p>
</td>
<td style="height:14px; width:103px">
<p style="margin-left:17.1pt">0.569</p>
</td>
</tr>
<tr>
<td style="height:14px; width:103px">
<p style="margin-left:27.6pt">2017</p>
</td>
<td style="height:14px; width:105px">
<p style="margin-left:4.5pt">70.6</p>
</td>
<td style="height:14px; width:104px">
<p style="margin-left:30.35pt">12.2</p>
</td>
<td style="height:14px; width:104px">
<p style="margin-left:7.95pt">4.9</p>
</td>
<td style="height:14px; width:104px">
<p style="margin-left:27.7pt">2,471</p>
</td>
<td style="height:14px; width:103px">
<p style="margin-left:17.1pt">0.574</p>
</td>
</tr>
</tbody>
</table>
<p> </p>
</div>
',
'published' => true,
'created' => '2018-09-17',
'modified' => '2018-09-17',
'keywords' => '',
'description' => '',
'sortorder' => '8891',
'image' => '20180917043814_Clipboard01.jpg',
'article_date' => '2018-09-17 00:00:00',
'homepage' => false,
'breaking_news' => false,
'main_news' => true,
'in_scroller' => false,
'user_id' => '20'
),
'ArticleCategory' => array(
'id' => '1',
'name' => 'NEWS',
'parentOf' => '0',
'published' => true,
'registered' => '2015-07-20 00:00:00',
'sortorder' => '158',
'del_flag' => '0',
'homepage' => true,
'display_in_menu' => true,
'user_id' => '1',
'created' => '0000-00-00 00:00:00',
'modified' => '2018-11-22 11:58:49'
),
'User' => array(
'password' => '*****',
'id' => '20',
'user_detail_id' => '1',
'group_id' => '1',
'username' => 'nroy@newbusinessage.com',
'name' => 'Neeraj Roy',
'email' => 'nroy@newbusinessage.com',
'address' => '',
'gender' => '',
'access' => '1',
'phone' => '',
'access_type' => '0',
'activated' => false,
'sortorder' => '0',
'published' => '1',
'created' => '0000-00-00 00:00:00',
'last_login' => '0000-00-00 00:00:00',
'ip' => ''
),
'ArticleComment' => array(),
'ArticleFeature' => array(),
'ArticleHasAuthor' => array(),
'ArticleHasTag' => array(),
'ArticleView' => array(
(int) 0 => array(
[maximum depth reached]
)
),
'Slider' => array()
),
'current_user' => null,
'logged_in' => false
)
$article = array(
'Article' => array(
'id' => '9112',
'article_category_id' => '1',
'title' => 'Nepal’s HDI value up, but below average in South Asia',
'sub_title' => '',
'summary' => 'September 17: Nepal’s HDI value for 2017 is 0.574 which puts the country in the medium human development category, according to a report published by UNDP. ',
'content' => '<div><span style="font-size:13px">September 17: Nepal’s HDI value for 2017 is 0.574 which puts the country in the medium human development category, according to a report published by UNDP. As per the report, Nepal lies in the 149th position out of 189 countries and territories surveyed by the organisation. </span></div>
<div> </div>
<div><span style="font-size:13px">The report further states that Nepal’s HDI value increased from 0.378 to 0.574 between 1990 and 2017, an increase of 51.9 percent. However, Nepal’s 2017 HDI of 0.574 is below the average of 0.645 for countries in the medium human development group and below the average of 0.638 for countries in South Asia.</span></div>
<div> </div>
<div><span style="font-size:13px">The HDI is a summary measure for assessing long-term progress in three basic dimensions of human development: a long and healthy life, access to knowledge and a decent standard of living. </span></div>
<div> </div>
<div><span style="font-size:13px">A long and healthy life is measured by life expectancy. Knowledge level is measured by mean years of education among the adult population, which is the average number of years of education received in a life-time by people aged 25 years and older; and access to learning and knowledge by expected years of schooling for children of school-entry age, which is the total number of years of schooling a child of school-entry age can expect to receive if prevailing patterns of age-specific enrolment rates stay the same throughout the child's life. Standard of living is measured by Gross National Income (GNI) per capita expressed in constant 2011 international dollars converted using purchasing power parity (PPP) conversion rates.</span></div>
<div> </div>
<div><span style="font-size:13px">Table A reviews Nepal’s progress in each of the HDI indicators. Between 1990 and 2017, Nepal’s life expectancy at birth increased by 16.3 years, mean years of schooling increased by 2.9 years and expected years of schooling increased by 4.7 years. Nepal’s GNI per capita increased by about 111.6 percent between 1990 and 2017.</span></div>
<div> </div>
<div>
<p> </p>
<h2>Table A: Nepal’s HDI trends based on consistent time series data and new goalposts</h2>
<table border="1" cellpadding="0" cellspacing="0">
<tbody>
<tr>
<td style="height:28px; width:103px">
<p> </p>
</td>
<td style="height:28px; width:105px">
<p style="margin-left:4.7pt"><strong>Life expectancy</strong></p>
<p style="margin-left:4.5pt"><strong>at birth</strong></p>
</td>
<td style="height:28px; width:104px">
<p style="margin-left:5.05pt"><strong>Expected years</strong></p>
<p style="margin-left:5.05pt"><strong>of schooling</strong></p>
</td>
<td style="height:28px; width:104px">
<p style="margin-left:7.95pt"><strong>Mean years of</strong></p>
<p style="margin-left:7.95pt"><strong>schooling</strong></p>
</td>
<td style="height:28px; width:104px">
<p style="margin-left:8.15pt"><strong>GNI per capita</strong></p>
<p style="margin-left:12.95pt"><strong>(2011 PPP$)</strong></p>
</td>
<td style="height:28px; width:103px">
<p style="margin-left:17.1pt"><strong>HDI value</strong></p>
</td>
</tr>
<tr>
<td style="height:14px; width:103px">
<p style="margin-left:27.6pt">1990</p>
</td>
<td style="height:14px; width:105px">
<p style="margin-left:4.5pt">54.3</p>
</td>
<td style="height:14px; width:104px">
<p style="margin-left:32.85pt">7.5</p>
</td>
<td style="height:14px; width:104px">
<p style="margin-left:7.95pt">2.0</p>
</td>
<td style="height:14px; width:104px">
<p style="margin-left:27.7pt">1,168</p>
</td>
<td style="height:14px; width:103px">
<p style="margin-left:17.1pt">0.378</p>
</td>
</tr>
<tr>
<td style="height:14px; width:103px">
<p style="margin-left:27.6pt">1995</p>
</td>
<td style="height:14px; width:105px">
<p style="margin-left:4.5pt">58.5</p>
</td>
<td style="height:14px; width:104px">
<p style="margin-left:32.85pt">8.1</p>
</td>
<td style="height:14px; width:104px">
<p style="margin-left:7.95pt">2.2</p>
</td>
<td style="height:14px; width:104px">
<p style="margin-left:27.7pt">1,322</p>
</td>
<td style="height:14px; width:103px">
<p style="margin-left:17.1pt">0.410</p>
</td>
</tr>
<tr>
<td style="height:14px; width:103px">
<p style="margin-left:27.6pt">2000</p>
</td>
<td style="height:14px; width:105px">
<p style="margin-left:4.5pt">62.4</p>
</td>
<td style="height:14px; width:104px">
<p style="margin-left:32.85pt">9.0</p>
</td>
<td style="height:14px; width:104px">
<p style="margin-left:7.95pt">2.4</p>
</td>
<td style="height:14px; width:104px">
<p style="margin-left:27.7pt">1,526</p>
</td>
<td style="height:14px; width:103px">
<p style="margin-left:17.1pt">0.446</p>
</td>
</tr>
<tr>
<td style="height:14px; width:103px">
<p style="margin-left:27.6pt">2005</p>
</td>
<td style="height:14px; width:105px">
<p style="margin-left:4.5pt">65.5</p>
</td>
<td style="height:14px; width:104px">
<p style="margin-left:32.85pt">9.6</p>
</td>
<td style="height:14px; width:104px">
<p style="margin-left:7.95pt">2.8</p>
</td>
<td style="height:14px; width:104px">
<p style="margin-left:27.7pt">1,689</p>
</td>
<td style="height:14px; width:103px">
<p style="margin-left:17.1pt">0.475</p>
</td>
</tr>
<tr>
<td style="height:14px; width:103px">
<p style="margin-left:27.6pt">2010</p>
</td>
<td style="height:14px; width:105px">
<p style="margin-left:4.5pt">67.9</p>
</td>
<td style="height:14px; width:104px">
<p style="margin-left:30.35pt">12.0</p>
</td>
<td style="height:14px; width:104px">
<p style="margin-left:7.95pt">3.3</p>
</td>
<td style="height:14px; width:104px">
<p style="margin-left:27.7pt">2,001</p>
</td>
<td style="height:14px; width:103px">
<p style="margin-left:17.1pt">0.529</p>
</td>
</tr>
<tr>
<td style="height:14px; width:103px">
<p style="margin-left:27.6pt">2015</p>
</td>
<td style="height:14px; width:105px">
<p style="margin-left:4.5pt">69.9</p>
</td>
<td style="height:14px; width:104px">
<p style="margin-left:30.35pt">12.2</p>
</td>
<td style="height:14px; width:104px">
<p style="margin-left:7.95pt">4.7</p>
</td>
<td style="height:14px; width:104px">
<p style="margin-left:27.7pt">2,353</p>
</td>
<td style="height:14px; width:103px">
<p style="margin-left:17.1pt">0.566</p>
</td>
</tr>
<tr>
<td style="height:14px; width:103px">
<p style="margin-left:27.6pt">2016</p>
</td>
<td style="height:14px; width:105px">
<p style="margin-left:4.5pt">70.3</p>
</td>
<td style="height:14px; width:104px">
<p style="margin-left:30.35pt">12.2</p>
</td>
<td style="height:14px; width:104px">
<p style="margin-left:7.95pt">4.9</p>
</td>
<td style="height:14px; width:104px">
<p style="margin-left:27.7pt">2,334</p>
</td>
<td style="height:14px; width:103px">
<p style="margin-left:17.1pt">0.569</p>
</td>
</tr>
<tr>
<td style="height:14px; width:103px">
<p style="margin-left:27.6pt">2017</p>
</td>
<td style="height:14px; width:105px">
<p style="margin-left:4.5pt">70.6</p>
</td>
<td style="height:14px; width:104px">
<p style="margin-left:30.35pt">12.2</p>
</td>
<td style="height:14px; width:104px">
<p style="margin-left:7.95pt">4.9</p>
</td>
<td style="height:14px; width:104px">
<p style="margin-left:27.7pt">2,471</p>
</td>
<td style="height:14px; width:103px">
<p style="margin-left:17.1pt">0.574</p>
</td>
</tr>
</tbody>
</table>
<p> </p>
</div>
',
'published' => true,
'created' => '2018-09-17',
'modified' => '2018-09-17',
'keywords' => '',
'description' => '',
'sortorder' => '8891',
'image' => '20180917043814_Clipboard01.jpg',
'article_date' => '2018-09-17 00:00:00',
'homepage' => false,
'breaking_news' => false,
'main_news' => true,
'in_scroller' => false,
'user_id' => '20'
),
'ArticleCategory' => array(
'id' => '1',
'name' => 'NEWS',
'parentOf' => '0',
'published' => true,
'registered' => '2015-07-20 00:00:00',
'sortorder' => '158',
'del_flag' => '0',
'homepage' => true,
'display_in_menu' => true,
'user_id' => '1',
'created' => '0000-00-00 00:00:00',
'modified' => '2018-11-22 11:58:49'
),
'User' => array(
'password' => '*****',
'id' => '20',
'user_detail_id' => '1',
'group_id' => '1',
'username' => 'nroy@newbusinessage.com',
'name' => 'Neeraj Roy',
'email' => 'nroy@newbusinessage.com',
'address' => '',
'gender' => '',
'access' => '1',
'phone' => '',
'access_type' => '0',
'activated' => false,
'sortorder' => '0',
'published' => '1',
'created' => '0000-00-00 00:00:00',
'last_login' => '0000-00-00 00:00:00',
'ip' => ''
),
'ArticleComment' => array(),
'ArticleFeature' => array(),
'ArticleHasAuthor' => array(),
'ArticleHasTag' => array(),
'ArticleView' => array(
(int) 0 => array(
'article_id' => '9112',
'hit' => '1466'
)
),
'Slider' => array()
)
$current_user = null
$logged_in = false
$image = 'https://old.newbusinessage.com/app/webroot/img/news/20180917043814_Clipboard01.jpg'
$user = null
include - APP/View/Articles/view.ctp, line 115
View::_evaluate() - CORE/Cake/View/View.php, line 971
View::_render() - CORE/Cake/View/View.php, line 933
View::render() - CORE/Cake/View/View.php, line 473
Controller::render() - CORE/Cake/Controller/Controller.php, line 968
Dispatcher::_invoke() - CORE/Cake/Routing/Dispatcher.php, line 200
Dispatcher::dispatch() - CORE/Cake/Routing/Dispatcher.php, line 167
[main] - APP/webroot/index.php, line 117
Notice (8): Trying to access array offset on value of type null [APP/View/Articles/view.ctp, line 115]
$user = $this->Session->read('Auth.User');
//find the group of logged user
$groupId = $user['Group']['id'];
$viewFile = '/var/www/html/newbusinessage.com/app/View/Articles/view.ctp'
$dataForView = array(
'article' => array(
'Article' => array(
'id' => '9112',
'article_category_id' => '1',
'title' => 'Nepal’s HDI value up, but below average in South Asia',
'sub_title' => '',
'summary' => 'September 17: Nepal’s HDI value for 2017 is 0.574 which puts the country in the medium human development category, according to a report published by UNDP. ',
'content' => '<div><span style="font-size:13px">September 17: Nepal’s HDI value for 2017 is 0.574 which puts the country in the medium human development category, according to a report published by UNDP. As per the report, Nepal lies in the 149th position out of 189 countries and territories surveyed by the organisation. </span></div>
<div> </div>
<div><span style="font-size:13px">The report further states that Nepal’s HDI value increased from 0.378 to 0.574 between 1990 and 2017, an increase of 51.9 percent. However, Nepal’s 2017 HDI of 0.574 is below the average of 0.645 for countries in the medium human development group and below the average of 0.638 for countries in South Asia.</span></div>
<div> </div>
<div><span style="font-size:13px">The HDI is a summary measure for assessing long-term progress in three basic dimensions of human development: a long and healthy life, access to knowledge and a decent standard of living. </span></div>
<div> </div>
<div><span style="font-size:13px">A long and healthy life is measured by life expectancy. Knowledge level is measured by mean years of education among the adult population, which is the average number of years of education received in a life-time by people aged 25 years and older; and access to learning and knowledge by expected years of schooling for children of school-entry age, which is the total number of years of schooling a child of school-entry age can expect to receive if prevailing patterns of age-specific enrolment rates stay the same throughout the child's life. Standard of living is measured by Gross National Income (GNI) per capita expressed in constant 2011 international dollars converted using purchasing power parity (PPP) conversion rates.</span></div>
<div> </div>
<div><span style="font-size:13px">Table A reviews Nepal’s progress in each of the HDI indicators. Between 1990 and 2017, Nepal’s life expectancy at birth increased by 16.3 years, mean years of schooling increased by 2.9 years and expected years of schooling increased by 4.7 years. Nepal’s GNI per capita increased by about 111.6 percent between 1990 and 2017.</span></div>
<div> </div>
<div>
<p> </p>
<h2>Table A: Nepal’s HDI trends based on consistent time series data and new goalposts</h2>
<table border="1" cellpadding="0" cellspacing="0">
<tbody>
<tr>
<td style="height:28px; width:103px">
<p> </p>
</td>
<td style="height:28px; width:105px">
<p style="margin-left:4.7pt"><strong>Life expectancy</strong></p>
<p style="margin-left:4.5pt"><strong>at birth</strong></p>
</td>
<td style="height:28px; width:104px">
<p style="margin-left:5.05pt"><strong>Expected years</strong></p>
<p style="margin-left:5.05pt"><strong>of schooling</strong></p>
</td>
<td style="height:28px; width:104px">
<p style="margin-left:7.95pt"><strong>Mean years of</strong></p>
<p style="margin-left:7.95pt"><strong>schooling</strong></p>
</td>
<td style="height:28px; width:104px">
<p style="margin-left:8.15pt"><strong>GNI per capita</strong></p>
<p style="margin-left:12.95pt"><strong>(2011 PPP$)</strong></p>
</td>
<td style="height:28px; width:103px">
<p style="margin-left:17.1pt"><strong>HDI value</strong></p>
</td>
</tr>
<tr>
<td style="height:14px; width:103px">
<p style="margin-left:27.6pt">1990</p>
</td>
<td style="height:14px; width:105px">
<p style="margin-left:4.5pt">54.3</p>
</td>
<td style="height:14px; width:104px">
<p style="margin-left:32.85pt">7.5</p>
</td>
<td style="height:14px; width:104px">
<p style="margin-left:7.95pt">2.0</p>
</td>
<td style="height:14px; width:104px">
<p style="margin-left:27.7pt">1,168</p>
</td>
<td style="height:14px; width:103px">
<p style="margin-left:17.1pt">0.378</p>
</td>
</tr>
<tr>
<td style="height:14px; width:103px">
<p style="margin-left:27.6pt">1995</p>
</td>
<td style="height:14px; width:105px">
<p style="margin-left:4.5pt">58.5</p>
</td>
<td style="height:14px; width:104px">
<p style="margin-left:32.85pt">8.1</p>
</td>
<td style="height:14px; width:104px">
<p style="margin-left:7.95pt">2.2</p>
</td>
<td style="height:14px; width:104px">
<p style="margin-left:27.7pt">1,322</p>
</td>
<td style="height:14px; width:103px">
<p style="margin-left:17.1pt">0.410</p>
</td>
</tr>
<tr>
<td style="height:14px; width:103px">
<p style="margin-left:27.6pt">2000</p>
</td>
<td style="height:14px; width:105px">
<p style="margin-left:4.5pt">62.4</p>
</td>
<td style="height:14px; width:104px">
<p style="margin-left:32.85pt">9.0</p>
</td>
<td style="height:14px; width:104px">
<p style="margin-left:7.95pt">2.4</p>
</td>
<td style="height:14px; width:104px">
<p style="margin-left:27.7pt">1,526</p>
</td>
<td style="height:14px; width:103px">
<p style="margin-left:17.1pt">0.446</p>
</td>
</tr>
<tr>
<td style="height:14px; width:103px">
<p style="margin-left:27.6pt">2005</p>
</td>
<td style="height:14px; width:105px">
<p style="margin-left:4.5pt">65.5</p>
</td>
<td style="height:14px; width:104px">
<p style="margin-left:32.85pt">9.6</p>
</td>
<td style="height:14px; width:104px">
<p style="margin-left:7.95pt">2.8</p>
</td>
<td style="height:14px; width:104px">
<p style="margin-left:27.7pt">1,689</p>
</td>
<td style="height:14px; width:103px">
<p style="margin-left:17.1pt">0.475</p>
</td>
</tr>
<tr>
<td style="height:14px; width:103px">
<p style="margin-left:27.6pt">2010</p>
</td>
<td style="height:14px; width:105px">
<p style="margin-left:4.5pt">67.9</p>
</td>
<td style="height:14px; width:104px">
<p style="margin-left:30.35pt">12.0</p>
</td>
<td style="height:14px; width:104px">
<p style="margin-left:7.95pt">3.3</p>
</td>
<td style="height:14px; width:104px">
<p style="margin-left:27.7pt">2,001</p>
</td>
<td style="height:14px; width:103px">
<p style="margin-left:17.1pt">0.529</p>
</td>
</tr>
<tr>
<td style="height:14px; width:103px">
<p style="margin-left:27.6pt">2015</p>
</td>
<td style="height:14px; width:105px">
<p style="margin-left:4.5pt">69.9</p>
</td>
<td style="height:14px; width:104px">
<p style="margin-left:30.35pt">12.2</p>
</td>
<td style="height:14px; width:104px">
<p style="margin-left:7.95pt">4.7</p>
</td>
<td style="height:14px; width:104px">
<p style="margin-left:27.7pt">2,353</p>
</td>
<td style="height:14px; width:103px">
<p style="margin-left:17.1pt">0.566</p>
</td>
</tr>
<tr>
<td style="height:14px; width:103px">
<p style="margin-left:27.6pt">2016</p>
</td>
<td style="height:14px; width:105px">
<p style="margin-left:4.5pt">70.3</p>
</td>
<td style="height:14px; width:104px">
<p style="margin-left:30.35pt">12.2</p>
</td>
<td style="height:14px; width:104px">
<p style="margin-left:7.95pt">4.9</p>
</td>
<td style="height:14px; width:104px">
<p style="margin-left:27.7pt">2,334</p>
</td>
<td style="height:14px; width:103px">
<p style="margin-left:17.1pt">0.569</p>
</td>
</tr>
<tr>
<td style="height:14px; width:103px">
<p style="margin-left:27.6pt">2017</p>
</td>
<td style="height:14px; width:105px">
<p style="margin-left:4.5pt">70.6</p>
</td>
<td style="height:14px; width:104px">
<p style="margin-left:30.35pt">12.2</p>
</td>
<td style="height:14px; width:104px">
<p style="margin-left:7.95pt">4.9</p>
</td>
<td style="height:14px; width:104px">
<p style="margin-left:27.7pt">2,471</p>
</td>
<td style="height:14px; width:103px">
<p style="margin-left:17.1pt">0.574</p>
</td>
</tr>
</tbody>
</table>
<p> </p>
</div>
',
'published' => true,
'created' => '2018-09-17',
'modified' => '2018-09-17',
'keywords' => '',
'description' => '',
'sortorder' => '8891',
'image' => '20180917043814_Clipboard01.jpg',
'article_date' => '2018-09-17 00:00:00',
'homepage' => false,
'breaking_news' => false,
'main_news' => true,
'in_scroller' => false,
'user_id' => '20'
),
'ArticleCategory' => array(
'id' => '1',
'name' => 'NEWS',
'parentOf' => '0',
'published' => true,
'registered' => '2015-07-20 00:00:00',
'sortorder' => '158',
'del_flag' => '0',
'homepage' => true,
'display_in_menu' => true,
'user_id' => '1',
'created' => '0000-00-00 00:00:00',
'modified' => '2018-11-22 11:58:49'
),
'User' => array(
'password' => '*****',
'id' => '20',
'user_detail_id' => '1',
'group_id' => '1',
'username' => 'nroy@newbusinessage.com',
'name' => 'Neeraj Roy',
'email' => 'nroy@newbusinessage.com',
'address' => '',
'gender' => '',
'access' => '1',
'phone' => '',
'access_type' => '0',
'activated' => false,
'sortorder' => '0',
'published' => '1',
'created' => '0000-00-00 00:00:00',
'last_login' => '0000-00-00 00:00:00',
'ip' => ''
),
'ArticleComment' => array(),
'ArticleFeature' => array(),
'ArticleHasAuthor' => array(),
'ArticleHasTag' => array(),
'ArticleView' => array(
(int) 0 => array(
[maximum depth reached]
)
),
'Slider' => array()
),
'current_user' => null,
'logged_in' => false
)
$article = array(
'Article' => array(
'id' => '9112',
'article_category_id' => '1',
'title' => 'Nepal’s HDI value up, but below average in South Asia',
'sub_title' => '',
'summary' => 'September 17: Nepal’s HDI value for 2017 is 0.574 which puts the country in the medium human development category, according to a report published by UNDP. ',
'content' => '<div><span style="font-size:13px">September 17: Nepal’s HDI value for 2017 is 0.574 which puts the country in the medium human development category, according to a report published by UNDP. As per the report, Nepal lies in the 149th position out of 189 countries and territories surveyed by the organisation. </span></div>
<div> </div>
<div><span style="font-size:13px">The report further states that Nepal’s HDI value increased from 0.378 to 0.574 between 1990 and 2017, an increase of 51.9 percent. However, Nepal’s 2017 HDI of 0.574 is below the average of 0.645 for countries in the medium human development group and below the average of 0.638 for countries in South Asia.</span></div>
<div> </div>
<div><span style="font-size:13px">The HDI is a summary measure for assessing long-term progress in three basic dimensions of human development: a long and healthy life, access to knowledge and a decent standard of living. </span></div>
<div> </div>
<div><span style="font-size:13px">A long and healthy life is measured by life expectancy. Knowledge level is measured by mean years of education among the adult population, which is the average number of years of education received in a life-time by people aged 25 years and older; and access to learning and knowledge by expected years of schooling for children of school-entry age, which is the total number of years of schooling a child of school-entry age can expect to receive if prevailing patterns of age-specific enrolment rates stay the same throughout the child's life. Standard of living is measured by Gross National Income (GNI) per capita expressed in constant 2011 international dollars converted using purchasing power parity (PPP) conversion rates.</span></div>
<div> </div>
<div><span style="font-size:13px">Table A reviews Nepal’s progress in each of the HDI indicators. Between 1990 and 2017, Nepal’s life expectancy at birth increased by 16.3 years, mean years of schooling increased by 2.9 years and expected years of schooling increased by 4.7 years. Nepal’s GNI per capita increased by about 111.6 percent between 1990 and 2017.</span></div>
<div> </div>
<div>
<p> </p>
<h2>Table A: Nepal’s HDI trends based on consistent time series data and new goalposts</h2>
<table border="1" cellpadding="0" cellspacing="0">
<tbody>
<tr>
<td style="height:28px; width:103px">
<p> </p>
</td>
<td style="height:28px; width:105px">
<p style="margin-left:4.7pt"><strong>Life expectancy</strong></p>
<p style="margin-left:4.5pt"><strong>at birth</strong></p>
</td>
<td style="height:28px; width:104px">
<p style="margin-left:5.05pt"><strong>Expected years</strong></p>
<p style="margin-left:5.05pt"><strong>of schooling</strong></p>
</td>
<td style="height:28px; width:104px">
<p style="margin-left:7.95pt"><strong>Mean years of</strong></p>
<p style="margin-left:7.95pt"><strong>schooling</strong></p>
</td>
<td style="height:28px; width:104px">
<p style="margin-left:8.15pt"><strong>GNI per capita</strong></p>
<p style="margin-left:12.95pt"><strong>(2011 PPP$)</strong></p>
</td>
<td style="height:28px; width:103px">
<p style="margin-left:17.1pt"><strong>HDI value</strong></p>
</td>
</tr>
<tr>
<td style="height:14px; width:103px">
<p style="margin-left:27.6pt">1990</p>
</td>
<td style="height:14px; width:105px">
<p style="margin-left:4.5pt">54.3</p>
</td>
<td style="height:14px; width:104px">
<p style="margin-left:32.85pt">7.5</p>
</td>
<td style="height:14px; width:104px">
<p style="margin-left:7.95pt">2.0</p>
</td>
<td style="height:14px; width:104px">
<p style="margin-left:27.7pt">1,168</p>
</td>
<td style="height:14px; width:103px">
<p style="margin-left:17.1pt">0.378</p>
</td>
</tr>
<tr>
<td style="height:14px; width:103px">
<p style="margin-left:27.6pt">1995</p>
</td>
<td style="height:14px; width:105px">
<p style="margin-left:4.5pt">58.5</p>
</td>
<td style="height:14px; width:104px">
<p style="margin-left:32.85pt">8.1</p>
</td>
<td style="height:14px; width:104px">
<p style="margin-left:7.95pt">2.2</p>
</td>
<td style="height:14px; width:104px">
<p style="margin-left:27.7pt">1,322</p>
</td>
<td style="height:14px; width:103px">
<p style="margin-left:17.1pt">0.410</p>
</td>
</tr>
<tr>
<td style="height:14px; width:103px">
<p style="margin-left:27.6pt">2000</p>
</td>
<td style="height:14px; width:105px">
<p style="margin-left:4.5pt">62.4</p>
</td>
<td style="height:14px; width:104px">
<p style="margin-left:32.85pt">9.0</p>
</td>
<td style="height:14px; width:104px">
<p style="margin-left:7.95pt">2.4</p>
</td>
<td style="height:14px; width:104px">
<p style="margin-left:27.7pt">1,526</p>
</td>
<td style="height:14px; width:103px">
<p style="margin-left:17.1pt">0.446</p>
</td>
</tr>
<tr>
<td style="height:14px; width:103px">
<p style="margin-left:27.6pt">2005</p>
</td>
<td style="height:14px; width:105px">
<p style="margin-left:4.5pt">65.5</p>
</td>
<td style="height:14px; width:104px">
<p style="margin-left:32.85pt">9.6</p>
</td>
<td style="height:14px; width:104px">
<p style="margin-left:7.95pt">2.8</p>
</td>
<td style="height:14px; width:104px">
<p style="margin-left:27.7pt">1,689</p>
</td>
<td style="height:14px; width:103px">
<p style="margin-left:17.1pt">0.475</p>
</td>
</tr>
<tr>
<td style="height:14px; width:103px">
<p style="margin-left:27.6pt">2010</p>
</td>
<td style="height:14px; width:105px">
<p style="margin-left:4.5pt">67.9</p>
</td>
<td style="height:14px; width:104px">
<p style="margin-left:30.35pt">12.0</p>
</td>
<td style="height:14px; width:104px">
<p style="margin-left:7.95pt">3.3</p>
</td>
<td style="height:14px; width:104px">
<p style="margin-left:27.7pt">2,001</p>
</td>
<td style="height:14px; width:103px">
<p style="margin-left:17.1pt">0.529</p>
</td>
</tr>
<tr>
<td style="height:14px; width:103px">
<p style="margin-left:27.6pt">2015</p>
</td>
<td style="height:14px; width:105px">
<p style="margin-left:4.5pt">69.9</p>
</td>
<td style="height:14px; width:104px">
<p style="margin-left:30.35pt">12.2</p>
</td>
<td style="height:14px; width:104px">
<p style="margin-left:7.95pt">4.7</p>
</td>
<td style="height:14px; width:104px">
<p style="margin-left:27.7pt">2,353</p>
</td>
<td style="height:14px; width:103px">
<p style="margin-left:17.1pt">0.566</p>
</td>
</tr>
<tr>
<td style="height:14px; width:103px">
<p style="margin-left:27.6pt">2016</p>
</td>
<td style="height:14px; width:105px">
<p style="margin-left:4.5pt">70.3</p>
</td>
<td style="height:14px; width:104px">
<p style="margin-left:30.35pt">12.2</p>
</td>
<td style="height:14px; width:104px">
<p style="margin-left:7.95pt">4.9</p>
</td>
<td style="height:14px; width:104px">
<p style="margin-left:27.7pt">2,334</p>
</td>
<td style="height:14px; width:103px">
<p style="margin-left:17.1pt">0.569</p>
</td>
</tr>
<tr>
<td style="height:14px; width:103px">
<p style="margin-left:27.6pt">2017</p>
</td>
<td style="height:14px; width:105px">
<p style="margin-left:4.5pt">70.6</p>
</td>
<td style="height:14px; width:104px">
<p style="margin-left:30.35pt">12.2</p>
</td>
<td style="height:14px; width:104px">
<p style="margin-left:7.95pt">4.9</p>
</td>
<td style="height:14px; width:104px">
<p style="margin-left:27.7pt">2,471</p>
</td>
<td style="height:14px; width:103px">
<p style="margin-left:17.1pt">0.574</p>
</td>
</tr>
</tbody>
</table>
<p> </p>
</div>
',
'published' => true,
'created' => '2018-09-17',
'modified' => '2018-09-17',
'keywords' => '',
'description' => '',
'sortorder' => '8891',
'image' => '20180917043814_Clipboard01.jpg',
'article_date' => '2018-09-17 00:00:00',
'homepage' => false,
'breaking_news' => false,
'main_news' => true,
'in_scroller' => false,
'user_id' => '20'
),
'ArticleCategory' => array(
'id' => '1',
'name' => 'NEWS',
'parentOf' => '0',
'published' => true,
'registered' => '2015-07-20 00:00:00',
'sortorder' => '158',
'del_flag' => '0',
'homepage' => true,
'display_in_menu' => true,
'user_id' => '1',
'created' => '0000-00-00 00:00:00',
'modified' => '2018-11-22 11:58:49'
),
'User' => array(
'password' => '*****',
'id' => '20',
'user_detail_id' => '1',
'group_id' => '1',
'username' => 'nroy@newbusinessage.com',
'name' => 'Neeraj Roy',
'email' => 'nroy@newbusinessage.com',
'address' => '',
'gender' => '',
'access' => '1',
'phone' => '',
'access_type' => '0',
'activated' => false,
'sortorder' => '0',
'published' => '1',
'created' => '0000-00-00 00:00:00',
'last_login' => '0000-00-00 00:00:00',
'ip' => ''
),
'ArticleComment' => array(),
'ArticleFeature' => array(),
'ArticleHasAuthor' => array(),
'ArticleHasTag' => array(),
'ArticleView' => array(
(int) 0 => array(
'article_id' => '9112',
'hit' => '1466'
)
),
'Slider' => array()
)
$current_user = null
$logged_in = false
$image = 'https://old.newbusinessage.com/app/webroot/img/news/20180917043814_Clipboard01.jpg'
$user = null
include - APP/View/Articles/view.ctp, line 115
View::_evaluate() - CORE/Cake/View/View.php, line 971
View::_render() - CORE/Cake/View/View.php, line 933
View::render() - CORE/Cake/View/View.php, line 473
Controller::render() - CORE/Cake/Controller/Controller.php, line 968
Dispatcher::_invoke() - CORE/Cake/Routing/Dispatcher.php, line 200
Dispatcher::dispatch() - CORE/Cake/Routing/Dispatcher.php, line 167
[main] - APP/webroot/index.php, line 117
Notice (8): Trying to access array offset on value of type null [APP/View/Articles/view.ctp, line 116]
//find the group of logged user
$groupId = $user['Group']['id'];
$user_id=$user["id"];
$viewFile = '/var/www/html/newbusinessage.com/app/View/Articles/view.ctp'
$dataForView = array(
'article' => array(
'Article' => array(
'id' => '9112',
'article_category_id' => '1',
'title' => 'Nepal’s HDI value up, but below average in South Asia',
'sub_title' => '',
'summary' => 'September 17: Nepal’s HDI value for 2017 is 0.574 which puts the country in the medium human development category, according to a report published by UNDP. ',
'content' => '<div><span style="font-size:13px">September 17: Nepal’s HDI value for 2017 is 0.574 which puts the country in the medium human development category, according to a report published by UNDP. As per the report, Nepal lies in the 149th position out of 189 countries and territories surveyed by the organisation. </span></div>
<div> </div>
<div><span style="font-size:13px">The report further states that Nepal’s HDI value increased from 0.378 to 0.574 between 1990 and 2017, an increase of 51.9 percent. However, Nepal’s 2017 HDI of 0.574 is below the average of 0.645 for countries in the medium human development group and below the average of 0.638 for countries in South Asia.</span></div>
<div> </div>
<div><span style="font-size:13px">The HDI is a summary measure for assessing long-term progress in three basic dimensions of human development: a long and healthy life, access to knowledge and a decent standard of living. </span></div>
<div> </div>
<div><span style="font-size:13px">A long and healthy life is measured by life expectancy. Knowledge level is measured by mean years of education among the adult population, which is the average number of years of education received in a life-time by people aged 25 years and older; and access to learning and knowledge by expected years of schooling for children of school-entry age, which is the total number of years of schooling a child of school-entry age can expect to receive if prevailing patterns of age-specific enrolment rates stay the same throughout the child's life. Standard of living is measured by Gross National Income (GNI) per capita expressed in constant 2011 international dollars converted using purchasing power parity (PPP) conversion rates.</span></div>
<div> </div>
<div><span style="font-size:13px">Table A reviews Nepal’s progress in each of the HDI indicators. Between 1990 and 2017, Nepal’s life expectancy at birth increased by 16.3 years, mean years of schooling increased by 2.9 years and expected years of schooling increased by 4.7 years. Nepal’s GNI per capita increased by about 111.6 percent between 1990 and 2017.</span></div>
<div> </div>
<div>
<p> </p>
<h2>Table A: Nepal’s HDI trends based on consistent time series data and new goalposts</h2>
<table border="1" cellpadding="0" cellspacing="0">
<tbody>
<tr>
<td style="height:28px; width:103px">
<p> </p>
</td>
<td style="height:28px; width:105px">
<p style="margin-left:4.7pt"><strong>Life expectancy</strong></p>
<p style="margin-left:4.5pt"><strong>at birth</strong></p>
</td>
<td style="height:28px; width:104px">
<p style="margin-left:5.05pt"><strong>Expected years</strong></p>
<p style="margin-left:5.05pt"><strong>of schooling</strong></p>
</td>
<td style="height:28px; width:104px">
<p style="margin-left:7.95pt"><strong>Mean years of</strong></p>
<p style="margin-left:7.95pt"><strong>schooling</strong></p>
</td>
<td style="height:28px; width:104px">
<p style="margin-left:8.15pt"><strong>GNI per capita</strong></p>
<p style="margin-left:12.95pt"><strong>(2011 PPP$)</strong></p>
</td>
<td style="height:28px; width:103px">
<p style="margin-left:17.1pt"><strong>HDI value</strong></p>
</td>
</tr>
<tr>
<td style="height:14px; width:103px">
<p style="margin-left:27.6pt">1990</p>
</td>
<td style="height:14px; width:105px">
<p style="margin-left:4.5pt">54.3</p>
</td>
<td style="height:14px; width:104px">
<p style="margin-left:32.85pt">7.5</p>
</td>
<td style="height:14px; width:104px">
<p style="margin-left:7.95pt">2.0</p>
</td>
<td style="height:14px; width:104px">
<p style="margin-left:27.7pt">1,168</p>
</td>
<td style="height:14px; width:103px">
<p style="margin-left:17.1pt">0.378</p>
</td>
</tr>
<tr>
<td style="height:14px; width:103px">
<p style="margin-left:27.6pt">1995</p>
</td>
<td style="height:14px; width:105px">
<p style="margin-left:4.5pt">58.5</p>
</td>
<td style="height:14px; width:104px">
<p style="margin-left:32.85pt">8.1</p>
</td>
<td style="height:14px; width:104px">
<p style="margin-left:7.95pt">2.2</p>
</td>
<td style="height:14px; width:104px">
<p style="margin-left:27.7pt">1,322</p>
</td>
<td style="height:14px; width:103px">
<p style="margin-left:17.1pt">0.410</p>
</td>
</tr>
<tr>
<td style="height:14px; width:103px">
<p style="margin-left:27.6pt">2000</p>
</td>
<td style="height:14px; width:105px">
<p style="margin-left:4.5pt">62.4</p>
</td>
<td style="height:14px; width:104px">
<p style="margin-left:32.85pt">9.0</p>
</td>
<td style="height:14px; width:104px">
<p style="margin-left:7.95pt">2.4</p>
</td>
<td style="height:14px; width:104px">
<p style="margin-left:27.7pt">1,526</p>
</td>
<td style="height:14px; width:103px">
<p style="margin-left:17.1pt">0.446</p>
</td>
</tr>
<tr>
<td style="height:14px; width:103px">
<p style="margin-left:27.6pt">2005</p>
</td>
<td style="height:14px; width:105px">
<p style="margin-left:4.5pt">65.5</p>
</td>
<td style="height:14px; width:104px">
<p style="margin-left:32.85pt">9.6</p>
</td>
<td style="height:14px; width:104px">
<p style="margin-left:7.95pt">2.8</p>
</td>
<td style="height:14px; width:104px">
<p style="margin-left:27.7pt">1,689</p>
</td>
<td style="height:14px; width:103px">
<p style="margin-left:17.1pt">0.475</p>
</td>
</tr>
<tr>
<td style="height:14px; width:103px">
<p style="margin-left:27.6pt">2010</p>
</td>
<td style="height:14px; width:105px">
<p style="margin-left:4.5pt">67.9</p>
</td>
<td style="height:14px; width:104px">
<p style="margin-left:30.35pt">12.0</p>
</td>
<td style="height:14px; width:104px">
<p style="margin-left:7.95pt">3.3</p>
</td>
<td style="height:14px; width:104px">
<p style="margin-left:27.7pt">2,001</p>
</td>
<td style="height:14px; width:103px">
<p style="margin-left:17.1pt">0.529</p>
</td>
</tr>
<tr>
<td style="height:14px; width:103px">
<p style="margin-left:27.6pt">2015</p>
</td>
<td style="height:14px; width:105px">
<p style="margin-left:4.5pt">69.9</p>
</td>
<td style="height:14px; width:104px">
<p style="margin-left:30.35pt">12.2</p>
</td>
<td style="height:14px; width:104px">
<p style="margin-left:7.95pt">4.7</p>
</td>
<td style="height:14px; width:104px">
<p style="margin-left:27.7pt">2,353</p>
</td>
<td style="height:14px; width:103px">
<p style="margin-left:17.1pt">0.566</p>
</td>
</tr>
<tr>
<td style="height:14px; width:103px">
<p style="margin-left:27.6pt">2016</p>
</td>
<td style="height:14px; width:105px">
<p style="margin-left:4.5pt">70.3</p>
</td>
<td style="height:14px; width:104px">
<p style="margin-left:30.35pt">12.2</p>
</td>
<td style="height:14px; width:104px">
<p style="margin-left:7.95pt">4.9</p>
</td>
<td style="height:14px; width:104px">
<p style="margin-left:27.7pt">2,334</p>
</td>
<td style="height:14px; width:103px">
<p style="margin-left:17.1pt">0.569</p>
</td>
</tr>
<tr>
<td style="height:14px; width:103px">
<p style="margin-left:27.6pt">2017</p>
</td>
<td style="height:14px; width:105px">
<p style="margin-left:4.5pt">70.6</p>
</td>
<td style="height:14px; width:104px">
<p style="margin-left:30.35pt">12.2</p>
</td>
<td style="height:14px; width:104px">
<p style="margin-left:7.95pt">4.9</p>
</td>
<td style="height:14px; width:104px">
<p style="margin-left:27.7pt">2,471</p>
</td>
<td style="height:14px; width:103px">
<p style="margin-left:17.1pt">0.574</p>
</td>
</tr>
</tbody>
</table>
<p> </p>
</div>
',
'published' => true,
'created' => '2018-09-17',
'modified' => '2018-09-17',
'keywords' => '',
'description' => '',
'sortorder' => '8891',
'image' => '20180917043814_Clipboard01.jpg',
'article_date' => '2018-09-17 00:00:00',
'homepage' => false,
'breaking_news' => false,
'main_news' => true,
'in_scroller' => false,
'user_id' => '20'
),
'ArticleCategory' => array(
'id' => '1',
'name' => 'NEWS',
'parentOf' => '0',
'published' => true,
'registered' => '2015-07-20 00:00:00',
'sortorder' => '158',
'del_flag' => '0',
'homepage' => true,
'display_in_menu' => true,
'user_id' => '1',
'created' => '0000-00-00 00:00:00',
'modified' => '2018-11-22 11:58:49'
),
'User' => array(
'password' => '*****',
'id' => '20',
'user_detail_id' => '1',
'group_id' => '1',
'username' => 'nroy@newbusinessage.com',
'name' => 'Neeraj Roy',
'email' => 'nroy@newbusinessage.com',
'address' => '',
'gender' => '',
'access' => '1',
'phone' => '',
'access_type' => '0',
'activated' => false,
'sortorder' => '0',
'published' => '1',
'created' => '0000-00-00 00:00:00',
'last_login' => '0000-00-00 00:00:00',
'ip' => ''
),
'ArticleComment' => array(),
'ArticleFeature' => array(),
'ArticleHasAuthor' => array(),
'ArticleHasTag' => array(),
'ArticleView' => array(
(int) 0 => array(
[maximum depth reached]
)
),
'Slider' => array()
),
'current_user' => null,
'logged_in' => false
)
$article = array(
'Article' => array(
'id' => '9112',
'article_category_id' => '1',
'title' => 'Nepal’s HDI value up, but below average in South Asia',
'sub_title' => '',
'summary' => 'September 17: Nepal’s HDI value for 2017 is 0.574 which puts the country in the medium human development category, according to a report published by UNDP. ',
'content' => '<div><span style="font-size:13px">September 17: Nepal’s HDI value for 2017 is 0.574 which puts the country in the medium human development category, according to a report published by UNDP. As per the report, Nepal lies in the 149th position out of 189 countries and territories surveyed by the organisation. </span></div>
<div> </div>
<div><span style="font-size:13px">The report further states that Nepal’s HDI value increased from 0.378 to 0.574 between 1990 and 2017, an increase of 51.9 percent. However, Nepal’s 2017 HDI of 0.574 is below the average of 0.645 for countries in the medium human development group and below the average of 0.638 for countries in South Asia.</span></div>
<div> </div>
<div><span style="font-size:13px">The HDI is a summary measure for assessing long-term progress in three basic dimensions of human development: a long and healthy life, access to knowledge and a decent standard of living. </span></div>
<div> </div>
<div><span style="font-size:13px">A long and healthy life is measured by life expectancy. Knowledge level is measured by mean years of education among the adult population, which is the average number of years of education received in a life-time by people aged 25 years and older; and access to learning and knowledge by expected years of schooling for children of school-entry age, which is the total number of years of schooling a child of school-entry age can expect to receive if prevailing patterns of age-specific enrolment rates stay the same throughout the child's life. Standard of living is measured by Gross National Income (GNI) per capita expressed in constant 2011 international dollars converted using purchasing power parity (PPP) conversion rates.</span></div>
<div> </div>
<div><span style="font-size:13px">Table A reviews Nepal’s progress in each of the HDI indicators. Between 1990 and 2017, Nepal’s life expectancy at birth increased by 16.3 years, mean years of schooling increased by 2.9 years and expected years of schooling increased by 4.7 years. Nepal’s GNI per capita increased by about 111.6 percent between 1990 and 2017.</span></div>
<div> </div>
<div>
<p> </p>
<h2>Table A: Nepal’s HDI trends based on consistent time series data and new goalposts</h2>
<table border="1" cellpadding="0" cellspacing="0">
<tbody>
<tr>
<td style="height:28px; width:103px">
<p> </p>
</td>
<td style="height:28px; width:105px">
<p style="margin-left:4.7pt"><strong>Life expectancy</strong></p>
<p style="margin-left:4.5pt"><strong>at birth</strong></p>
</td>
<td style="height:28px; width:104px">
<p style="margin-left:5.05pt"><strong>Expected years</strong></p>
<p style="margin-left:5.05pt"><strong>of schooling</strong></p>
</td>
<td style="height:28px; width:104px">
<p style="margin-left:7.95pt"><strong>Mean years of</strong></p>
<p style="margin-left:7.95pt"><strong>schooling</strong></p>
</td>
<td style="height:28px; width:104px">
<p style="margin-left:8.15pt"><strong>GNI per capita</strong></p>
<p style="margin-left:12.95pt"><strong>(2011 PPP$)</strong></p>
</td>
<td style="height:28px; width:103px">
<p style="margin-left:17.1pt"><strong>HDI value</strong></p>
</td>
</tr>
<tr>
<td style="height:14px; width:103px">
<p style="margin-left:27.6pt">1990</p>
</td>
<td style="height:14px; width:105px">
<p style="margin-left:4.5pt">54.3</p>
</td>
<td style="height:14px; width:104px">
<p style="margin-left:32.85pt">7.5</p>
</td>
<td style="height:14px; width:104px">
<p style="margin-left:7.95pt">2.0</p>
</td>
<td style="height:14px; width:104px">
<p style="margin-left:27.7pt">1,168</p>
</td>
<td style="height:14px; width:103px">
<p style="margin-left:17.1pt">0.378</p>
</td>
</tr>
<tr>
<td style="height:14px; width:103px">
<p style="margin-left:27.6pt">1995</p>
</td>
<td style="height:14px; width:105px">
<p style="margin-left:4.5pt">58.5</p>
</td>
<td style="height:14px; width:104px">
<p style="margin-left:32.85pt">8.1</p>
</td>
<td style="height:14px; width:104px">
<p style="margin-left:7.95pt">2.2</p>
</td>
<td style="height:14px; width:104px">
<p style="margin-left:27.7pt">1,322</p>
</td>
<td style="height:14px; width:103px">
<p style="margin-left:17.1pt">0.410</p>
</td>
</tr>
<tr>
<td style="height:14px; width:103px">
<p style="margin-left:27.6pt">2000</p>
</td>
<td style="height:14px; width:105px">
<p style="margin-left:4.5pt">62.4</p>
</td>
<td style="height:14px; width:104px">
<p style="margin-left:32.85pt">9.0</p>
</td>
<td style="height:14px; width:104px">
<p style="margin-left:7.95pt">2.4</p>
</td>
<td style="height:14px; width:104px">
<p style="margin-left:27.7pt">1,526</p>
</td>
<td style="height:14px; width:103px">
<p style="margin-left:17.1pt">0.446</p>
</td>
</tr>
<tr>
<td style="height:14px; width:103px">
<p style="margin-left:27.6pt">2005</p>
</td>
<td style="height:14px; width:105px">
<p style="margin-left:4.5pt">65.5</p>
</td>
<td style="height:14px; width:104px">
<p style="margin-left:32.85pt">9.6</p>
</td>
<td style="height:14px; width:104px">
<p style="margin-left:7.95pt">2.8</p>
</td>
<td style="height:14px; width:104px">
<p style="margin-left:27.7pt">1,689</p>
</td>
<td style="height:14px; width:103px">
<p style="margin-left:17.1pt">0.475</p>
</td>
</tr>
<tr>
<td style="height:14px; width:103px">
<p style="margin-left:27.6pt">2010</p>
</td>
<td style="height:14px; width:105px">
<p style="margin-left:4.5pt">67.9</p>
</td>
<td style="height:14px; width:104px">
<p style="margin-left:30.35pt">12.0</p>
</td>
<td style="height:14px; width:104px">
<p style="margin-left:7.95pt">3.3</p>
</td>
<td style="height:14px; width:104px">
<p style="margin-left:27.7pt">2,001</p>
</td>
<td style="height:14px; width:103px">
<p style="margin-left:17.1pt">0.529</p>
</td>
</tr>
<tr>
<td style="height:14px; width:103px">
<p style="margin-left:27.6pt">2015</p>
</td>
<td style="height:14px; width:105px">
<p style="margin-left:4.5pt">69.9</p>
</td>
<td style="height:14px; width:104px">
<p style="margin-left:30.35pt">12.2</p>
</td>
<td style="height:14px; width:104px">
<p style="margin-left:7.95pt">4.7</p>
</td>
<td style="height:14px; width:104px">
<p style="margin-left:27.7pt">2,353</p>
</td>
<td style="height:14px; width:103px">
<p style="margin-left:17.1pt">0.566</p>
</td>
</tr>
<tr>
<td style="height:14px; width:103px">
<p style="margin-left:27.6pt">2016</p>
</td>
<td style="height:14px; width:105px">
<p style="margin-left:4.5pt">70.3</p>
</td>
<td style="height:14px; width:104px">
<p style="margin-left:30.35pt">12.2</p>
</td>
<td style="height:14px; width:104px">
<p style="margin-left:7.95pt">4.9</p>
</td>
<td style="height:14px; width:104px">
<p style="margin-left:27.7pt">2,334</p>
</td>
<td style="height:14px; width:103px">
<p style="margin-left:17.1pt">0.569</p>
</td>
</tr>
<tr>
<td style="height:14px; width:103px">
<p style="margin-left:27.6pt">2017</p>
</td>
<td style="height:14px; width:105px">
<p style="margin-left:4.5pt">70.6</p>
</td>
<td style="height:14px; width:104px">
<p style="margin-left:30.35pt">12.2</p>
</td>
<td style="height:14px; width:104px">
<p style="margin-left:7.95pt">4.9</p>
</td>
<td style="height:14px; width:104px">
<p style="margin-left:27.7pt">2,471</p>
</td>
<td style="height:14px; width:103px">
<p style="margin-left:17.1pt">0.574</p>
</td>
</tr>
</tbody>
</table>
<p> </p>
</div>
',
'published' => true,
'created' => '2018-09-17',
'modified' => '2018-09-17',
'keywords' => '',
'description' => '',
'sortorder' => '8891',
'image' => '20180917043814_Clipboard01.jpg',
'article_date' => '2018-09-17 00:00:00',
'homepage' => false,
'breaking_news' => false,
'main_news' => true,
'in_scroller' => false,
'user_id' => '20'
),
'ArticleCategory' => array(
'id' => '1',
'name' => 'NEWS',
'parentOf' => '0',
'published' => true,
'registered' => '2015-07-20 00:00:00',
'sortorder' => '158',
'del_flag' => '0',
'homepage' => true,
'display_in_menu' => true,
'user_id' => '1',
'created' => '0000-00-00 00:00:00',
'modified' => '2018-11-22 11:58:49'
),
'User' => array(
'password' => '*****',
'id' => '20',
'user_detail_id' => '1',
'group_id' => '1',
'username' => 'nroy@newbusinessage.com',
'name' => 'Neeraj Roy',
'email' => 'nroy@newbusinessage.com',
'address' => '',
'gender' => '',
'access' => '1',
'phone' => '',
'access_type' => '0',
'activated' => false,
'sortorder' => '0',
'published' => '1',
'created' => '0000-00-00 00:00:00',
'last_login' => '0000-00-00 00:00:00',
'ip' => ''
),
'ArticleComment' => array(),
'ArticleFeature' => array(),
'ArticleHasAuthor' => array(),
'ArticleHasTag' => array(),
'ArticleView' => array(
(int) 0 => array(
'article_id' => '9112',
'hit' => '1466'
)
),
'Slider' => array()
)
$current_user = null
$logged_in = false
$image = 'https://old.newbusinessage.com/app/webroot/img/news/20180917043814_Clipboard01.jpg'
$user = null
$groupId = null
include - APP/View/Articles/view.ctp, line 116
View::_evaluate() - CORE/Cake/View/View.php, line 971
View::_render() - CORE/Cake/View/View.php, line 933
View::render() - CORE/Cake/View/View.php, line 473
Controller::render() - CORE/Cake/Controller/Controller.php, line 968
Dispatcher::_invoke() - CORE/Cake/Routing/Dispatcher.php, line 200
Dispatcher::dispatch() - CORE/Cake/Routing/Dispatcher.php, line 167
[main] - APP/webroot/index.php, line 117
$viewFile = '/var/www/html/newbusinessage.com/app/View/Articles/view.ctp'
$dataForView = array(
'article' => array(
'Article' => array(
'id' => '9112',
'article_category_id' => '1',
'title' => 'Nepal’s HDI value up, but below average in South Asia',
'sub_title' => '',
'summary' => 'September 17: Nepal’s HDI value for 2017 is 0.574 which puts the country in the medium human development category, according to a report published by UNDP. ',
'content' => '<div><span style="font-size:13px">September 17: Nepal’s HDI value for 2017 is 0.574 which puts the country in the medium human development category, according to a report published by UNDP. As per the report, Nepal lies in the 149th position out of 189 countries and territories surveyed by the organisation. </span></div>
<div> </div>
<div><span style="font-size:13px">The report further states that Nepal’s HDI value increased from 0.378 to 0.574 between 1990 and 2017, an increase of 51.9 percent. However, Nepal’s 2017 HDI of 0.574 is below the average of 0.645 for countries in the medium human development group and below the average of 0.638 for countries in South Asia.</span></div>
<div> </div>
<div><span style="font-size:13px">The HDI is a summary measure for assessing long-term progress in three basic dimensions of human development: a long and healthy life, access to knowledge and a decent standard of living. </span></div>
<div> </div>
<div><span style="font-size:13px">A long and healthy life is measured by life expectancy. Knowledge level is measured by mean years of education among the adult population, which is the average number of years of education received in a life-time by people aged 25 years and older; and access to learning and knowledge by expected years of schooling for children of school-entry age, which is the total number of years of schooling a child of school-entry age can expect to receive if prevailing patterns of age-specific enrolment rates stay the same throughout the child's life. Standard of living is measured by Gross National Income (GNI) per capita expressed in constant 2011 international dollars converted using purchasing power parity (PPP) conversion rates.</span></div>
<div> </div>
<div><span style="font-size:13px">Table A reviews Nepal’s progress in each of the HDI indicators. Between 1990 and 2017, Nepal’s life expectancy at birth increased by 16.3 years, mean years of schooling increased by 2.9 years and expected years of schooling increased by 4.7 years. Nepal’s GNI per capita increased by about 111.6 percent between 1990 and 2017.</span></div>
<div> </div>
<div>
<p> </p>
<h2>Table A: Nepal’s HDI trends based on consistent time series data and new goalposts</h2>
<table border="1" cellpadding="0" cellspacing="0">
<tbody>
<tr>
<td style="height:28px; width:103px">
<p> </p>
</td>
<td style="height:28px; width:105px">
<p style="margin-left:4.7pt"><strong>Life expectancy</strong></p>
<p style="margin-left:4.5pt"><strong>at birth</strong></p>
</td>
<td style="height:28px; width:104px">
<p style="margin-left:5.05pt"><strong>Expected years</strong></p>
<p style="margin-left:5.05pt"><strong>of schooling</strong></p>
</td>
<td style="height:28px; width:104px">
<p style="margin-left:7.95pt"><strong>Mean years of</strong></p>
<p style="margin-left:7.95pt"><strong>schooling</strong></p>
</td>
<td style="height:28px; width:104px">
<p style="margin-left:8.15pt"><strong>GNI per capita</strong></p>
<p style="margin-left:12.95pt"><strong>(2011 PPP$)</strong></p>
</td>
<td style="height:28px; width:103px">
<p style="margin-left:17.1pt"><strong>HDI value</strong></p>
</td>
</tr>
<tr>
<td style="height:14px; width:103px">
<p style="margin-left:27.6pt">1990</p>
</td>
<td style="height:14px; width:105px">
<p style="margin-left:4.5pt">54.3</p>
</td>
<td style="height:14px; width:104px">
<p style="margin-left:32.85pt">7.5</p>
</td>
<td style="height:14px; width:104px">
<p style="margin-left:7.95pt">2.0</p>
</td>
<td style="height:14px; width:104px">
<p style="margin-left:27.7pt">1,168</p>
</td>
<td style="height:14px; width:103px">
<p style="margin-left:17.1pt">0.378</p>
</td>
</tr>
<tr>
<td style="height:14px; width:103px">
<p style="margin-left:27.6pt">1995</p>
</td>
<td style="height:14px; width:105px">
<p style="margin-left:4.5pt">58.5</p>
</td>
<td style="height:14px; width:104px">
<p style="margin-left:32.85pt">8.1</p>
</td>
<td style="height:14px; width:104px">
<p style="margin-left:7.95pt">2.2</p>
</td>
<td style="height:14px; width:104px">
<p style="margin-left:27.7pt">1,322</p>
</td>
<td style="height:14px; width:103px">
<p style="margin-left:17.1pt">0.410</p>
</td>
</tr>
<tr>
<td style="height:14px; width:103px">
<p style="margin-left:27.6pt">2000</p>
</td>
<td style="height:14px; width:105px">
<p style="margin-left:4.5pt">62.4</p>
</td>
<td style="height:14px; width:104px">
<p style="margin-left:32.85pt">9.0</p>
</td>
<td style="height:14px; width:104px">
<p style="margin-left:7.95pt">2.4</p>
</td>
<td style="height:14px; width:104px">
<p style="margin-left:27.7pt">1,526</p>
</td>
<td style="height:14px; width:103px">
<p style="margin-left:17.1pt">0.446</p>
</td>
</tr>
<tr>
<td style="height:14px; width:103px">
<p style="margin-left:27.6pt">2005</p>
</td>
<td style="height:14px; width:105px">
<p style="margin-left:4.5pt">65.5</p>
</td>
<td style="height:14px; width:104px">
<p style="margin-left:32.85pt">9.6</p>
</td>
<td style="height:14px; width:104px">
<p style="margin-left:7.95pt">2.8</p>
</td>
<td style="height:14px; width:104px">
<p style="margin-left:27.7pt">1,689</p>
</td>
<td style="height:14px; width:103px">
<p style="margin-left:17.1pt">0.475</p>
</td>
</tr>
<tr>
<td style="height:14px; width:103px">
<p style="margin-left:27.6pt">2010</p>
</td>
<td style="height:14px; width:105px">
<p style="margin-left:4.5pt">67.9</p>
</td>
<td style="height:14px; width:104px">
<p style="margin-left:30.35pt">12.0</p>
</td>
<td style="height:14px; width:104px">
<p style="margin-left:7.95pt">3.3</p>
</td>
<td style="height:14px; width:104px">
<p style="margin-left:27.7pt">2,001</p>
</td>
<td style="height:14px; width:103px">
<p style="margin-left:17.1pt">0.529</p>
</td>
</tr>
<tr>
<td style="height:14px; width:103px">
<p style="margin-left:27.6pt">2015</p>
</td>
<td style="height:14px; width:105px">
<p style="margin-left:4.5pt">69.9</p>
</td>
<td style="height:14px; width:104px">
<p style="margin-left:30.35pt">12.2</p>
</td>
<td style="height:14px; width:104px">
<p style="margin-left:7.95pt">4.7</p>
</td>
<td style="height:14px; width:104px">
<p style="margin-left:27.7pt">2,353</p>
</td>
<td style="height:14px; width:103px">
<p style="margin-left:17.1pt">0.566</p>
</td>
</tr>
<tr>
<td style="height:14px; width:103px">
<p style="margin-left:27.6pt">2016</p>
</td>
<td style="height:14px; width:105px">
<p style="margin-left:4.5pt">70.3</p>
</td>
<td style="height:14px; width:104px">
<p style="margin-left:30.35pt">12.2</p>
</td>
<td style="height:14px; width:104px">
<p style="margin-left:7.95pt">4.9</p>
</td>
<td style="height:14px; width:104px">
<p style="margin-left:27.7pt">2,334</p>
</td>
<td style="height:14px; width:103px">
<p style="margin-left:17.1pt">0.569</p>
</td>
</tr>
<tr>
<td style="height:14px; width:103px">
<p style="margin-left:27.6pt">2017</p>
</td>
<td style="height:14px; width:105px">
<p style="margin-left:4.5pt">70.6</p>
</td>
<td style="height:14px; width:104px">
<p style="margin-left:30.35pt">12.2</p>
</td>
<td style="height:14px; width:104px">
<p style="margin-left:7.95pt">4.9</p>
</td>
<td style="height:14px; width:104px">
<p style="margin-left:27.7pt">2,471</p>
</td>
<td style="height:14px; width:103px">
<p style="margin-left:17.1pt">0.574</p>
</td>
</tr>
</tbody>
</table>
<p> </p>
</div>
',
'published' => true,
'created' => '2018-09-17',
'modified' => '2018-09-17',
'keywords' => '',
'description' => '',
'sortorder' => '8891',
'image' => '20180917043814_Clipboard01.jpg',
'article_date' => '2018-09-17 00:00:00',
'homepage' => false,
'breaking_news' => false,
'main_news' => true,
'in_scroller' => false,
'user_id' => '20'
),
'ArticleCategory' => array(
'id' => '1',
'name' => 'NEWS',
'parentOf' => '0',
'published' => true,
'registered' => '2015-07-20 00:00:00',
'sortorder' => '158',
'del_flag' => '0',
'homepage' => true,
'display_in_menu' => true,
'user_id' => '1',
'created' => '0000-00-00 00:00:00',
'modified' => '2018-11-22 11:58:49'
),
'User' => array(
'password' => '*****',
'id' => '20',
'user_detail_id' => '1',
'group_id' => '1',
'username' => 'nroy@newbusinessage.com',
'name' => 'Neeraj Roy',
'email' => 'nroy@newbusinessage.com',
'address' => '',
'gender' => '',
'access' => '1',
'phone' => '',
'access_type' => '0',
'activated' => false,
'sortorder' => '0',
'published' => '1',
'created' => '0000-00-00 00:00:00',
'last_login' => '0000-00-00 00:00:00',
'ip' => ''
),
'ArticleComment' => array(),
'ArticleFeature' => array(),
'ArticleHasAuthor' => array(),
'ArticleHasTag' => array(),
'ArticleView' => array(
(int) 0 => array(
[maximum depth reached]
)
),
'Slider' => array()
),
'current_user' => null,
'logged_in' => false
)
$article = array(
'Article' => array(
'id' => '9112',
'article_category_id' => '1',
'title' => 'Nepal’s HDI value up, but below average in South Asia',
'sub_title' => '',
'summary' => 'September 17: Nepal’s HDI value for 2017 is 0.574 which puts the country in the medium human development category, according to a report published by UNDP. ',
'content' => '<div><span style="font-size:13px">September 17: Nepal’s HDI value for 2017 is 0.574 which puts the country in the medium human development category, according to a report published by UNDP. As per the report, Nepal lies in the 149th position out of 189 countries and territories surveyed by the organisation. </span></div>
<div> </div>
<div><span style="font-size:13px">The report further states that Nepal’s HDI value increased from 0.378 to 0.574 between 1990 and 2017, an increase of 51.9 percent. However, Nepal’s 2017 HDI of 0.574 is below the average of 0.645 for countries in the medium human development group and below the average of 0.638 for countries in South Asia.</span></div>
<div> </div>
<div><span style="font-size:13px">The HDI is a summary measure for assessing long-term progress in three basic dimensions of human development: a long and healthy life, access to knowledge and a decent standard of living. </span></div>
<div> </div>
<div><span style="font-size:13px">A long and healthy life is measured by life expectancy. Knowledge level is measured by mean years of education among the adult population, which is the average number of years of education received in a life-time by people aged 25 years and older; and access to learning and knowledge by expected years of schooling for children of school-entry age, which is the total number of years of schooling a child of school-entry age can expect to receive if prevailing patterns of age-specific enrolment rates stay the same throughout the child's life. Standard of living is measured by Gross National Income (GNI) per capita expressed in constant 2011 international dollars converted using purchasing power parity (PPP) conversion rates.</span></div>
<div> </div>
<div><span style="font-size:13px">Table A reviews Nepal’s progress in each of the HDI indicators. Between 1990 and 2017, Nepal’s life expectancy at birth increased by 16.3 years, mean years of schooling increased by 2.9 years and expected years of schooling increased by 4.7 years. Nepal’s GNI per capita increased by about 111.6 percent between 1990 and 2017.</span></div>
<div> </div>
<div>
<p> </p>
<h2>Table A: Nepal’s HDI trends based on consistent time series data and new goalposts</h2>
<table border="1" cellpadding="0" cellspacing="0">
<tbody>
<tr>
<td style="height:28px; width:103px">
<p> </p>
</td>
<td style="height:28px; width:105px">
<p style="margin-left:4.7pt"><strong>Life expectancy</strong></p>
<p style="margin-left:4.5pt"><strong>at birth</strong></p>
</td>
<td style="height:28px; width:104px">
<p style="margin-left:5.05pt"><strong>Expected years</strong></p>
<p style="margin-left:5.05pt"><strong>of schooling</strong></p>
</td>
<td style="height:28px; width:104px">
<p style="margin-left:7.95pt"><strong>Mean years of</strong></p>
<p style="margin-left:7.95pt"><strong>schooling</strong></p>
</td>
<td style="height:28px; width:104px">
<p style="margin-left:8.15pt"><strong>GNI per capita</strong></p>
<p style="margin-left:12.95pt"><strong>(2011 PPP$)</strong></p>
</td>
<td style="height:28px; width:103px">
<p style="margin-left:17.1pt"><strong>HDI value</strong></p>
</td>
</tr>
<tr>
<td style="height:14px; width:103px">
<p style="margin-left:27.6pt">1990</p>
</td>
<td style="height:14px; width:105px">
<p style="margin-left:4.5pt">54.3</p>
</td>
<td style="height:14px; width:104px">
<p style="margin-left:32.85pt">7.5</p>
</td>
<td style="height:14px; width:104px">
<p style="margin-left:7.95pt">2.0</p>
</td>
<td style="height:14px; width:104px">
<p style="margin-left:27.7pt">1,168</p>
</td>
<td style="height:14px; width:103px">
<p style="margin-left:17.1pt">0.378</p>
</td>
</tr>
<tr>
<td style="height:14px; width:103px">
<p style="margin-left:27.6pt">1995</p>
</td>
<td style="height:14px; width:105px">
<p style="margin-left:4.5pt">58.5</p>
</td>
<td style="height:14px; width:104px">
<p style="margin-left:32.85pt">8.1</p>
</td>
<td style="height:14px; width:104px">
<p style="margin-left:7.95pt">2.2</p>
</td>
<td style="height:14px; width:104px">
<p style="margin-left:27.7pt">1,322</p>
</td>
<td style="height:14px; width:103px">
<p style="margin-left:17.1pt">0.410</p>
</td>
</tr>
<tr>
<td style="height:14px; width:103px">
<p style="margin-left:27.6pt">2000</p>
</td>
<td style="height:14px; width:105px">
<p style="margin-left:4.5pt">62.4</p>
</td>
<td style="height:14px; width:104px">
<p style="margin-left:32.85pt">9.0</p>
</td>
<td style="height:14px; width:104px">
<p style="margin-left:7.95pt">2.4</p>
</td>
<td style="height:14px; width:104px">
<p style="margin-left:27.7pt">1,526</p>
</td>
<td style="height:14px; width:103px">
<p style="margin-left:17.1pt">0.446</p>
</td>
</tr>
<tr>
<td style="height:14px; width:103px">
<p style="margin-left:27.6pt">2005</p>
</td>
<td style="height:14px; width:105px">
<p style="margin-left:4.5pt">65.5</p>
</td>
<td style="height:14px; width:104px">
<p style="margin-left:32.85pt">9.6</p>
</td>
<td style="height:14px; width:104px">
<p style="margin-left:7.95pt">2.8</p>
</td>
<td style="height:14px; width:104px">
<p style="margin-left:27.7pt">1,689</p>
</td>
<td style="height:14px; width:103px">
<p style="margin-left:17.1pt">0.475</p>
</td>
</tr>
<tr>
<td style="height:14px; width:103px">
<p style="margin-left:27.6pt">2010</p>
</td>
<td style="height:14px; width:105px">
<p style="margin-left:4.5pt">67.9</p>
</td>
<td style="height:14px; width:104px">
<p style="margin-left:30.35pt">12.0</p>
</td>
<td style="height:14px; width:104px">
<p style="margin-left:7.95pt">3.3</p>
</td>
<td style="height:14px; width:104px">
<p style="margin-left:27.7pt">2,001</p>
</td>
<td style="height:14px; width:103px">
<p style="margin-left:17.1pt">0.529</p>
</td>
</tr>
<tr>
<td style="height:14px; width:103px">
<p style="margin-left:27.6pt">2015</p>
</td>
<td style="height:14px; width:105px">
<p style="margin-left:4.5pt">69.9</p>
</td>
<td style="height:14px; width:104px">
<p style="margin-left:30.35pt">12.2</p>
</td>
<td style="height:14px; width:104px">
<p style="margin-left:7.95pt">4.7</p>
</td>
<td style="height:14px; width:104px">
<p style="margin-left:27.7pt">2,353</p>
</td>
<td style="height:14px; width:103px">
<p style="margin-left:17.1pt">0.566</p>
</td>
</tr>
<tr>
<td style="height:14px; width:103px">
<p style="margin-left:27.6pt">2016</p>
</td>
<td style="height:14px; width:105px">
<p style="margin-left:4.5pt">70.3</p>
</td>
<td style="height:14px; width:104px">
<p style="margin-left:30.35pt">12.2</p>
</td>
<td style="height:14px; width:104px">
<p style="margin-left:7.95pt">4.9</p>
</td>
<td style="height:14px; width:104px">
<p style="margin-left:27.7pt">2,334</p>
</td>
<td style="height:14px; width:103px">
<p style="margin-left:17.1pt">0.569</p>
</td>
</tr>
<tr>
<td style="height:14px; width:103px">
<p style="margin-left:27.6pt">2017</p>
</td>
<td style="height:14px; width:105px">
<p style="margin-left:4.5pt">70.6</p>
</td>
<td style="height:14px; width:104px">
<p style="margin-left:30.35pt">12.2</p>
</td>
<td style="height:14px; width:104px">
<p style="margin-left:7.95pt">4.9</p>
</td>
<td style="height:14px; width:104px">
<p style="margin-left:27.7pt">2,471</p>
</td>
<td style="height:14px; width:103px">
<p style="margin-left:17.1pt">0.574</p>
</td>
</tr>
</tbody>
</table>
<p> </p>
</div>
',
'published' => true,
'created' => '2018-09-17',
'modified' => '2018-09-17',
'keywords' => '',
'description' => '',
'sortorder' => '8891',
'image' => '20180917043814_Clipboard01.jpg',
'article_date' => '2018-09-17 00:00:00',
'homepage' => false,
'breaking_news' => false,
'main_news' => true,
'in_scroller' => false,
'user_id' => '20'
),
'ArticleCategory' => array(
'id' => '1',
'name' => 'NEWS',
'parentOf' => '0',
'published' => true,
'registered' => '2015-07-20 00:00:00',
'sortorder' => '158',
'del_flag' => '0',
'homepage' => true,
'display_in_menu' => true,
'user_id' => '1',
'created' => '0000-00-00 00:00:00',
'modified' => '2018-11-22 11:58:49'
),
'User' => array(
'password' => '*****',
'id' => '20',
'user_detail_id' => '1',
'group_id' => '1',
'username' => 'nroy@newbusinessage.com',
'name' => 'Neeraj Roy',
'email' => 'nroy@newbusinessage.com',
'address' => '',
'gender' => '',
'access' => '1',
'phone' => '',
'access_type' => '0',
'activated' => false,
'sortorder' => '0',
'published' => '1',
'created' => '0000-00-00 00:00:00',
'last_login' => '0000-00-00 00:00:00',
'ip' => ''
),
'ArticleComment' => array(),
'ArticleFeature' => array(),
'ArticleHasAuthor' => array(),
'ArticleHasTag' => array(),
'ArticleView' => array(
(int) 0 => array(
'article_id' => '9112',
'hit' => '1466'
)
),
'Slider' => array()
)
$current_user = null
$logged_in = false
$image = 'https://old.newbusinessage.com/app/webroot/img/news/20180917043814_Clipboard01.jpg'
$user = null
$groupId = null
$user_id = null
$date = '2018-09-17 00:00:00'
$dateFromDatabase = (int) 1537121700
$newDate = 'Sep 17, 2018'
$articleView = array(
'article_id' => '9112',
'hit' => '1466'
)
$word_count = (int) 1097
$time_to_read = (float) 5.49
$time_to_read_min = (float) 5
$time_to_read_second = (float) 29
include - APP/View/Articles/view.ctp, line 241
View::_evaluate() - CORE/Cake/View/View.php, line 971
View::_render() - CORE/Cake/View/View.php, line 933
View::render() - CORE/Cake/View/View.php, line 473
Controller::render() - CORE/Cake/Controller/Controller.php, line 968
Dispatcher::_invoke() - CORE/Cake/Routing/Dispatcher.php, line 200
Dispatcher::dispatch() - CORE/Cake/Routing/Dispatcher.php, line 167
[main] - APP/webroot/index.php, line 117
September 17: Nepal’s HDI value for 2017 is 0.574 which puts the country in the medium human development category, according to a report published by UNDP. As per the report, Nepal lies in the 149th position out of 189 countries and territories surveyed by the organisation.
The report further states that Nepal’s HDI value increased from 0.378 to 0.574 between 1990 and 2017, an increase of 51.9 percent. However, Nepal’s 2017 HDI of 0.574 is below the average of 0.645 for countries in the medium human development group and below the average of 0.638 for countries in South Asia.
The HDI is a summary measure for assessing long-term progress in three basic dimensions of human development: a long and healthy life, access to knowledge and a decent standard of living.
A long and healthy life is measured by life expectancy. Knowledge level is measured by mean years of education among the adult population, which is the average number of years of education received in a life-time by people aged 25 years and older; and access to learning and knowledge by expected years of schooling for children of school-entry age, which is the total number of years of schooling a child of school-entry age can expect to receive if prevailing patterns of age-specific enrolment rates stay the same throughout the child's life. Standard of living is measured by Gross National Income (GNI) per capita expressed in constant 2011 international dollars converted using purchasing power parity (PPP) conversion rates.
Table A reviews Nepal’s progress in each of the HDI indicators. Between 1990 and 2017, Nepal’s life expectancy at birth increased by 16.3 years, mean years of schooling increased by 2.9 years and expected years of schooling increased by 4.7 years. Nepal’s GNI per capita increased by about 111.6 percent between 1990 and 2017.
Table A: Nepal’s HDI trends based on consistent time series data and new goalposts
FormHelper::create() - CORE/Cake/View/Helper/FormHelper.php, line 383
include - APP/View/Articles/view.ctp, line 273
View::_evaluate() - CORE/Cake/View/View.php, line 971
View::_render() - CORE/Cake/View/View.php, line 933
View::render() - CORE/Cake/View/View.php, line 473
Controller::render() - CORE/Cake/Controller/Controller.php, line 968
Dispatcher::_invoke() - CORE/Cake/Routing/Dispatcher.php, line 200
Dispatcher::dispatch() - CORE/Cake/Routing/Dispatcher.php, line 167
[main] - APP/webroot/index.php, line 117
$viewFile = '/var/www/html/newbusinessage.com/app/View/Elements/side_bar.ctp'
$dataForView = array(
'article' => array(
'Article' => array(
'id' => '9112',
'article_category_id' => '1',
'title' => 'Nepal’s HDI value up, but below average in South Asia',
'sub_title' => '',
'summary' => 'September 17: Nepal’s HDI value for 2017 is 0.574 which puts the country in the medium human development category, according to a report published by UNDP. ',
'content' => '<div><span style="font-size:13px">September 17: Nepal’s HDI value for 2017 is 0.574 which puts the country in the medium human development category, according to a report published by UNDP. As per the report, Nepal lies in the 149th position out of 189 countries and territories surveyed by the organisation. </span></div>
<div> </div>
<div><span style="font-size:13px">The report further states that Nepal’s HDI value increased from 0.378 to 0.574 between 1990 and 2017, an increase of 51.9 percent. However, Nepal’s 2017 HDI of 0.574 is below the average of 0.645 for countries in the medium human development group and below the average of 0.638 for countries in South Asia.</span></div>
<div> </div>
<div><span style="font-size:13px">The HDI is a summary measure for assessing long-term progress in three basic dimensions of human development: a long and healthy life, access to knowledge and a decent standard of living. </span></div>
<div> </div>
<div><span style="font-size:13px">A long and healthy life is measured by life expectancy. Knowledge level is measured by mean years of education among the adult population, which is the average number of years of education received in a life-time by people aged 25 years and older; and access to learning and knowledge by expected years of schooling for children of school-entry age, which is the total number of years of schooling a child of school-entry age can expect to receive if prevailing patterns of age-specific enrolment rates stay the same throughout the child's life. Standard of living is measured by Gross National Income (GNI) per capita expressed in constant 2011 international dollars converted using purchasing power parity (PPP) conversion rates.</span></div>
<div> </div>
<div><span style="font-size:13px">Table A reviews Nepal’s progress in each of the HDI indicators. Between 1990 and 2017, Nepal’s life expectancy at birth increased by 16.3 years, mean years of schooling increased by 2.9 years and expected years of schooling increased by 4.7 years. Nepal’s GNI per capita increased by about 111.6 percent between 1990 and 2017.</span></div>
<div> </div>
<div>
<p> </p>
<h2>Table A: Nepal’s HDI trends based on consistent time series data and new goalposts</h2>
<table border="1" cellpadding="0" cellspacing="0">
<tbody>
<tr>
<td style="height:28px; width:103px">
<p> </p>
</td>
<td style="height:28px; width:105px">
<p style="margin-left:4.7pt"><strong>Life expectancy</strong></p>
<p style="margin-left:4.5pt"><strong>at birth</strong></p>
</td>
<td style="height:28px; width:104px">
<p style="margin-left:5.05pt"><strong>Expected years</strong></p>
<p style="margin-left:5.05pt"><strong>of schooling</strong></p>
</td>
<td style="height:28px; width:104px">
<p style="margin-left:7.95pt"><strong>Mean years of</strong></p>
<p style="margin-left:7.95pt"><strong>schooling</strong></p>
</td>
<td style="height:28px; width:104px">
<p style="margin-left:8.15pt"><strong>GNI per capita</strong></p>
<p style="margin-left:12.95pt"><strong>(2011 PPP$)</strong></p>
</td>
<td style="height:28px; width:103px">
<p style="margin-left:17.1pt"><strong>HDI value</strong></p>
</td>
</tr>
<tr>
<td style="height:14px; width:103px">
<p style="margin-left:27.6pt">1990</p>
</td>
<td style="height:14px; width:105px">
<p style="margin-left:4.5pt">54.3</p>
</td>
<td style="height:14px; width:104px">
<p style="margin-left:32.85pt">7.5</p>
</td>
<td style="height:14px; width:104px">
<p style="margin-left:7.95pt">2.0</p>
</td>
<td style="height:14px; width:104px">
<p style="margin-left:27.7pt">1,168</p>
</td>
<td style="height:14px; width:103px">
<p style="margin-left:17.1pt">0.378</p>
</td>
</tr>
<tr>
<td style="height:14px; width:103px">
<p style="margin-left:27.6pt">1995</p>
</td>
<td style="height:14px; width:105px">
<p style="margin-left:4.5pt">58.5</p>
</td>
<td style="height:14px; width:104px">
<p style="margin-left:32.85pt">8.1</p>
</td>
<td style="height:14px; width:104px">
<p style="margin-left:7.95pt">2.2</p>
</td>
<td style="height:14px; width:104px">
<p style="margin-left:27.7pt">1,322</p>
</td>
<td style="height:14px; width:103px">
<p style="margin-left:17.1pt">0.410</p>
</td>
</tr>
<tr>
<td style="height:14px; width:103px">
<p style="margin-left:27.6pt">2000</p>
</td>
<td style="height:14px; width:105px">
<p style="margin-left:4.5pt">62.4</p>
</td>
<td style="height:14px; width:104px">
<p style="margin-left:32.85pt">9.0</p>
</td>
<td style="height:14px; width:104px">
<p style="margin-left:7.95pt">2.4</p>
</td>
<td style="height:14px; width:104px">
<p style="margin-left:27.7pt">1,526</p>
</td>
<td style="height:14px; width:103px">
<p style="margin-left:17.1pt">0.446</p>
</td>
</tr>
<tr>
<td style="height:14px; width:103px">
<p style="margin-left:27.6pt">2005</p>
</td>
<td style="height:14px; width:105px">
<p style="margin-left:4.5pt">65.5</p>
</td>
<td style="height:14px; width:104px">
<p style="margin-left:32.85pt">9.6</p>
</td>
<td style="height:14px; width:104px">
<p style="margin-left:7.95pt">2.8</p>
</td>
<td style="height:14px; width:104px">
<p style="margin-left:27.7pt">1,689</p>
</td>
<td style="height:14px; width:103px">
<p style="margin-left:17.1pt">0.475</p>
</td>
</tr>
<tr>
<td style="height:14px; width:103px">
<p style="margin-left:27.6pt">2010</p>
</td>
<td style="height:14px; width:105px">
<p style="margin-left:4.5pt">67.9</p>
</td>
<td style="height:14px; width:104px">
<p style="margin-left:30.35pt">12.0</p>
</td>
<td style="height:14px; width:104px">
<p style="margin-left:7.95pt">3.3</p>
</td>
<td style="height:14px; width:104px">
<p style="margin-left:27.7pt">2,001</p>
</td>
<td style="height:14px; width:103px">
<p style="margin-left:17.1pt">0.529</p>
</td>
</tr>
<tr>
<td style="height:14px; width:103px">
<p style="margin-left:27.6pt">2015</p>
</td>
<td style="height:14px; width:105px">
<p style="margin-left:4.5pt">69.9</p>
</td>
<td style="height:14px; width:104px">
<p style="margin-left:30.35pt">12.2</p>
</td>
<td style="height:14px; width:104px">
<p style="margin-left:7.95pt">4.7</p>
</td>
<td style="height:14px; width:104px">
<p style="margin-left:27.7pt">2,353</p>
</td>
<td style="height:14px; width:103px">
<p style="margin-left:17.1pt">0.566</p>
</td>
</tr>
<tr>
<td style="height:14px; width:103px">
<p style="margin-left:27.6pt">2016</p>
</td>
<td style="height:14px; width:105px">
<p style="margin-left:4.5pt">70.3</p>
</td>
<td style="height:14px; width:104px">
<p style="margin-left:30.35pt">12.2</p>
</td>
<td style="height:14px; width:104px">
<p style="margin-left:7.95pt">4.9</p>
</td>
<td style="height:14px; width:104px">
<p style="margin-left:27.7pt">2,334</p>
</td>
<td style="height:14px; width:103px">
<p style="margin-left:17.1pt">0.569</p>
</td>
</tr>
<tr>
<td style="height:14px; width:103px">
<p style="margin-left:27.6pt">2017</p>
</td>
<td style="height:14px; width:105px">
<p style="margin-left:4.5pt">70.6</p>
</td>
<td style="height:14px; width:104px">
<p style="margin-left:30.35pt">12.2</p>
</td>
<td style="height:14px; width:104px">
<p style="margin-left:7.95pt">4.9</p>
</td>
<td style="height:14px; width:104px">
<p style="margin-left:27.7pt">2,471</p>
</td>
<td style="height:14px; width:103px">
<p style="margin-left:17.1pt">0.574</p>
</td>
</tr>
</tbody>
</table>
<p> </p>
</div>
',
'published' => true,
'created' => '2018-09-17',
'modified' => '2018-09-17',
'keywords' => '',
'description' => '',
'sortorder' => '8891',
'image' => '20180917043814_Clipboard01.jpg',
'article_date' => '2018-09-17 00:00:00',
'homepage' => false,
'breaking_news' => false,
'main_news' => true,
'in_scroller' => false,
'user_id' => '20'
),
'ArticleCategory' => array(
'id' => '1',
'name' => 'NEWS',
'parentOf' => '0',
'published' => true,
'registered' => '2015-07-20 00:00:00',
'sortorder' => '158',
'del_flag' => '0',
'homepage' => true,
'display_in_menu' => true,
'user_id' => '1',
'created' => '0000-00-00 00:00:00',
'modified' => '2018-11-22 11:58:49'
),
'User' => array(
'password' => '*****',
'id' => '20',
'user_detail_id' => '1',
'group_id' => '1',
'username' => 'nroy@newbusinessage.com',
'name' => 'Neeraj Roy',
'email' => 'nroy@newbusinessage.com',
'address' => '',
'gender' => '',
'access' => '1',
'phone' => '',
'access_type' => '0',
'activated' => false,
'sortorder' => '0',
'published' => '1',
'created' => '0000-00-00 00:00:00',
'last_login' => '0000-00-00 00:00:00',
'ip' => ''
),
'ArticleComment' => array(),
'ArticleFeature' => array(),
'ArticleHasAuthor' => array(),
'ArticleHasTag' => array(),
'ArticleView' => array(
(int) 0 => array(
[maximum depth reached]
)
),
'Slider' => array()
),
'current_user' => null,
'logged_in' => false
)
$article = array(
'Article' => array(
'id' => '9112',
'article_category_id' => '1',
'title' => 'Nepal’s HDI value up, but below average in South Asia',
'sub_title' => '',
'summary' => 'September 17: Nepal’s HDI value for 2017 is 0.574 which puts the country in the medium human development category, according to a report published by UNDP. ',
'content' => '<div><span style="font-size:13px">September 17: Nepal’s HDI value for 2017 is 0.574 which puts the country in the medium human development category, according to a report published by UNDP. As per the report, Nepal lies in the 149th position out of 189 countries and territories surveyed by the organisation. </span></div>
<div> </div>
<div><span style="font-size:13px">The report further states that Nepal’s HDI value increased from 0.378 to 0.574 between 1990 and 2017, an increase of 51.9 percent. However, Nepal’s 2017 HDI of 0.574 is below the average of 0.645 for countries in the medium human development group and below the average of 0.638 for countries in South Asia.</span></div>
<div> </div>
<div><span style="font-size:13px">The HDI is a summary measure for assessing long-term progress in three basic dimensions of human development: a long and healthy life, access to knowledge and a decent standard of living. </span></div>
<div> </div>
<div><span style="font-size:13px">A long and healthy life is measured by life expectancy. Knowledge level is measured by mean years of education among the adult population, which is the average number of years of education received in a life-time by people aged 25 years and older; and access to learning and knowledge by expected years of schooling for children of school-entry age, which is the total number of years of schooling a child of school-entry age can expect to receive if prevailing patterns of age-specific enrolment rates stay the same throughout the child's life. Standard of living is measured by Gross National Income (GNI) per capita expressed in constant 2011 international dollars converted using purchasing power parity (PPP) conversion rates.</span></div>
<div> </div>
<div><span style="font-size:13px">Table A reviews Nepal’s progress in each of the HDI indicators. Between 1990 and 2017, Nepal’s life expectancy at birth increased by 16.3 years, mean years of schooling increased by 2.9 years and expected years of schooling increased by 4.7 years. Nepal’s GNI per capita increased by about 111.6 percent between 1990 and 2017.</span></div>
<div> </div>
<div>
<p> </p>
<h2>Table A: Nepal’s HDI trends based on consistent time series data and new goalposts</h2>
<table border="1" cellpadding="0" cellspacing="0">
<tbody>
<tr>
<td style="height:28px; width:103px">
<p> </p>
</td>
<td style="height:28px; width:105px">
<p style="margin-left:4.7pt"><strong>Life expectancy</strong></p>
<p style="margin-left:4.5pt"><strong>at birth</strong></p>
</td>
<td style="height:28px; width:104px">
<p style="margin-left:5.05pt"><strong>Expected years</strong></p>
<p style="margin-left:5.05pt"><strong>of schooling</strong></p>
</td>
<td style="height:28px; width:104px">
<p style="margin-left:7.95pt"><strong>Mean years of</strong></p>
<p style="margin-left:7.95pt"><strong>schooling</strong></p>
</td>
<td style="height:28px; width:104px">
<p style="margin-left:8.15pt"><strong>GNI per capita</strong></p>
<p style="margin-left:12.95pt"><strong>(2011 PPP$)</strong></p>
</td>
<td style="height:28px; width:103px">
<p style="margin-left:17.1pt"><strong>HDI value</strong></p>
</td>
</tr>
<tr>
<td style="height:14px; width:103px">
<p style="margin-left:27.6pt">1990</p>
</td>
<td style="height:14px; width:105px">
<p style="margin-left:4.5pt">54.3</p>
</td>
<td style="height:14px; width:104px">
<p style="margin-left:32.85pt">7.5</p>
</td>
<td style="height:14px; width:104px">
<p style="margin-left:7.95pt">2.0</p>
</td>
<td style="height:14px; width:104px">
<p style="margin-left:27.7pt">1,168</p>
</td>
<td style="height:14px; width:103px">
<p style="margin-left:17.1pt">0.378</p>
</td>
</tr>
<tr>
<td style="height:14px; width:103px">
<p style="margin-left:27.6pt">1995</p>
</td>
<td style="height:14px; width:105px">
<p style="margin-left:4.5pt">58.5</p>
</td>
<td style="height:14px; width:104px">
<p style="margin-left:32.85pt">8.1</p>
</td>
<td style="height:14px; width:104px">
<p style="margin-left:7.95pt">2.2</p>
</td>
<td style="height:14px; width:104px">
<p style="margin-left:27.7pt">1,322</p>
</td>
<td style="height:14px; width:103px">
<p style="margin-left:17.1pt">0.410</p>
</td>
</tr>
<tr>
<td style="height:14px; width:103px">
<p style="margin-left:27.6pt">2000</p>
</td>
<td style="height:14px; width:105px">
<p style="margin-left:4.5pt">62.4</p>
</td>
<td style="height:14px; width:104px">
<p style="margin-left:32.85pt">9.0</p>
</td>
<td style="height:14px; width:104px">
<p style="margin-left:7.95pt">2.4</p>
</td>
<td style="height:14px; width:104px">
<p style="margin-left:27.7pt">1,526</p>
</td>
<td style="height:14px; width:103px">
<p style="margin-left:17.1pt">0.446</p>
</td>
</tr>
<tr>
<td style="height:14px; width:103px">
<p style="margin-left:27.6pt">2005</p>
</td>
<td style="height:14px; width:105px">
<p style="margin-left:4.5pt">65.5</p>
</td>
<td style="height:14px; width:104px">
<p style="margin-left:32.85pt">9.6</p>
</td>
<td style="height:14px; width:104px">
<p style="margin-left:7.95pt">2.8</p>
</td>
<td style="height:14px; width:104px">
<p style="margin-left:27.7pt">1,689</p>
</td>
<td style="height:14px; width:103px">
<p style="margin-left:17.1pt">0.475</p>
</td>
</tr>
<tr>
<td style="height:14px; width:103px">
<p style="margin-left:27.6pt">2010</p>
</td>
<td style="height:14px; width:105px">
<p style="margin-left:4.5pt">67.9</p>
</td>
<td style="height:14px; width:104px">
<p style="margin-left:30.35pt">12.0</p>
</td>
<td style="height:14px; width:104px">
<p style="margin-left:7.95pt">3.3</p>
</td>
<td style="height:14px; width:104px">
<p style="margin-left:27.7pt">2,001</p>
</td>
<td style="height:14px; width:103px">
<p style="margin-left:17.1pt">0.529</p>
</td>
</tr>
<tr>
<td style="height:14px; width:103px">
<p style="margin-left:27.6pt">2015</p>
</td>
<td style="height:14px; width:105px">
<p style="margin-left:4.5pt">69.9</p>
</td>
<td style="height:14px; width:104px">
<p style="margin-left:30.35pt">12.2</p>
</td>
<td style="height:14px; width:104px">
<p style="margin-left:7.95pt">4.7</p>
</td>
<td style="height:14px; width:104px">
<p style="margin-left:27.7pt">2,353</p>
</td>
<td style="height:14px; width:103px">
<p style="margin-left:17.1pt">0.566</p>
</td>
</tr>
<tr>
<td style="height:14px; width:103px">
<p style="margin-left:27.6pt">2016</p>
</td>
<td style="height:14px; width:105px">
<p style="margin-left:4.5pt">70.3</p>
</td>
<td style="height:14px; width:104px">
<p style="margin-left:30.35pt">12.2</p>
</td>
<td style="height:14px; width:104px">
<p style="margin-left:7.95pt">4.9</p>
</td>
<td style="height:14px; width:104px">
<p style="margin-left:27.7pt">2,334</p>
</td>
<td style="height:14px; width:103px">
<p style="margin-left:17.1pt">0.569</p>
</td>
</tr>
<tr>
<td style="height:14px; width:103px">
<p style="margin-left:27.6pt">2017</p>
</td>
<td style="height:14px; width:105px">
<p style="margin-left:4.5pt">70.6</p>
</td>
<td style="height:14px; width:104px">
<p style="margin-left:30.35pt">12.2</p>
</td>
<td style="height:14px; width:104px">
<p style="margin-left:7.95pt">4.9</p>
</td>
<td style="height:14px; width:104px">
<p style="margin-left:27.7pt">2,471</p>
</td>
<td style="height:14px; width:103px">
<p style="margin-left:17.1pt">0.574</p>
</td>
</tr>
</tbody>
</table>
<p> </p>
</div>
',
'published' => true,
'created' => '2018-09-17',
'modified' => '2018-09-17',
'keywords' => '',
'description' => '',
'sortorder' => '8891',
'image' => '20180917043814_Clipboard01.jpg',
'article_date' => '2018-09-17 00:00:00',
'homepage' => false,
'breaking_news' => false,
'main_news' => true,
'in_scroller' => false,
'user_id' => '20'
),
'ArticleCategory' => array(
'id' => '1',
'name' => 'NEWS',
'parentOf' => '0',
'published' => true,
'registered' => '2015-07-20 00:00:00',
'sortorder' => '158',
'del_flag' => '0',
'homepage' => true,
'display_in_menu' => true,
'user_id' => '1',
'created' => '0000-00-00 00:00:00',
'modified' => '2018-11-22 11:58:49'
),
'User' => array(
'password' => '*****',
'id' => '20',
'user_detail_id' => '1',
'group_id' => '1',
'username' => 'nroy@newbusinessage.com',
'name' => 'Neeraj Roy',
'email' => 'nroy@newbusinessage.com',
'address' => '',
'gender' => '',
'access' => '1',
'phone' => '',
'access_type' => '0',
'activated' => false,
'sortorder' => '0',
'published' => '1',
'created' => '0000-00-00 00:00:00',
'last_login' => '0000-00-00 00:00:00',
'ip' => ''
),
'ArticleComment' => array(),
'ArticleFeature' => array(),
'ArticleHasAuthor' => array(),
'ArticleHasTag' => array(),
'ArticleView' => array(
(int) 0 => array(
'article_id' => '9112',
'hit' => '1466'
)
),
'Slider' => array()
)
$current_user = null
$logged_in = false
include - APP/View/Elements/side_bar.ctp, line 60
View::_evaluate() - CORE/Cake/View/View.php, line 971
View::_render() - CORE/Cake/View/View.php, line 933
View::_renderElement() - CORE/Cake/View/View.php, line 1224
View::element() - CORE/Cake/View/View.php, line 418
include - APP/View/Articles/view.ctp, line 391
View::_evaluate() - CORE/Cake/View/View.php, line 971
View::_render() - CORE/Cake/View/View.php, line 933
View::render() - CORE/Cake/View/View.php, line 473
Controller::render() - CORE/Cake/Controller/Controller.php, line 968
Dispatcher::_invoke() - CORE/Cake/Routing/Dispatcher.php, line 200
Dispatcher::dispatch() - CORE/Cake/Routing/Dispatcher.php, line 167
[main] - APP/webroot/index.php, line 117
Warning (2): simplexml_load_file() [<a href='http://php.net/function.simplexml-load-file'>function.simplexml-load-file</a>]: I/O warning : failed to load external entity "" [APP/View/Elements/side_bar.ctp, line 60]
$viewFile = '/var/www/html/newbusinessage.com/app/View/Elements/side_bar.ctp'
$dataForView = array(
'article' => array(
'Article' => array(
'id' => '9112',
'article_category_id' => '1',
'title' => 'Nepal’s HDI value up, but below average in South Asia',
'sub_title' => '',
'summary' => 'September 17: Nepal’s HDI value for 2017 is 0.574 which puts the country in the medium human development category, according to a report published by UNDP. ',
'content' => '<div><span style="font-size:13px">September 17: Nepal’s HDI value for 2017 is 0.574 which puts the country in the medium human development category, according to a report published by UNDP. As per the report, Nepal lies in the 149th position out of 189 countries and territories surveyed by the organisation. </span></div>
<div> </div>
<div><span style="font-size:13px">The report further states that Nepal’s HDI value increased from 0.378 to 0.574 between 1990 and 2017, an increase of 51.9 percent. However, Nepal’s 2017 HDI of 0.574 is below the average of 0.645 for countries in the medium human development group and below the average of 0.638 for countries in South Asia.</span></div>
<div> </div>
<div><span style="font-size:13px">The HDI is a summary measure for assessing long-term progress in three basic dimensions of human development: a long and healthy life, access to knowledge and a decent standard of living. </span></div>
<div> </div>
<div><span style="font-size:13px">A long and healthy life is measured by life expectancy. Knowledge level is measured by mean years of education among the adult population, which is the average number of years of education received in a life-time by people aged 25 years and older; and access to learning and knowledge by expected years of schooling for children of school-entry age, which is the total number of years of schooling a child of school-entry age can expect to receive if prevailing patterns of age-specific enrolment rates stay the same throughout the child's life. Standard of living is measured by Gross National Income (GNI) per capita expressed in constant 2011 international dollars converted using purchasing power parity (PPP) conversion rates.</span></div>
<div> </div>
<div><span style="font-size:13px">Table A reviews Nepal’s progress in each of the HDI indicators. Between 1990 and 2017, Nepal’s life expectancy at birth increased by 16.3 years, mean years of schooling increased by 2.9 years and expected years of schooling increased by 4.7 years. Nepal’s GNI per capita increased by about 111.6 percent between 1990 and 2017.</span></div>
<div> </div>
<div>
<p> </p>
<h2>Table A: Nepal’s HDI trends based on consistent time series data and new goalposts</h2>
<table border="1" cellpadding="0" cellspacing="0">
<tbody>
<tr>
<td style="height:28px; width:103px">
<p> </p>
</td>
<td style="height:28px; width:105px">
<p style="margin-left:4.7pt"><strong>Life expectancy</strong></p>
<p style="margin-left:4.5pt"><strong>at birth</strong></p>
</td>
<td style="height:28px; width:104px">
<p style="margin-left:5.05pt"><strong>Expected years</strong></p>
<p style="margin-left:5.05pt"><strong>of schooling</strong></p>
</td>
<td style="height:28px; width:104px">
<p style="margin-left:7.95pt"><strong>Mean years of</strong></p>
<p style="margin-left:7.95pt"><strong>schooling</strong></p>
</td>
<td style="height:28px; width:104px">
<p style="margin-left:8.15pt"><strong>GNI per capita</strong></p>
<p style="margin-left:12.95pt"><strong>(2011 PPP$)</strong></p>
</td>
<td style="height:28px; width:103px">
<p style="margin-left:17.1pt"><strong>HDI value</strong></p>
</td>
</tr>
<tr>
<td style="height:14px; width:103px">
<p style="margin-left:27.6pt">1990</p>
</td>
<td style="height:14px; width:105px">
<p style="margin-left:4.5pt">54.3</p>
</td>
<td style="height:14px; width:104px">
<p style="margin-left:32.85pt">7.5</p>
</td>
<td style="height:14px; width:104px">
<p style="margin-left:7.95pt">2.0</p>
</td>
<td style="height:14px; width:104px">
<p style="margin-left:27.7pt">1,168</p>
</td>
<td style="height:14px; width:103px">
<p style="margin-left:17.1pt">0.378</p>
</td>
</tr>
<tr>
<td style="height:14px; width:103px">
<p style="margin-left:27.6pt">1995</p>
</td>
<td style="height:14px; width:105px">
<p style="margin-left:4.5pt">58.5</p>
</td>
<td style="height:14px; width:104px">
<p style="margin-left:32.85pt">8.1</p>
</td>
<td style="height:14px; width:104px">
<p style="margin-left:7.95pt">2.2</p>
</td>
<td style="height:14px; width:104px">
<p style="margin-left:27.7pt">1,322</p>
</td>
<td style="height:14px; width:103px">
<p style="margin-left:17.1pt">0.410</p>
</td>
</tr>
<tr>
<td style="height:14px; width:103px">
<p style="margin-left:27.6pt">2000</p>
</td>
<td style="height:14px; width:105px">
<p style="margin-left:4.5pt">62.4</p>
</td>
<td style="height:14px; width:104px">
<p style="margin-left:32.85pt">9.0</p>
</td>
<td style="height:14px; width:104px">
<p style="margin-left:7.95pt">2.4</p>
</td>
<td style="height:14px; width:104px">
<p style="margin-left:27.7pt">1,526</p>
</td>
<td style="height:14px; width:103px">
<p style="margin-left:17.1pt">0.446</p>
</td>
</tr>
<tr>
<td style="height:14px; width:103px">
<p style="margin-left:27.6pt">2005</p>
</td>
<td style="height:14px; width:105px">
<p style="margin-left:4.5pt">65.5</p>
</td>
<td style="height:14px; width:104px">
<p style="margin-left:32.85pt">9.6</p>
</td>
<td style="height:14px; width:104px">
<p style="margin-left:7.95pt">2.8</p>
</td>
<td style="height:14px; width:104px">
<p style="margin-left:27.7pt">1,689</p>
</td>
<td style="height:14px; width:103px">
<p style="margin-left:17.1pt">0.475</p>
</td>
</tr>
<tr>
<td style="height:14px; width:103px">
<p style="margin-left:27.6pt">2010</p>
</td>
<td style="height:14px; width:105px">
<p style="margin-left:4.5pt">67.9</p>
</td>
<td style="height:14px; width:104px">
<p style="margin-left:30.35pt">12.0</p>
</td>
<td style="height:14px; width:104px">
<p style="margin-left:7.95pt">3.3</p>
</td>
<td style="height:14px; width:104px">
<p style="margin-left:27.7pt">2,001</p>
</td>
<td style="height:14px; width:103px">
<p style="margin-left:17.1pt">0.529</p>
</td>
</tr>
<tr>
<td style="height:14px; width:103px">
<p style="margin-left:27.6pt">2015</p>
</td>
<td style="height:14px; width:105px">
<p style="margin-left:4.5pt">69.9</p>
</td>
<td style="height:14px; width:104px">
<p style="margin-left:30.35pt">12.2</p>
</td>
<td style="height:14px; width:104px">
<p style="margin-left:7.95pt">4.7</p>
</td>
<td style="height:14px; width:104px">
<p style="margin-left:27.7pt">2,353</p>
</td>
<td style="height:14px; width:103px">
<p style="margin-left:17.1pt">0.566</p>
</td>
</tr>
<tr>
<td style="height:14px; width:103px">
<p style="margin-left:27.6pt">2016</p>
</td>
<td style="height:14px; width:105px">
<p style="margin-left:4.5pt">70.3</p>
</td>
<td style="height:14px; width:104px">
<p style="margin-left:30.35pt">12.2</p>
</td>
<td style="height:14px; width:104px">
<p style="margin-left:7.95pt">4.9</p>
</td>
<td style="height:14px; width:104px">
<p style="margin-left:27.7pt">2,334</p>
</td>
<td style="height:14px; width:103px">
<p style="margin-left:17.1pt">0.569</p>
</td>
</tr>
<tr>
<td style="height:14px; width:103px">
<p style="margin-left:27.6pt">2017</p>
</td>
<td style="height:14px; width:105px">
<p style="margin-left:4.5pt">70.6</p>
</td>
<td style="height:14px; width:104px">
<p style="margin-left:30.35pt">12.2</p>
</td>
<td style="height:14px; width:104px">
<p style="margin-left:7.95pt">4.9</p>
</td>
<td style="height:14px; width:104px">
<p style="margin-left:27.7pt">2,471</p>
</td>
<td style="height:14px; width:103px">
<p style="margin-left:17.1pt">0.574</p>
</td>
</tr>
</tbody>
</table>
<p> </p>
</div>
',
'published' => true,
'created' => '2018-09-17',
'modified' => '2018-09-17',
'keywords' => '',
'description' => '',
'sortorder' => '8891',
'image' => '20180917043814_Clipboard01.jpg',
'article_date' => '2018-09-17 00:00:00',
'homepage' => false,
'breaking_news' => false,
'main_news' => true,
'in_scroller' => false,
'user_id' => '20'
),
'ArticleCategory' => array(
'id' => '1',
'name' => 'NEWS',
'parentOf' => '0',
'published' => true,
'registered' => '2015-07-20 00:00:00',
'sortorder' => '158',
'del_flag' => '0',
'homepage' => true,
'display_in_menu' => true,
'user_id' => '1',
'created' => '0000-00-00 00:00:00',
'modified' => '2018-11-22 11:58:49'
),
'User' => array(
'password' => '*****',
'id' => '20',
'user_detail_id' => '1',
'group_id' => '1',
'username' => 'nroy@newbusinessage.com',
'name' => 'Neeraj Roy',
'email' => 'nroy@newbusinessage.com',
'address' => '',
'gender' => '',
'access' => '1',
'phone' => '',
'access_type' => '0',
'activated' => false,
'sortorder' => '0',
'published' => '1',
'created' => '0000-00-00 00:00:00',
'last_login' => '0000-00-00 00:00:00',
'ip' => ''
),
'ArticleComment' => array(),
'ArticleFeature' => array(),
'ArticleHasAuthor' => array(),
'ArticleHasTag' => array(),
'ArticleView' => array(
(int) 0 => array(
[maximum depth reached]
)
),
'Slider' => array()
),
'current_user' => null,
'logged_in' => false
)
$article = array(
'Article' => array(
'id' => '9112',
'article_category_id' => '1',
'title' => 'Nepal’s HDI value up, but below average in South Asia',
'sub_title' => '',
'summary' => 'September 17: Nepal’s HDI value for 2017 is 0.574 which puts the country in the medium human development category, according to a report published by UNDP. ',
'content' => '<div><span style="font-size:13px">September 17: Nepal’s HDI value for 2017 is 0.574 which puts the country in the medium human development category, according to a report published by UNDP. As per the report, Nepal lies in the 149th position out of 189 countries and territories surveyed by the organisation. </span></div>
<div> </div>
<div><span style="font-size:13px">The report further states that Nepal’s HDI value increased from 0.378 to 0.574 between 1990 and 2017, an increase of 51.9 percent. However, Nepal’s 2017 HDI of 0.574 is below the average of 0.645 for countries in the medium human development group and below the average of 0.638 for countries in South Asia.</span></div>
<div> </div>
<div><span style="font-size:13px">The HDI is a summary measure for assessing long-term progress in three basic dimensions of human development: a long and healthy life, access to knowledge and a decent standard of living. </span></div>
<div> </div>
<div><span style="font-size:13px">A long and healthy life is measured by life expectancy. Knowledge level is measured by mean years of education among the adult population, which is the average number of years of education received in a life-time by people aged 25 years and older; and access to learning and knowledge by expected years of schooling for children of school-entry age, which is the total number of years of schooling a child of school-entry age can expect to receive if prevailing patterns of age-specific enrolment rates stay the same throughout the child's life. Standard of living is measured by Gross National Income (GNI) per capita expressed in constant 2011 international dollars converted using purchasing power parity (PPP) conversion rates.</span></div>
<div> </div>
<div><span style="font-size:13px">Table A reviews Nepal’s progress in each of the HDI indicators. Between 1990 and 2017, Nepal’s life expectancy at birth increased by 16.3 years, mean years of schooling increased by 2.9 years and expected years of schooling increased by 4.7 years. Nepal’s GNI per capita increased by about 111.6 percent between 1990 and 2017.</span></div>
<div> </div>
<div>
<p> </p>
<h2>Table A: Nepal’s HDI trends based on consistent time series data and new goalposts</h2>
<table border="1" cellpadding="0" cellspacing="0">
<tbody>
<tr>
<td style="height:28px; width:103px">
<p> </p>
</td>
<td style="height:28px; width:105px">
<p style="margin-left:4.7pt"><strong>Life expectancy</strong></p>
<p style="margin-left:4.5pt"><strong>at birth</strong></p>
</td>
<td style="height:28px; width:104px">
<p style="margin-left:5.05pt"><strong>Expected years</strong></p>
<p style="margin-left:5.05pt"><strong>of schooling</strong></p>
</td>
<td style="height:28px; width:104px">
<p style="margin-left:7.95pt"><strong>Mean years of</strong></p>
<p style="margin-left:7.95pt"><strong>schooling</strong></p>
</td>
<td style="height:28px; width:104px">
<p style="margin-left:8.15pt"><strong>GNI per capita</strong></p>
<p style="margin-left:12.95pt"><strong>(2011 PPP$)</strong></p>
</td>
<td style="height:28px; width:103px">
<p style="margin-left:17.1pt"><strong>HDI value</strong></p>
</td>
</tr>
<tr>
<td style="height:14px; width:103px">
<p style="margin-left:27.6pt">1990</p>
</td>
<td style="height:14px; width:105px">
<p style="margin-left:4.5pt">54.3</p>
</td>
<td style="height:14px; width:104px">
<p style="margin-left:32.85pt">7.5</p>
</td>
<td style="height:14px; width:104px">
<p style="margin-left:7.95pt">2.0</p>
</td>
<td style="height:14px; width:104px">
<p style="margin-left:27.7pt">1,168</p>
</td>
<td style="height:14px; width:103px">
<p style="margin-left:17.1pt">0.378</p>
</td>
</tr>
<tr>
<td style="height:14px; width:103px">
<p style="margin-left:27.6pt">1995</p>
</td>
<td style="height:14px; width:105px">
<p style="margin-left:4.5pt">58.5</p>
</td>
<td style="height:14px; width:104px">
<p style="margin-left:32.85pt">8.1</p>
</td>
<td style="height:14px; width:104px">
<p style="margin-left:7.95pt">2.2</p>
</td>
<td style="height:14px; width:104px">
<p style="margin-left:27.7pt">1,322</p>
</td>
<td style="height:14px; width:103px">
<p style="margin-left:17.1pt">0.410</p>
</td>
</tr>
<tr>
<td style="height:14px; width:103px">
<p style="margin-left:27.6pt">2000</p>
</td>
<td style="height:14px; width:105px">
<p style="margin-left:4.5pt">62.4</p>
</td>
<td style="height:14px; width:104px">
<p style="margin-left:32.85pt">9.0</p>
</td>
<td style="height:14px; width:104px">
<p style="margin-left:7.95pt">2.4</p>
</td>
<td style="height:14px; width:104px">
<p style="margin-left:27.7pt">1,526</p>
</td>
<td style="height:14px; width:103px">
<p style="margin-left:17.1pt">0.446</p>
</td>
</tr>
<tr>
<td style="height:14px; width:103px">
<p style="margin-left:27.6pt">2005</p>
</td>
<td style="height:14px; width:105px">
<p style="margin-left:4.5pt">65.5</p>
</td>
<td style="height:14px; width:104px">
<p style="margin-left:32.85pt">9.6</p>
</td>
<td style="height:14px; width:104px">
<p style="margin-left:7.95pt">2.8</p>
</td>
<td style="height:14px; width:104px">
<p style="margin-left:27.7pt">1,689</p>
</td>
<td style="height:14px; width:103px">
<p style="margin-left:17.1pt">0.475</p>
</td>
</tr>
<tr>
<td style="height:14px; width:103px">
<p style="margin-left:27.6pt">2010</p>
</td>
<td style="height:14px; width:105px">
<p style="margin-left:4.5pt">67.9</p>
</td>
<td style="height:14px; width:104px">
<p style="margin-left:30.35pt">12.0</p>
</td>
<td style="height:14px; width:104px">
<p style="margin-left:7.95pt">3.3</p>
</td>
<td style="height:14px; width:104px">
<p style="margin-left:27.7pt">2,001</p>
</td>
<td style="height:14px; width:103px">
<p style="margin-left:17.1pt">0.529</p>
</td>
</tr>
<tr>
<td style="height:14px; width:103px">
<p style="margin-left:27.6pt">2015</p>
</td>
<td style="height:14px; width:105px">
<p style="margin-left:4.5pt">69.9</p>
</td>
<td style="height:14px; width:104px">
<p style="margin-left:30.35pt">12.2</p>
</td>
<td style="height:14px; width:104px">
<p style="margin-left:7.95pt">4.7</p>
</td>
<td style="height:14px; width:104px">
<p style="margin-left:27.7pt">2,353</p>
</td>
<td style="height:14px; width:103px">
<p style="margin-left:17.1pt">0.566</p>
</td>
</tr>
<tr>
<td style="height:14px; width:103px">
<p style="margin-left:27.6pt">2016</p>
</td>
<td style="height:14px; width:105px">
<p style="margin-left:4.5pt">70.3</p>
</td>
<td style="height:14px; width:104px">
<p style="margin-left:30.35pt">12.2</p>
</td>
<td style="height:14px; width:104px">
<p style="margin-left:7.95pt">4.9</p>
</td>
<td style="height:14px; width:104px">
<p style="margin-left:27.7pt">2,334</p>
</td>
<td style="height:14px; width:103px">
<p style="margin-left:17.1pt">0.569</p>
</td>
</tr>
<tr>
<td style="height:14px; width:103px">
<p style="margin-left:27.6pt">2017</p>
</td>
<td style="height:14px; width:105px">
<p style="margin-left:4.5pt">70.6</p>
</td>
<td style="height:14px; width:104px">
<p style="margin-left:30.35pt">12.2</p>
</td>
<td style="height:14px; width:104px">
<p style="margin-left:7.95pt">4.9</p>
</td>
<td style="height:14px; width:104px">
<p style="margin-left:27.7pt">2,471</p>
</td>
<td style="height:14px; width:103px">
<p style="margin-left:17.1pt">0.574</p>
</td>
</tr>
</tbody>
</table>
<p> </p>
</div>
',
'published' => true,
'created' => '2018-09-17',
'modified' => '2018-09-17',
'keywords' => '',
'description' => '',
'sortorder' => '8891',
'image' => '20180917043814_Clipboard01.jpg',
'article_date' => '2018-09-17 00:00:00',
'homepage' => false,
'breaking_news' => false,
'main_news' => true,
'in_scroller' => false,
'user_id' => '20'
),
'ArticleCategory' => array(
'id' => '1',
'name' => 'NEWS',
'parentOf' => '0',
'published' => true,
'registered' => '2015-07-20 00:00:00',
'sortorder' => '158',
'del_flag' => '0',
'homepage' => true,
'display_in_menu' => true,
'user_id' => '1',
'created' => '0000-00-00 00:00:00',
'modified' => '2018-11-22 11:58:49'
),
'User' => array(
'password' => '*****',
'id' => '20',
'user_detail_id' => '1',
'group_id' => '1',
'username' => 'nroy@newbusinessage.com',
'name' => 'Neeraj Roy',
'email' => 'nroy@newbusinessage.com',
'address' => '',
'gender' => '',
'access' => '1',
'phone' => '',
'access_type' => '0',
'activated' => false,
'sortorder' => '0',
'published' => '1',
'created' => '0000-00-00 00:00:00',
'last_login' => '0000-00-00 00:00:00',
'ip' => ''
),
'ArticleComment' => array(),
'ArticleFeature' => array(),
'ArticleHasAuthor' => array(),
'ArticleHasTag' => array(),
'ArticleView' => array(
(int) 0 => array(
'article_id' => '9112',
'hit' => '1466'
)
),
'Slider' => array()
)
$current_user = null
$logged_in = false
simplexml_load_file - [internal], line ??
include - APP/View/Elements/side_bar.ctp, line 60
View::_evaluate() - CORE/Cake/View/View.php, line 971
View::_render() - CORE/Cake/View/View.php, line 933
View::_renderElement() - CORE/Cake/View/View.php, line 1224
View::element() - CORE/Cake/View/View.php, line 418
include - APP/View/Articles/view.ctp, line 391
View::_evaluate() - CORE/Cake/View/View.php, line 971
View::_render() - CORE/Cake/View/View.php, line 933
View::render() - CORE/Cake/View/View.php, line 473
Controller::render() - CORE/Cake/Controller/Controller.php, line 968
Dispatcher::_invoke() - CORE/Cake/Routing/Dispatcher.php, line 200
Dispatcher::dispatch() - CORE/Cake/Routing/Dispatcher.php, line 167
[main] - APP/webroot/index.php, line 117
file not found!
Notice (8): Undefined variable: file [APP/View/Elements/side_bar.ctp, line 133]
$viewFile = '/var/www/html/newbusinessage.com/app/View/Elements/side_bar.ctp'
$dataForView = array(
'article' => array(
'Article' => array(
'id' => '9112',
'article_category_id' => '1',
'title' => 'Nepal’s HDI value up, but below average in South Asia',
'sub_title' => '',
'summary' => 'September 17: Nepal’s HDI value for 2017 is 0.574 which puts the country in the medium human development category, according to a report published by UNDP. ',
'content' => '<div><span style="font-size:13px">September 17: Nepal’s HDI value for 2017 is 0.574 which puts the country in the medium human development category, according to a report published by UNDP. As per the report, Nepal lies in the 149th position out of 189 countries and territories surveyed by the organisation. </span></div>
<div> </div>
<div><span style="font-size:13px">The report further states that Nepal’s HDI value increased from 0.378 to 0.574 between 1990 and 2017, an increase of 51.9 percent. However, Nepal’s 2017 HDI of 0.574 is below the average of 0.645 for countries in the medium human development group and below the average of 0.638 for countries in South Asia.</span></div>
<div> </div>
<div><span style="font-size:13px">The HDI is a summary measure for assessing long-term progress in three basic dimensions of human development: a long and healthy life, access to knowledge and a decent standard of living. </span></div>
<div> </div>
<div><span style="font-size:13px">A long and healthy life is measured by life expectancy. Knowledge level is measured by mean years of education among the adult population, which is the average number of years of education received in a life-time by people aged 25 years and older; and access to learning and knowledge by expected years of schooling for children of school-entry age, which is the total number of years of schooling a child of school-entry age can expect to receive if prevailing patterns of age-specific enrolment rates stay the same throughout the child's life. Standard of living is measured by Gross National Income (GNI) per capita expressed in constant 2011 international dollars converted using purchasing power parity (PPP) conversion rates.</span></div>
<div> </div>
<div><span style="font-size:13px">Table A reviews Nepal’s progress in each of the HDI indicators. Between 1990 and 2017, Nepal’s life expectancy at birth increased by 16.3 years, mean years of schooling increased by 2.9 years and expected years of schooling increased by 4.7 years. Nepal’s GNI per capita increased by about 111.6 percent between 1990 and 2017.</span></div>
<div> </div>
<div>
<p> </p>
<h2>Table A: Nepal’s HDI trends based on consistent time series data and new goalposts</h2>
<table border="1" cellpadding="0" cellspacing="0">
<tbody>
<tr>
<td style="height:28px; width:103px">
<p> </p>
</td>
<td style="height:28px; width:105px">
<p style="margin-left:4.7pt"><strong>Life expectancy</strong></p>
<p style="margin-left:4.5pt"><strong>at birth</strong></p>
</td>
<td style="height:28px; width:104px">
<p style="margin-left:5.05pt"><strong>Expected years</strong></p>
<p style="margin-left:5.05pt"><strong>of schooling</strong></p>
</td>
<td style="height:28px; width:104px">
<p style="margin-left:7.95pt"><strong>Mean years of</strong></p>
<p style="margin-left:7.95pt"><strong>schooling</strong></p>
</td>
<td style="height:28px; width:104px">
<p style="margin-left:8.15pt"><strong>GNI per capita</strong></p>
<p style="margin-left:12.95pt"><strong>(2011 PPP$)</strong></p>
</td>
<td style="height:28px; width:103px">
<p style="margin-left:17.1pt"><strong>HDI value</strong></p>
</td>
</tr>
<tr>
<td style="height:14px; width:103px">
<p style="margin-left:27.6pt">1990</p>
</td>
<td style="height:14px; width:105px">
<p style="margin-left:4.5pt">54.3</p>
</td>
<td style="height:14px; width:104px">
<p style="margin-left:32.85pt">7.5</p>
</td>
<td style="height:14px; width:104px">
<p style="margin-left:7.95pt">2.0</p>
</td>
<td style="height:14px; width:104px">
<p style="margin-left:27.7pt">1,168</p>
</td>
<td style="height:14px; width:103px">
<p style="margin-left:17.1pt">0.378</p>
</td>
</tr>
<tr>
<td style="height:14px; width:103px">
<p style="margin-left:27.6pt">1995</p>
</td>
<td style="height:14px; width:105px">
<p style="margin-left:4.5pt">58.5</p>
</td>
<td style="height:14px; width:104px">
<p style="margin-left:32.85pt">8.1</p>
</td>
<td style="height:14px; width:104px">
<p style="margin-left:7.95pt">2.2</p>
</td>
<td style="height:14px; width:104px">
<p style="margin-left:27.7pt">1,322</p>
</td>
<td style="height:14px; width:103px">
<p style="margin-left:17.1pt">0.410</p>
</td>
</tr>
<tr>
<td style="height:14px; width:103px">
<p style="margin-left:27.6pt">2000</p>
</td>
<td style="height:14px; width:105px">
<p style="margin-left:4.5pt">62.4</p>
</td>
<td style="height:14px; width:104px">
<p style="margin-left:32.85pt">9.0</p>
</td>
<td style="height:14px; width:104px">
<p style="margin-left:7.95pt">2.4</p>
</td>
<td style="height:14px; width:104px">
<p style="margin-left:27.7pt">1,526</p>
</td>
<td style="height:14px; width:103px">
<p style="margin-left:17.1pt">0.446</p>
</td>
</tr>
<tr>
<td style="height:14px; width:103px">
<p style="margin-left:27.6pt">2005</p>
</td>
<td style="height:14px; width:105px">
<p style="margin-left:4.5pt">65.5</p>
</td>
<td style="height:14px; width:104px">
<p style="margin-left:32.85pt">9.6</p>
</td>
<td style="height:14px; width:104px">
<p style="margin-left:7.95pt">2.8</p>
</td>
<td style="height:14px; width:104px">
<p style="margin-left:27.7pt">1,689</p>
</td>
<td style="height:14px; width:103px">
<p style="margin-left:17.1pt">0.475</p>
</td>
</tr>
<tr>
<td style="height:14px; width:103px">
<p style="margin-left:27.6pt">2010</p>
</td>
<td style="height:14px; width:105px">
<p style="margin-left:4.5pt">67.9</p>
</td>
<td style="height:14px; width:104px">
<p style="margin-left:30.35pt">12.0</p>
</td>
<td style="height:14px; width:104px">
<p style="margin-left:7.95pt">3.3</p>
</td>
<td style="height:14px; width:104px">
<p style="margin-left:27.7pt">2,001</p>
</td>
<td style="height:14px; width:103px">
<p style="margin-left:17.1pt">0.529</p>
</td>
</tr>
<tr>
<td style="height:14px; width:103px">
<p style="margin-left:27.6pt">2015</p>
</td>
<td style="height:14px; width:105px">
<p style="margin-left:4.5pt">69.9</p>
</td>
<td style="height:14px; width:104px">
<p style="margin-left:30.35pt">12.2</p>
</td>
<td style="height:14px; width:104px">
<p style="margin-left:7.95pt">4.7</p>
</td>
<td style="height:14px; width:104px">
<p style="margin-left:27.7pt">2,353</p>
</td>
<td style="height:14px; width:103px">
<p style="margin-left:17.1pt">0.566</p>
</td>
</tr>
<tr>
<td style="height:14px; width:103px">
<p style="margin-left:27.6pt">2016</p>
</td>
<td style="height:14px; width:105px">
<p style="margin-left:4.5pt">70.3</p>
</td>
<td style="height:14px; width:104px">
<p style="margin-left:30.35pt">12.2</p>
</td>
<td style="height:14px; width:104px">
<p style="margin-left:7.95pt">4.9</p>
</td>
<td style="height:14px; width:104px">
<p style="margin-left:27.7pt">2,334</p>
</td>
<td style="height:14px; width:103px">
<p style="margin-left:17.1pt">0.569</p>
</td>
</tr>
<tr>
<td style="height:14px; width:103px">
<p style="margin-left:27.6pt">2017</p>
</td>
<td style="height:14px; width:105px">
<p style="margin-left:4.5pt">70.6</p>
</td>
<td style="height:14px; width:104px">
<p style="margin-left:30.35pt">12.2</p>
</td>
<td style="height:14px; width:104px">
<p style="margin-left:7.95pt">4.9</p>
</td>
<td style="height:14px; width:104px">
<p style="margin-left:27.7pt">2,471</p>
</td>
<td style="height:14px; width:103px">
<p style="margin-left:17.1pt">0.574</p>
</td>
</tr>
</tbody>
</table>
<p> </p>
</div>
',
'published' => true,
'created' => '2018-09-17',
'modified' => '2018-09-17',
'keywords' => '',
'description' => '',
'sortorder' => '8891',
'image' => '20180917043814_Clipboard01.jpg',
'article_date' => '2018-09-17 00:00:00',
'homepage' => false,
'breaking_news' => false,
'main_news' => true,
'in_scroller' => false,
'user_id' => '20'
),
'ArticleCategory' => array(
'id' => '1',
'name' => 'NEWS',
'parentOf' => '0',
'published' => true,
'registered' => '2015-07-20 00:00:00',
'sortorder' => '158',
'del_flag' => '0',
'homepage' => true,
'display_in_menu' => true,
'user_id' => '1',
'created' => '0000-00-00 00:00:00',
'modified' => '2018-11-22 11:58:49'
),
'User' => array(
'password' => '*****',
'id' => '20',
'user_detail_id' => '1',
'group_id' => '1',
'username' => 'nroy@newbusinessage.com',
'name' => 'Neeraj Roy',
'email' => 'nroy@newbusinessage.com',
'address' => '',
'gender' => '',
'access' => '1',
'phone' => '',
'access_type' => '0',
'activated' => false,
'sortorder' => '0',
'published' => '1',
'created' => '0000-00-00 00:00:00',
'last_login' => '0000-00-00 00:00:00',
'ip' => ''
),
'ArticleComment' => array(),
'ArticleFeature' => array(),
'ArticleHasAuthor' => array(),
'ArticleHasTag' => array(),
'ArticleView' => array(
(int) 0 => array(
[maximum depth reached]
)
),
'Slider' => array()
),
'current_user' => null,
'logged_in' => false
)
$article = array(
'Article' => array(
'id' => '9112',
'article_category_id' => '1',
'title' => 'Nepal’s HDI value up, but below average in South Asia',
'sub_title' => '',
'summary' => 'September 17: Nepal’s HDI value for 2017 is 0.574 which puts the country in the medium human development category, according to a report published by UNDP. ',
'content' => '<div><span style="font-size:13px">September 17: Nepal’s HDI value for 2017 is 0.574 which puts the country in the medium human development category, according to a report published by UNDP. As per the report, Nepal lies in the 149th position out of 189 countries and territories surveyed by the organisation. </span></div>
<div> </div>
<div><span style="font-size:13px">The report further states that Nepal’s HDI value increased from 0.378 to 0.574 between 1990 and 2017, an increase of 51.9 percent. However, Nepal’s 2017 HDI of 0.574 is below the average of 0.645 for countries in the medium human development group and below the average of 0.638 for countries in South Asia.</span></div>
<div> </div>
<div><span style="font-size:13px">The HDI is a summary measure for assessing long-term progress in three basic dimensions of human development: a long and healthy life, access to knowledge and a decent standard of living. </span></div>
<div> </div>
<div><span style="font-size:13px">A long and healthy life is measured by life expectancy. Knowledge level is measured by mean years of education among the adult population, which is the average number of years of education received in a life-time by people aged 25 years and older; and access to learning and knowledge by expected years of schooling for children of school-entry age, which is the total number of years of schooling a child of school-entry age can expect to receive if prevailing patterns of age-specific enrolment rates stay the same throughout the child's life. Standard of living is measured by Gross National Income (GNI) per capita expressed in constant 2011 international dollars converted using purchasing power parity (PPP) conversion rates.</span></div>
<div> </div>
<div><span style="font-size:13px">Table A reviews Nepal’s progress in each of the HDI indicators. Between 1990 and 2017, Nepal’s life expectancy at birth increased by 16.3 years, mean years of schooling increased by 2.9 years and expected years of schooling increased by 4.7 years. Nepal’s GNI per capita increased by about 111.6 percent between 1990 and 2017.</span></div>
<div> </div>
<div>
<p> </p>
<h2>Table A: Nepal’s HDI trends based on consistent time series data and new goalposts</h2>
<table border="1" cellpadding="0" cellspacing="0">
<tbody>
<tr>
<td style="height:28px; width:103px">
<p> </p>
</td>
<td style="height:28px; width:105px">
<p style="margin-left:4.7pt"><strong>Life expectancy</strong></p>
<p style="margin-left:4.5pt"><strong>at birth</strong></p>
</td>
<td style="height:28px; width:104px">
<p style="margin-left:5.05pt"><strong>Expected years</strong></p>
<p style="margin-left:5.05pt"><strong>of schooling</strong></p>
</td>
<td style="height:28px; width:104px">
<p style="margin-left:7.95pt"><strong>Mean years of</strong></p>
<p style="margin-left:7.95pt"><strong>schooling</strong></p>
</td>
<td style="height:28px; width:104px">
<p style="margin-left:8.15pt"><strong>GNI per capita</strong></p>
<p style="margin-left:12.95pt"><strong>(2011 PPP$)</strong></p>
</td>
<td style="height:28px; width:103px">
<p style="margin-left:17.1pt"><strong>HDI value</strong></p>
</td>
</tr>
<tr>
<td style="height:14px; width:103px">
<p style="margin-left:27.6pt">1990</p>
</td>
<td style="height:14px; width:105px">
<p style="margin-left:4.5pt">54.3</p>
</td>
<td style="height:14px; width:104px">
<p style="margin-left:32.85pt">7.5</p>
</td>
<td style="height:14px; width:104px">
<p style="margin-left:7.95pt">2.0</p>
</td>
<td style="height:14px; width:104px">
<p style="margin-left:27.7pt">1,168</p>
</td>
<td style="height:14px; width:103px">
<p style="margin-left:17.1pt">0.378</p>
</td>
</tr>
<tr>
<td style="height:14px; width:103px">
<p style="margin-left:27.6pt">1995</p>
</td>
<td style="height:14px; width:105px">
<p style="margin-left:4.5pt">58.5</p>
</td>
<td style="height:14px; width:104px">
<p style="margin-left:32.85pt">8.1</p>
</td>
<td style="height:14px; width:104px">
<p style="margin-left:7.95pt">2.2</p>
</td>
<td style="height:14px; width:104px">
<p style="margin-left:27.7pt">1,322</p>
</td>
<td style="height:14px; width:103px">
<p style="margin-left:17.1pt">0.410</p>
</td>
</tr>
<tr>
<td style="height:14px; width:103px">
<p style="margin-left:27.6pt">2000</p>
</td>
<td style="height:14px; width:105px">
<p style="margin-left:4.5pt">62.4</p>
</td>
<td style="height:14px; width:104px">
<p style="margin-left:32.85pt">9.0</p>
</td>
<td style="height:14px; width:104px">
<p style="margin-left:7.95pt">2.4</p>
</td>
<td style="height:14px; width:104px">
<p style="margin-left:27.7pt">1,526</p>
</td>
<td style="height:14px; width:103px">
<p style="margin-left:17.1pt">0.446</p>
</td>
</tr>
<tr>
<td style="height:14px; width:103px">
<p style="margin-left:27.6pt">2005</p>
</td>
<td style="height:14px; width:105px">
<p style="margin-left:4.5pt">65.5</p>
</td>
<td style="height:14px; width:104px">
<p style="margin-left:32.85pt">9.6</p>
</td>
<td style="height:14px; width:104px">
<p style="margin-left:7.95pt">2.8</p>
</td>
<td style="height:14px; width:104px">
<p style="margin-left:27.7pt">1,689</p>
</td>
<td style="height:14px; width:103px">
<p style="margin-left:17.1pt">0.475</p>
</td>
</tr>
<tr>
<td style="height:14px; width:103px">
<p style="margin-left:27.6pt">2010</p>
</td>
<td style="height:14px; width:105px">
<p style="margin-left:4.5pt">67.9</p>
</td>
<td style="height:14px; width:104px">
<p style="margin-left:30.35pt">12.0</p>
</td>
<td style="height:14px; width:104px">
<p style="margin-left:7.95pt">3.3</p>
</td>
<td style="height:14px; width:104px">
<p style="margin-left:27.7pt">2,001</p>
</td>
<td style="height:14px; width:103px">
<p style="margin-left:17.1pt">0.529</p>
</td>
</tr>
<tr>
<td style="height:14px; width:103px">
<p style="margin-left:27.6pt">2015</p>
</td>
<td style="height:14px; width:105px">
<p style="margin-left:4.5pt">69.9</p>
</td>
<td style="height:14px; width:104px">
<p style="margin-left:30.35pt">12.2</p>
</td>
<td style="height:14px; width:104px">
<p style="margin-left:7.95pt">4.7</p>
</td>
<td style="height:14px; width:104px">
<p style="margin-left:27.7pt">2,353</p>
</td>
<td style="height:14px; width:103px">
<p style="margin-left:17.1pt">0.566</p>
</td>
</tr>
<tr>
<td style="height:14px; width:103px">
<p style="margin-left:27.6pt">2016</p>
</td>
<td style="height:14px; width:105px">
<p style="margin-left:4.5pt">70.3</p>
</td>
<td style="height:14px; width:104px">
<p style="margin-left:30.35pt">12.2</p>
</td>
<td style="height:14px; width:104px">
<p style="margin-left:7.95pt">4.9</p>
</td>
<td style="height:14px; width:104px">
<p style="margin-left:27.7pt">2,334</p>
</td>
<td style="height:14px; width:103px">
<p style="margin-left:17.1pt">0.569</p>
</td>
</tr>
<tr>
<td style="height:14px; width:103px">
<p style="margin-left:27.6pt">2017</p>
</td>
<td style="height:14px; width:105px">
<p style="margin-left:4.5pt">70.6</p>
</td>
<td style="height:14px; width:104px">
<p style="margin-left:30.35pt">12.2</p>
</td>
<td style="height:14px; width:104px">
<p style="margin-left:7.95pt">4.9</p>
</td>
<td style="height:14px; width:104px">
<p style="margin-left:27.7pt">2,471</p>
</td>
<td style="height:14px; width:103px">
<p style="margin-left:17.1pt">0.574</p>
</td>
</tr>
</tbody>
</table>
<p> </p>
</div>
',
'published' => true,
'created' => '2018-09-17',
'modified' => '2018-09-17',
'keywords' => '',
'description' => '',
'sortorder' => '8891',
'image' => '20180917043814_Clipboard01.jpg',
'article_date' => '2018-09-17 00:00:00',
'homepage' => false,
'breaking_news' => false,
'main_news' => true,
'in_scroller' => false,
'user_id' => '20'
),
'ArticleCategory' => array(
'id' => '1',
'name' => 'NEWS',
'parentOf' => '0',
'published' => true,
'registered' => '2015-07-20 00:00:00',
'sortorder' => '158',
'del_flag' => '0',
'homepage' => true,
'display_in_menu' => true,
'user_id' => '1',
'created' => '0000-00-00 00:00:00',
'modified' => '2018-11-22 11:58:49'
),
'User' => array(
'password' => '*****',
'id' => '20',
'user_detail_id' => '1',
'group_id' => '1',
'username' => 'nroy@newbusinessage.com',
'name' => 'Neeraj Roy',
'email' => 'nroy@newbusinessage.com',
'address' => '',
'gender' => '',
'access' => '1',
'phone' => '',
'access_type' => '0',
'activated' => false,
'sortorder' => '0',
'published' => '1',
'created' => '0000-00-00 00:00:00',
'last_login' => '0000-00-00 00:00:00',
'ip' => ''
),
'ArticleComment' => array(),
'ArticleFeature' => array(),
'ArticleHasAuthor' => array(),
'ArticleHasTag' => array(),
'ArticleView' => array(
(int) 0 => array(
'article_id' => '9112',
'hit' => '1466'
)
),
'Slider' => array()
)
$current_user = null
$logged_in = false
$xml = false
include - APP/View/Elements/side_bar.ctp, line 133
View::_evaluate() - CORE/Cake/View/View.php, line 971
View::_render() - CORE/Cake/View/View.php, line 933
View::_renderElement() - CORE/Cake/View/View.php, line 1224
View::element() - CORE/Cake/View/View.php, line 418
include - APP/View/Articles/view.ctp, line 391
View::_evaluate() - CORE/Cake/View/View.php, line 971
View::_render() - CORE/Cake/View/View.php, line 933
View::render() - CORE/Cake/View/View.php, line 473
Controller::render() - CORE/Cake/Controller/Controller.php, line 968
Dispatcher::_invoke() - CORE/Cake/Routing/Dispatcher.php, line 200
Dispatcher::dispatch() - CORE/Cake/Routing/Dispatcher.php, line 167
[main] - APP/webroot/index.php, line 117
Warning (2): simplexml_load_file() [<a href='http://php.net/function.simplexml-load-file'>function.simplexml-load-file</a>]: I/O warning : failed to load external entity "" [APP/View/Elements/side_bar.ctp, line 133]
$viewFile = '/var/www/html/newbusinessage.com/app/View/Elements/side_bar.ctp'
$dataForView = array(
'article' => array(
'Article' => array(
'id' => '9112',
'article_category_id' => '1',
'title' => 'Nepal’s HDI value up, but below average in South Asia',
'sub_title' => '',
'summary' => 'September 17: Nepal’s HDI value for 2017 is 0.574 which puts the country in the medium human development category, according to a report published by UNDP. ',
'content' => '<div><span style="font-size:13px">September 17: Nepal’s HDI value for 2017 is 0.574 which puts the country in the medium human development category, according to a report published by UNDP. As per the report, Nepal lies in the 149th position out of 189 countries and territories surveyed by the organisation. </span></div>
<div> </div>
<div><span style="font-size:13px">The report further states that Nepal’s HDI value increased from 0.378 to 0.574 between 1990 and 2017, an increase of 51.9 percent. However, Nepal’s 2017 HDI of 0.574 is below the average of 0.645 for countries in the medium human development group and below the average of 0.638 for countries in South Asia.</span></div>
<div> </div>
<div><span style="font-size:13px">The HDI is a summary measure for assessing long-term progress in three basic dimensions of human development: a long and healthy life, access to knowledge and a decent standard of living. </span></div>
<div> </div>
<div><span style="font-size:13px">A long and healthy life is measured by life expectancy. Knowledge level is measured by mean years of education among the adult population, which is the average number of years of education received in a life-time by people aged 25 years and older; and access to learning and knowledge by expected years of schooling for children of school-entry age, which is the total number of years of schooling a child of school-entry age can expect to receive if prevailing patterns of age-specific enrolment rates stay the same throughout the child's life. Standard of living is measured by Gross National Income (GNI) per capita expressed in constant 2011 international dollars converted using purchasing power parity (PPP) conversion rates.</span></div>
<div> </div>
<div><span style="font-size:13px">Table A reviews Nepal’s progress in each of the HDI indicators. Between 1990 and 2017, Nepal’s life expectancy at birth increased by 16.3 years, mean years of schooling increased by 2.9 years and expected years of schooling increased by 4.7 years. Nepal’s GNI per capita increased by about 111.6 percent between 1990 and 2017.</span></div>
<div> </div>
<div>
<p> </p>
<h2>Table A: Nepal’s HDI trends based on consistent time series data and new goalposts</h2>
<table border="1" cellpadding="0" cellspacing="0">
<tbody>
<tr>
<td style="height:28px; width:103px">
<p> </p>
</td>
<td style="height:28px; width:105px">
<p style="margin-left:4.7pt"><strong>Life expectancy</strong></p>
<p style="margin-left:4.5pt"><strong>at birth</strong></p>
</td>
<td style="height:28px; width:104px">
<p style="margin-left:5.05pt"><strong>Expected years</strong></p>
<p style="margin-left:5.05pt"><strong>of schooling</strong></p>
</td>
<td style="height:28px; width:104px">
<p style="margin-left:7.95pt"><strong>Mean years of</strong></p>
<p style="margin-left:7.95pt"><strong>schooling</strong></p>
</td>
<td style="height:28px; width:104px">
<p style="margin-left:8.15pt"><strong>GNI per capita</strong></p>
<p style="margin-left:12.95pt"><strong>(2011 PPP$)</strong></p>
</td>
<td style="height:28px; width:103px">
<p style="margin-left:17.1pt"><strong>HDI value</strong></p>
</td>
</tr>
<tr>
<td style="height:14px; width:103px">
<p style="margin-left:27.6pt">1990</p>
</td>
<td style="height:14px; width:105px">
<p style="margin-left:4.5pt">54.3</p>
</td>
<td style="height:14px; width:104px">
<p style="margin-left:32.85pt">7.5</p>
</td>
<td style="height:14px; width:104px">
<p style="margin-left:7.95pt">2.0</p>
</td>
<td style="height:14px; width:104px">
<p style="margin-left:27.7pt">1,168</p>
</td>
<td style="height:14px; width:103px">
<p style="margin-left:17.1pt">0.378</p>
</td>
</tr>
<tr>
<td style="height:14px; width:103px">
<p style="margin-left:27.6pt">1995</p>
</td>
<td style="height:14px; width:105px">
<p style="margin-left:4.5pt">58.5</p>
</td>
<td style="height:14px; width:104px">
<p style="margin-left:32.85pt">8.1</p>
</td>
<td style="height:14px; width:104px">
<p style="margin-left:7.95pt">2.2</p>
</td>
<td style="height:14px; width:104px">
<p style="margin-left:27.7pt">1,322</p>
</td>
<td style="height:14px; width:103px">
<p style="margin-left:17.1pt">0.410</p>
</td>
</tr>
<tr>
<td style="height:14px; width:103px">
<p style="margin-left:27.6pt">2000</p>
</td>
<td style="height:14px; width:105px">
<p style="margin-left:4.5pt">62.4</p>
</td>
<td style="height:14px; width:104px">
<p style="margin-left:32.85pt">9.0</p>
</td>
<td style="height:14px; width:104px">
<p style="margin-left:7.95pt">2.4</p>
</td>
<td style="height:14px; width:104px">
<p style="margin-left:27.7pt">1,526</p>
</td>
<td style="height:14px; width:103px">
<p style="margin-left:17.1pt">0.446</p>
</td>
</tr>
<tr>
<td style="height:14px; width:103px">
<p style="margin-left:27.6pt">2005</p>
</td>
<td style="height:14px; width:105px">
<p style="margin-left:4.5pt">65.5</p>
</td>
<td style="height:14px; width:104px">
<p style="margin-left:32.85pt">9.6</p>
</td>
<td style="height:14px; width:104px">
<p style="margin-left:7.95pt">2.8</p>
</td>
<td style="height:14px; width:104px">
<p style="margin-left:27.7pt">1,689</p>
</td>
<td style="height:14px; width:103px">
<p style="margin-left:17.1pt">0.475</p>
</td>
</tr>
<tr>
<td style="height:14px; width:103px">
<p style="margin-left:27.6pt">2010</p>
</td>
<td style="height:14px; width:105px">
<p style="margin-left:4.5pt">67.9</p>
</td>
<td style="height:14px; width:104px">
<p style="margin-left:30.35pt">12.0</p>
</td>
<td style="height:14px; width:104px">
<p style="margin-left:7.95pt">3.3</p>
</td>
<td style="height:14px; width:104px">
<p style="margin-left:27.7pt">2,001</p>
</td>
<td style="height:14px; width:103px">
<p style="margin-left:17.1pt">0.529</p>
</td>
</tr>
<tr>
<td style="height:14px; width:103px">
<p style="margin-left:27.6pt">2015</p>
</td>
<td style="height:14px; width:105px">
<p style="margin-left:4.5pt">69.9</p>
</td>
<td style="height:14px; width:104px">
<p style="margin-left:30.35pt">12.2</p>
</td>
<td style="height:14px; width:104px">
<p style="margin-left:7.95pt">4.7</p>
</td>
<td style="height:14px; width:104px">
<p style="margin-left:27.7pt">2,353</p>
</td>
<td style="height:14px; width:103px">
<p style="margin-left:17.1pt">0.566</p>
</td>
</tr>
<tr>
<td style="height:14px; width:103px">
<p style="margin-left:27.6pt">2016</p>
</td>
<td style="height:14px; width:105px">
<p style="margin-left:4.5pt">70.3</p>
</td>
<td style="height:14px; width:104px">
<p style="margin-left:30.35pt">12.2</p>
</td>
<td style="height:14px; width:104px">
<p style="margin-left:7.95pt">4.9</p>
</td>
<td style="height:14px; width:104px">
<p style="margin-left:27.7pt">2,334</p>
</td>
<td style="height:14px; width:103px">
<p style="margin-left:17.1pt">0.569</p>
</td>
</tr>
<tr>
<td style="height:14px; width:103px">
<p style="margin-left:27.6pt">2017</p>
</td>
<td style="height:14px; width:105px">
<p style="margin-left:4.5pt">70.6</p>
</td>
<td style="height:14px; width:104px">
<p style="margin-left:30.35pt">12.2</p>
</td>
<td style="height:14px; width:104px">
<p style="margin-left:7.95pt">4.9</p>
</td>
<td style="height:14px; width:104px">
<p style="margin-left:27.7pt">2,471</p>
</td>
<td style="height:14px; width:103px">
<p style="margin-left:17.1pt">0.574</p>
</td>
</tr>
</tbody>
</table>
<p> </p>
</div>
',
'published' => true,
'created' => '2018-09-17',
'modified' => '2018-09-17',
'keywords' => '',
'description' => '',
'sortorder' => '8891',
'image' => '20180917043814_Clipboard01.jpg',
'article_date' => '2018-09-17 00:00:00',
'homepage' => false,
'breaking_news' => false,
'main_news' => true,
'in_scroller' => false,
'user_id' => '20'
),
'ArticleCategory' => array(
'id' => '1',
'name' => 'NEWS',
'parentOf' => '0',
'published' => true,
'registered' => '2015-07-20 00:00:00',
'sortorder' => '158',
'del_flag' => '0',
'homepage' => true,
'display_in_menu' => true,
'user_id' => '1',
'created' => '0000-00-00 00:00:00',
'modified' => '2018-11-22 11:58:49'
),
'User' => array(
'password' => '*****',
'id' => '20',
'user_detail_id' => '1',
'group_id' => '1',
'username' => 'nroy@newbusinessage.com',
'name' => 'Neeraj Roy',
'email' => 'nroy@newbusinessage.com',
'address' => '',
'gender' => '',
'access' => '1',
'phone' => '',
'access_type' => '0',
'activated' => false,
'sortorder' => '0',
'published' => '1',
'created' => '0000-00-00 00:00:00',
'last_login' => '0000-00-00 00:00:00',
'ip' => ''
),
'ArticleComment' => array(),
'ArticleFeature' => array(),
'ArticleHasAuthor' => array(),
'ArticleHasTag' => array(),
'ArticleView' => array(
(int) 0 => array(
[maximum depth reached]
)
),
'Slider' => array()
),
'current_user' => null,
'logged_in' => false
)
$article = array(
'Article' => array(
'id' => '9112',
'article_category_id' => '1',
'title' => 'Nepal’s HDI value up, but below average in South Asia',
'sub_title' => '',
'summary' => 'September 17: Nepal’s HDI value for 2017 is 0.574 which puts the country in the medium human development category, according to a report published by UNDP. ',
'content' => '<div><span style="font-size:13px">September 17: Nepal’s HDI value for 2017 is 0.574 which puts the country in the medium human development category, according to a report published by UNDP. As per the report, Nepal lies in the 149th position out of 189 countries and territories surveyed by the organisation. </span></div>
<div> </div>
<div><span style="font-size:13px">The report further states that Nepal’s HDI value increased from 0.378 to 0.574 between 1990 and 2017, an increase of 51.9 percent. However, Nepal’s 2017 HDI of 0.574 is below the average of 0.645 for countries in the medium human development group and below the average of 0.638 for countries in South Asia.</span></div>
<div> </div>
<div><span style="font-size:13px">The HDI is a summary measure for assessing long-term progress in three basic dimensions of human development: a long and healthy life, access to knowledge and a decent standard of living. </span></div>
<div> </div>
<div><span style="font-size:13px">A long and healthy life is measured by life expectancy. Knowledge level is measured by mean years of education among the adult population, which is the average number of years of education received in a life-time by people aged 25 years and older; and access to learning and knowledge by expected years of schooling for children of school-entry age, which is the total number of years of schooling a child of school-entry age can expect to receive if prevailing patterns of age-specific enrolment rates stay the same throughout the child's life. Standard of living is measured by Gross National Income (GNI) per capita expressed in constant 2011 international dollars converted using purchasing power parity (PPP) conversion rates.</span></div>
<div> </div>
<div><span style="font-size:13px">Table A reviews Nepal’s progress in each of the HDI indicators. Between 1990 and 2017, Nepal’s life expectancy at birth increased by 16.3 years, mean years of schooling increased by 2.9 years and expected years of schooling increased by 4.7 years. Nepal’s GNI per capita increased by about 111.6 percent between 1990 and 2017.</span></div>
<div> </div>
<div>
<p> </p>
<h2>Table A: Nepal’s HDI trends based on consistent time series data and new goalposts</h2>
<table border="1" cellpadding="0" cellspacing="0">
<tbody>
<tr>
<td style="height:28px; width:103px">
<p> </p>
</td>
<td style="height:28px; width:105px">
<p style="margin-left:4.7pt"><strong>Life expectancy</strong></p>
<p style="margin-left:4.5pt"><strong>at birth</strong></p>
</td>
<td style="height:28px; width:104px">
<p style="margin-left:5.05pt"><strong>Expected years</strong></p>
<p style="margin-left:5.05pt"><strong>of schooling</strong></p>
</td>
<td style="height:28px; width:104px">
<p style="margin-left:7.95pt"><strong>Mean years of</strong></p>
<p style="margin-left:7.95pt"><strong>schooling</strong></p>
</td>
<td style="height:28px; width:104px">
<p style="margin-left:8.15pt"><strong>GNI per capita</strong></p>
<p style="margin-left:12.95pt"><strong>(2011 PPP$)</strong></p>
</td>
<td style="height:28px; width:103px">
<p style="margin-left:17.1pt"><strong>HDI value</strong></p>
</td>
</tr>
<tr>
<td style="height:14px; width:103px">
<p style="margin-left:27.6pt">1990</p>
</td>
<td style="height:14px; width:105px">
<p style="margin-left:4.5pt">54.3</p>
</td>
<td style="height:14px; width:104px">
<p style="margin-left:32.85pt">7.5</p>
</td>
<td style="height:14px; width:104px">
<p style="margin-left:7.95pt">2.0</p>
</td>
<td style="height:14px; width:104px">
<p style="margin-left:27.7pt">1,168</p>
</td>
<td style="height:14px; width:103px">
<p style="margin-left:17.1pt">0.378</p>
</td>
</tr>
<tr>
<td style="height:14px; width:103px">
<p style="margin-left:27.6pt">1995</p>
</td>
<td style="height:14px; width:105px">
<p style="margin-left:4.5pt">58.5</p>
</td>
<td style="height:14px; width:104px">
<p style="margin-left:32.85pt">8.1</p>
</td>
<td style="height:14px; width:104px">
<p style="margin-left:7.95pt">2.2</p>
</td>
<td style="height:14px; width:104px">
<p style="margin-left:27.7pt">1,322</p>
</td>
<td style="height:14px; width:103px">
<p style="margin-left:17.1pt">0.410</p>
</td>
</tr>
<tr>
<td style="height:14px; width:103px">
<p style="margin-left:27.6pt">2000</p>
</td>
<td style="height:14px; width:105px">
<p style="margin-left:4.5pt">62.4</p>
</td>
<td style="height:14px; width:104px">
<p style="margin-left:32.85pt">9.0</p>
</td>
<td style="height:14px; width:104px">
<p style="margin-left:7.95pt">2.4</p>
</td>
<td style="height:14px; width:104px">
<p style="margin-left:27.7pt">1,526</p>
</td>
<td style="height:14px; width:103px">
<p style="margin-left:17.1pt">0.446</p>
</td>
</tr>
<tr>
<td style="height:14px; width:103px">
<p style="margin-left:27.6pt">2005</p>
</td>
<td style="height:14px; width:105px">
<p style="margin-left:4.5pt">65.5</p>
</td>
<td style="height:14px; width:104px">
<p style="margin-left:32.85pt">9.6</p>
</td>
<td style="height:14px; width:104px">
<p style="margin-left:7.95pt">2.8</p>
</td>
<td style="height:14px; width:104px">
<p style="margin-left:27.7pt">1,689</p>
</td>
<td style="height:14px; width:103px">
<p style="margin-left:17.1pt">0.475</p>
</td>
</tr>
<tr>
<td style="height:14px; width:103px">
<p style="margin-left:27.6pt">2010</p>
</td>
<td style="height:14px; width:105px">
<p style="margin-left:4.5pt">67.9</p>
</td>
<td style="height:14px; width:104px">
<p style="margin-left:30.35pt">12.0</p>
</td>
<td style="height:14px; width:104px">
<p style="margin-left:7.95pt">3.3</p>
</td>
<td style="height:14px; width:104px">
<p style="margin-left:27.7pt">2,001</p>
</td>
<td style="height:14px; width:103px">
<p style="margin-left:17.1pt">0.529</p>
</td>
</tr>
<tr>
<td style="height:14px; width:103px">
<p style="margin-left:27.6pt">2015</p>
</td>
<td style="height:14px; width:105px">
<p style="margin-left:4.5pt">69.9</p>
</td>
<td style="height:14px; width:104px">
<p style="margin-left:30.35pt">12.2</p>
</td>
<td style="height:14px; width:104px">
<p style="margin-left:7.95pt">4.7</p>
</td>
<td style="height:14px; width:104px">
<p style="margin-left:27.7pt">2,353</p>
</td>
<td style="height:14px; width:103px">
<p style="margin-left:17.1pt">0.566</p>
</td>
</tr>
<tr>
<td style="height:14px; width:103px">
<p style="margin-left:27.6pt">2016</p>
</td>
<td style="height:14px; width:105px">
<p style="margin-left:4.5pt">70.3</p>
</td>
<td style="height:14px; width:104px">
<p style="margin-left:30.35pt">12.2</p>
</td>
<td style="height:14px; width:104px">
<p style="margin-left:7.95pt">4.9</p>
</td>
<td style="height:14px; width:104px">
<p style="margin-left:27.7pt">2,334</p>
</td>
<td style="height:14px; width:103px">
<p style="margin-left:17.1pt">0.569</p>
</td>
</tr>
<tr>
<td style="height:14px; width:103px">
<p style="margin-left:27.6pt">2017</p>
</td>
<td style="height:14px; width:105px">
<p style="margin-left:4.5pt">70.6</p>
</td>
<td style="height:14px; width:104px">
<p style="margin-left:30.35pt">12.2</p>
</td>
<td style="height:14px; width:104px">
<p style="margin-left:7.95pt">4.9</p>
</td>
<td style="height:14px; width:104px">
<p style="margin-left:27.7pt">2,471</p>
</td>
<td style="height:14px; width:103px">
<p style="margin-left:17.1pt">0.574</p>
</td>
</tr>
</tbody>
</table>
<p> </p>
</div>
',
'published' => true,
'created' => '2018-09-17',
'modified' => '2018-09-17',
'keywords' => '',
'description' => '',
'sortorder' => '8891',
'image' => '20180917043814_Clipboard01.jpg',
'article_date' => '2018-09-17 00:00:00',
'homepage' => false,
'breaking_news' => false,
'main_news' => true,
'in_scroller' => false,
'user_id' => '20'
),
'ArticleCategory' => array(
'id' => '1',
'name' => 'NEWS',
'parentOf' => '0',
'published' => true,
'registered' => '2015-07-20 00:00:00',
'sortorder' => '158',
'del_flag' => '0',
'homepage' => true,
'display_in_menu' => true,
'user_id' => '1',
'created' => '0000-00-00 00:00:00',
'modified' => '2018-11-22 11:58:49'
),
'User' => array(
'password' => '*****',
'id' => '20',
'user_detail_id' => '1',
'group_id' => '1',
'username' => 'nroy@newbusinessage.com',
'name' => 'Neeraj Roy',
'email' => 'nroy@newbusinessage.com',
'address' => '',
'gender' => '',
'access' => '1',
'phone' => '',
'access_type' => '0',
'activated' => false,
'sortorder' => '0',
'published' => '1',
'created' => '0000-00-00 00:00:00',
'last_login' => '0000-00-00 00:00:00',
'ip' => ''
),
'ArticleComment' => array(),
'ArticleFeature' => array(),
'ArticleHasAuthor' => array(),
'ArticleHasTag' => array(),
'ArticleView' => array(
(int) 0 => array(
'article_id' => '9112',
'hit' => '1466'
)
),
'Slider' => array()
)
$current_user = null
$logged_in = false
$xml = false
simplexml_load_file - [internal], line ??
include - APP/View/Elements/side_bar.ctp, line 133
View::_evaluate() - CORE/Cake/View/View.php, line 971
View::_render() - CORE/Cake/View/View.php, line 933
View::_renderElement() - CORE/Cake/View/View.php, line 1224
View::element() - CORE/Cake/View/View.php, line 418
include - APP/View/Articles/view.ctp, line 391
View::_evaluate() - CORE/Cake/View/View.php, line 971
View::_render() - CORE/Cake/View/View.php, line 933
View::render() - CORE/Cake/View/View.php, line 473
Controller::render() - CORE/Cake/Controller/Controller.php, line 968
Dispatcher::_invoke() - CORE/Cake/Routing/Dispatcher.php, line 200
Dispatcher::dispatch() - CORE/Cake/Routing/Dispatcher.php, line 167
[main] - APP/webroot/index.php, line 117