$user = $this->Session->read('Auth.User');
//find the group of logged user
$groupId = $user['Group']['id'];
$viewFile = '/var/www/html/newbusinessage.com/app/View/Articles/view.ctp'
$dataForView = array(
'article' => array(
'Article' => array(
'id' => '20237',
'article_category_id' => '1',
'title' => 'Annual Nominal Household Consumption Expenditure up by 66.23 Percent',
'sub_title' => '',
'summary' => 'February 13: The Nepal Living Standards Survey has shown that yearly spatially and temporally adjusted per capita consumption expenditures have surged by 66 percent, rising from Rs 75,902 to Rs 126,172 in real terms between 2011 and 2023.',
'content' => '<p><span style="font-size:11pt"><span style="font-family:Calibri,"sans-serif""><span style="font-size:13.0pt">February 13: The Nepal Living Standards Survey has shown that yearly spatially and temporally adjusted per capita consumption expenditures have surged by 66 percent, rising from Rs 75,902 to Rs 126,172 in real terms between 2011 and 2023. </span></span></span></p>
<p><span style="font-size:11pt"><span style="font-family:Calibri,"sans-serif""><span style="font-size:13.0pt">Over the same period, the proportion of non-food spending has escalated from an average of 38 percent to 47 percent. Moreover, the distribution of food expenditures has undergone a transformation since the previous NLSS, shifting away from cereals, which provide relatively inexpensive calories, towards more nutritious diets characterized by a greater allocation of spending on fruits, nuts, and meats, albeit these being more costly calorie sources.</span></span></span></p>
<p><span style="font-size:11pt"><span style="font-family:Calibri,"sans-serif""><span style="font-size:13.0pt">When it comes to nominal household consumption expenditure, Kathmandu Valley leads with an annual average of Rs 263,318. Following closely, urban areas of Gandaki Province records the second highest expenditure at Rs 176,542 per year, representing 67 percent of that in Kathmandu Valley. </span></span></span></p>
<p><span style="font-size:11pt"><span style="font-family:Calibri,"sans-serif""><span style="font-size:13.0pt">Conversely, the lowest average annual nominal per capita expenditures are observed in rural areas of Madhesh and Sudurpaschim provinces at Rs 71,828 and Rs 72,861 per person per year, respectively.</span></span></span></p>
<p> </p>
',
'published' => true,
'created' => '2024-02-13',
'modified' => '2024-02-13',
'keywords' => '',
'description' => '',
'sortorder' => '19964',
'image' => '20240213105500_foodbasket.jpg',
'article_date' => '2024-02-13 10:51:07',
'homepage' => false,
'breaking_news' => false,
'main_news' => true,
'in_scroller' => false,
'user_id' => '34'
),
'ArticleCategory' => array(
'id' => '1',
'name' => 'NEWS',
'parentOf' => '0',
'published' => true,
'registered' => '2015-07-20 00:00:00',
'sortorder' => '158',
'del_flag' => '0',
'homepage' => true,
'display_in_menu' => true,
'user_id' => '1',
'created' => '0000-00-00 00:00:00',
'modified' => '2018-11-22 11:58:49'
),
'User' => array(
'password' => '*****',
'id' => '34',
'user_detail_id' => '1',
'group_id' => '1',
'username' => 'neeraj.roy@newbusinessage.com',
'name' => null,
'email' => 'neeraj.roy@newbusinessage.com',
'address' => null,
'gender' => null,
'access' => '1',
'phone' => null,
'access_type' => null,
'activated' => true,
'sortorder' => null,
'published' => null,
'created' => '2020-07-19 16:40:23',
'last_login' => '2024-08-13 13:55:06',
'ip' => '172.69.41.137'
),
'ArticleComment' => array(),
'ArticleFeature' => array(),
'ArticleHasAuthor' => array(),
'ArticleHasTag' => array(),
'ArticleView' => array(
(int) 0 => array(
[maximum depth reached]
)
),
'Slider' => array()
),
'current_user' => null,
'logged_in' => false
)
$article = array(
'Article' => array(
'id' => '20237',
'article_category_id' => '1',
'title' => 'Annual Nominal Household Consumption Expenditure up by 66.23 Percent',
'sub_title' => '',
'summary' => 'February 13: The Nepal Living Standards Survey has shown that yearly spatially and temporally adjusted per capita consumption expenditures have surged by 66 percent, rising from Rs 75,902 to Rs 126,172 in real terms between 2011 and 2023.',
'content' => '<p><span style="font-size:11pt"><span style="font-family:Calibri,"sans-serif""><span style="font-size:13.0pt">February 13: The Nepal Living Standards Survey has shown that yearly spatially and temporally adjusted per capita consumption expenditures have surged by 66 percent, rising from Rs 75,902 to Rs 126,172 in real terms between 2011 and 2023. </span></span></span></p>
<p><span style="font-size:11pt"><span style="font-family:Calibri,"sans-serif""><span style="font-size:13.0pt">Over the same period, the proportion of non-food spending has escalated from an average of 38 percent to 47 percent. Moreover, the distribution of food expenditures has undergone a transformation since the previous NLSS, shifting away from cereals, which provide relatively inexpensive calories, towards more nutritious diets characterized by a greater allocation of spending on fruits, nuts, and meats, albeit these being more costly calorie sources.</span></span></span></p>
<p><span style="font-size:11pt"><span style="font-family:Calibri,"sans-serif""><span style="font-size:13.0pt">When it comes to nominal household consumption expenditure, Kathmandu Valley leads with an annual average of Rs 263,318. Following closely, urban areas of Gandaki Province records the second highest expenditure at Rs 176,542 per year, representing 67 percent of that in Kathmandu Valley. </span></span></span></p>
<p><span style="font-size:11pt"><span style="font-family:Calibri,"sans-serif""><span style="font-size:13.0pt">Conversely, the lowest average annual nominal per capita expenditures are observed in rural areas of Madhesh and Sudurpaschim provinces at Rs 71,828 and Rs 72,861 per person per year, respectively.</span></span></span></p>
<p> </p>
',
'published' => true,
'created' => '2024-02-13',
'modified' => '2024-02-13',
'keywords' => '',
'description' => '',
'sortorder' => '19964',
'image' => '20240213105500_foodbasket.jpg',
'article_date' => '2024-02-13 10:51:07',
'homepage' => false,
'breaking_news' => false,
'main_news' => true,
'in_scroller' => false,
'user_id' => '34'
),
'ArticleCategory' => array(
'id' => '1',
'name' => 'NEWS',
'parentOf' => '0',
'published' => true,
'registered' => '2015-07-20 00:00:00',
'sortorder' => '158',
'del_flag' => '0',
'homepage' => true,
'display_in_menu' => true,
'user_id' => '1',
'created' => '0000-00-00 00:00:00',
'modified' => '2018-11-22 11:58:49'
),
'User' => array(
'password' => '*****',
'id' => '34',
'user_detail_id' => '1',
'group_id' => '1',
'username' => 'neeraj.roy@newbusinessage.com',
'name' => null,
'email' => 'neeraj.roy@newbusinessage.com',
'address' => null,
'gender' => null,
'access' => '1',
'phone' => null,
'access_type' => null,
'activated' => true,
'sortorder' => null,
'published' => null,
'created' => '2020-07-19 16:40:23',
'last_login' => '2024-08-13 13:55:06',
'ip' => '172.69.41.137'
),
'ArticleComment' => array(),
'ArticleFeature' => array(),
'ArticleHasAuthor' => array(),
'ArticleHasTag' => array(),
'ArticleView' => array(
(int) 0 => array(
'article_id' => '20237',
'hit' => '638'
)
),
'Slider' => array()
)
$current_user = null
$logged_in = false
$image = 'https://old.newbusinessage.com/app/webroot/img/news/20240213105500_foodbasket.jpg'
$user = null
include - APP/View/Articles/view.ctp, line 115
View::_evaluate() - CORE/Cake/View/View.php, line 971
View::_render() - CORE/Cake/View/View.php, line 933
View::render() - CORE/Cake/View/View.php, line 473
Controller::render() - CORE/Cake/Controller/Controller.php, line 968
Dispatcher::_invoke() - CORE/Cake/Routing/Dispatcher.php, line 200
Dispatcher::dispatch() - CORE/Cake/Routing/Dispatcher.php, line 167
[main] - APP/webroot/index.php, line 117
Notice (8): Trying to access array offset on value of type null [APP/View/Articles/view.ctp, line 115]
$user = $this->Session->read('Auth.User');
//find the group of logged user
$groupId = $user['Group']['id'];
$viewFile = '/var/www/html/newbusinessage.com/app/View/Articles/view.ctp'
$dataForView = array(
'article' => array(
'Article' => array(
'id' => '20237',
'article_category_id' => '1',
'title' => 'Annual Nominal Household Consumption Expenditure up by 66.23 Percent',
'sub_title' => '',
'summary' => 'February 13: The Nepal Living Standards Survey has shown that yearly spatially and temporally adjusted per capita consumption expenditures have surged by 66 percent, rising from Rs 75,902 to Rs 126,172 in real terms between 2011 and 2023.',
'content' => '<p><span style="font-size:11pt"><span style="font-family:Calibri,"sans-serif""><span style="font-size:13.0pt">February 13: The Nepal Living Standards Survey has shown that yearly spatially and temporally adjusted per capita consumption expenditures have surged by 66 percent, rising from Rs 75,902 to Rs 126,172 in real terms between 2011 and 2023. </span></span></span></p>
<p><span style="font-size:11pt"><span style="font-family:Calibri,"sans-serif""><span style="font-size:13.0pt">Over the same period, the proportion of non-food spending has escalated from an average of 38 percent to 47 percent. Moreover, the distribution of food expenditures has undergone a transformation since the previous NLSS, shifting away from cereals, which provide relatively inexpensive calories, towards more nutritious diets characterized by a greater allocation of spending on fruits, nuts, and meats, albeit these being more costly calorie sources.</span></span></span></p>
<p><span style="font-size:11pt"><span style="font-family:Calibri,"sans-serif""><span style="font-size:13.0pt">When it comes to nominal household consumption expenditure, Kathmandu Valley leads with an annual average of Rs 263,318. Following closely, urban areas of Gandaki Province records the second highest expenditure at Rs 176,542 per year, representing 67 percent of that in Kathmandu Valley. </span></span></span></p>
<p><span style="font-size:11pt"><span style="font-family:Calibri,"sans-serif""><span style="font-size:13.0pt">Conversely, the lowest average annual nominal per capita expenditures are observed in rural areas of Madhesh and Sudurpaschim provinces at Rs 71,828 and Rs 72,861 per person per year, respectively.</span></span></span></p>
<p> </p>
',
'published' => true,
'created' => '2024-02-13',
'modified' => '2024-02-13',
'keywords' => '',
'description' => '',
'sortorder' => '19964',
'image' => '20240213105500_foodbasket.jpg',
'article_date' => '2024-02-13 10:51:07',
'homepage' => false,
'breaking_news' => false,
'main_news' => true,
'in_scroller' => false,
'user_id' => '34'
),
'ArticleCategory' => array(
'id' => '1',
'name' => 'NEWS',
'parentOf' => '0',
'published' => true,
'registered' => '2015-07-20 00:00:00',
'sortorder' => '158',
'del_flag' => '0',
'homepage' => true,
'display_in_menu' => true,
'user_id' => '1',
'created' => '0000-00-00 00:00:00',
'modified' => '2018-11-22 11:58:49'
),
'User' => array(
'password' => '*****',
'id' => '34',
'user_detail_id' => '1',
'group_id' => '1',
'username' => 'neeraj.roy@newbusinessage.com',
'name' => null,
'email' => 'neeraj.roy@newbusinessage.com',
'address' => null,
'gender' => null,
'access' => '1',
'phone' => null,
'access_type' => null,
'activated' => true,
'sortorder' => null,
'published' => null,
'created' => '2020-07-19 16:40:23',
'last_login' => '2024-08-13 13:55:06',
'ip' => '172.69.41.137'
),
'ArticleComment' => array(),
'ArticleFeature' => array(),
'ArticleHasAuthor' => array(),
'ArticleHasTag' => array(),
'ArticleView' => array(
(int) 0 => array(
[maximum depth reached]
)
),
'Slider' => array()
),
'current_user' => null,
'logged_in' => false
)
$article = array(
'Article' => array(
'id' => '20237',
'article_category_id' => '1',
'title' => 'Annual Nominal Household Consumption Expenditure up by 66.23 Percent',
'sub_title' => '',
'summary' => 'February 13: The Nepal Living Standards Survey has shown that yearly spatially and temporally adjusted per capita consumption expenditures have surged by 66 percent, rising from Rs 75,902 to Rs 126,172 in real terms between 2011 and 2023.',
'content' => '<p><span style="font-size:11pt"><span style="font-family:Calibri,"sans-serif""><span style="font-size:13.0pt">February 13: The Nepal Living Standards Survey has shown that yearly spatially and temporally adjusted per capita consumption expenditures have surged by 66 percent, rising from Rs 75,902 to Rs 126,172 in real terms between 2011 and 2023. </span></span></span></p>
<p><span style="font-size:11pt"><span style="font-family:Calibri,"sans-serif""><span style="font-size:13.0pt">Over the same period, the proportion of non-food spending has escalated from an average of 38 percent to 47 percent. Moreover, the distribution of food expenditures has undergone a transformation since the previous NLSS, shifting away from cereals, which provide relatively inexpensive calories, towards more nutritious diets characterized by a greater allocation of spending on fruits, nuts, and meats, albeit these being more costly calorie sources.</span></span></span></p>
<p><span style="font-size:11pt"><span style="font-family:Calibri,"sans-serif""><span style="font-size:13.0pt">When it comes to nominal household consumption expenditure, Kathmandu Valley leads with an annual average of Rs 263,318. Following closely, urban areas of Gandaki Province records the second highest expenditure at Rs 176,542 per year, representing 67 percent of that in Kathmandu Valley. </span></span></span></p>
<p><span style="font-size:11pt"><span style="font-family:Calibri,"sans-serif""><span style="font-size:13.0pt">Conversely, the lowest average annual nominal per capita expenditures are observed in rural areas of Madhesh and Sudurpaschim provinces at Rs 71,828 and Rs 72,861 per person per year, respectively.</span></span></span></p>
<p> </p>
',
'published' => true,
'created' => '2024-02-13',
'modified' => '2024-02-13',
'keywords' => '',
'description' => '',
'sortorder' => '19964',
'image' => '20240213105500_foodbasket.jpg',
'article_date' => '2024-02-13 10:51:07',
'homepage' => false,
'breaking_news' => false,
'main_news' => true,
'in_scroller' => false,
'user_id' => '34'
),
'ArticleCategory' => array(
'id' => '1',
'name' => 'NEWS',
'parentOf' => '0',
'published' => true,
'registered' => '2015-07-20 00:00:00',
'sortorder' => '158',
'del_flag' => '0',
'homepage' => true,
'display_in_menu' => true,
'user_id' => '1',
'created' => '0000-00-00 00:00:00',
'modified' => '2018-11-22 11:58:49'
),
'User' => array(
'password' => '*****',
'id' => '34',
'user_detail_id' => '1',
'group_id' => '1',
'username' => 'neeraj.roy@newbusinessage.com',
'name' => null,
'email' => 'neeraj.roy@newbusinessage.com',
'address' => null,
'gender' => null,
'access' => '1',
'phone' => null,
'access_type' => null,
'activated' => true,
'sortorder' => null,
'published' => null,
'created' => '2020-07-19 16:40:23',
'last_login' => '2024-08-13 13:55:06',
'ip' => '172.69.41.137'
),
'ArticleComment' => array(),
'ArticleFeature' => array(),
'ArticleHasAuthor' => array(),
'ArticleHasTag' => array(),
'ArticleView' => array(
(int) 0 => array(
'article_id' => '20237',
'hit' => '638'
)
),
'Slider' => array()
)
$current_user = null
$logged_in = false
$image = 'https://old.newbusinessage.com/app/webroot/img/news/20240213105500_foodbasket.jpg'
$user = null
include - APP/View/Articles/view.ctp, line 115
View::_evaluate() - CORE/Cake/View/View.php, line 971
View::_render() - CORE/Cake/View/View.php, line 933
View::render() - CORE/Cake/View/View.php, line 473
Controller::render() - CORE/Cake/Controller/Controller.php, line 968
Dispatcher::_invoke() - CORE/Cake/Routing/Dispatcher.php, line 200
Dispatcher::dispatch() - CORE/Cake/Routing/Dispatcher.php, line 167
[main] - APP/webroot/index.php, line 117
Notice (8): Trying to access array offset on value of type null [APP/View/Articles/view.ctp, line 116]
//find the group of logged user
$groupId = $user['Group']['id'];
$user_id=$user["id"];
$viewFile = '/var/www/html/newbusinessage.com/app/View/Articles/view.ctp'
$dataForView = array(
'article' => array(
'Article' => array(
'id' => '20237',
'article_category_id' => '1',
'title' => 'Annual Nominal Household Consumption Expenditure up by 66.23 Percent',
'sub_title' => '',
'summary' => 'February 13: The Nepal Living Standards Survey has shown that yearly spatially and temporally adjusted per capita consumption expenditures have surged by 66 percent, rising from Rs 75,902 to Rs 126,172 in real terms between 2011 and 2023.',
'content' => '<p><span style="font-size:11pt"><span style="font-family:Calibri,"sans-serif""><span style="font-size:13.0pt">February 13: The Nepal Living Standards Survey has shown that yearly spatially and temporally adjusted per capita consumption expenditures have surged by 66 percent, rising from Rs 75,902 to Rs 126,172 in real terms between 2011 and 2023. </span></span></span></p>
<p><span style="font-size:11pt"><span style="font-family:Calibri,"sans-serif""><span style="font-size:13.0pt">Over the same period, the proportion of non-food spending has escalated from an average of 38 percent to 47 percent. Moreover, the distribution of food expenditures has undergone a transformation since the previous NLSS, shifting away from cereals, which provide relatively inexpensive calories, towards more nutritious diets characterized by a greater allocation of spending on fruits, nuts, and meats, albeit these being more costly calorie sources.</span></span></span></p>
<p><span style="font-size:11pt"><span style="font-family:Calibri,"sans-serif""><span style="font-size:13.0pt">When it comes to nominal household consumption expenditure, Kathmandu Valley leads with an annual average of Rs 263,318. Following closely, urban areas of Gandaki Province records the second highest expenditure at Rs 176,542 per year, representing 67 percent of that in Kathmandu Valley. </span></span></span></p>
<p><span style="font-size:11pt"><span style="font-family:Calibri,"sans-serif""><span style="font-size:13.0pt">Conversely, the lowest average annual nominal per capita expenditures are observed in rural areas of Madhesh and Sudurpaschim provinces at Rs 71,828 and Rs 72,861 per person per year, respectively.</span></span></span></p>
<p> </p>
',
'published' => true,
'created' => '2024-02-13',
'modified' => '2024-02-13',
'keywords' => '',
'description' => '',
'sortorder' => '19964',
'image' => '20240213105500_foodbasket.jpg',
'article_date' => '2024-02-13 10:51:07',
'homepage' => false,
'breaking_news' => false,
'main_news' => true,
'in_scroller' => false,
'user_id' => '34'
),
'ArticleCategory' => array(
'id' => '1',
'name' => 'NEWS',
'parentOf' => '0',
'published' => true,
'registered' => '2015-07-20 00:00:00',
'sortorder' => '158',
'del_flag' => '0',
'homepage' => true,
'display_in_menu' => true,
'user_id' => '1',
'created' => '0000-00-00 00:00:00',
'modified' => '2018-11-22 11:58:49'
),
'User' => array(
'password' => '*****',
'id' => '34',
'user_detail_id' => '1',
'group_id' => '1',
'username' => 'neeraj.roy@newbusinessage.com',
'name' => null,
'email' => 'neeraj.roy@newbusinessage.com',
'address' => null,
'gender' => null,
'access' => '1',
'phone' => null,
'access_type' => null,
'activated' => true,
'sortorder' => null,
'published' => null,
'created' => '2020-07-19 16:40:23',
'last_login' => '2024-08-13 13:55:06',
'ip' => '172.69.41.137'
),
'ArticleComment' => array(),
'ArticleFeature' => array(),
'ArticleHasAuthor' => array(),
'ArticleHasTag' => array(),
'ArticleView' => array(
(int) 0 => array(
[maximum depth reached]
)
),
'Slider' => array()
),
'current_user' => null,
'logged_in' => false
)
$article = array(
'Article' => array(
'id' => '20237',
'article_category_id' => '1',
'title' => 'Annual Nominal Household Consumption Expenditure up by 66.23 Percent',
'sub_title' => '',
'summary' => 'February 13: The Nepal Living Standards Survey has shown that yearly spatially and temporally adjusted per capita consumption expenditures have surged by 66 percent, rising from Rs 75,902 to Rs 126,172 in real terms between 2011 and 2023.',
'content' => '<p><span style="font-size:11pt"><span style="font-family:Calibri,"sans-serif""><span style="font-size:13.0pt">February 13: The Nepal Living Standards Survey has shown that yearly spatially and temporally adjusted per capita consumption expenditures have surged by 66 percent, rising from Rs 75,902 to Rs 126,172 in real terms between 2011 and 2023. </span></span></span></p>
<p><span style="font-size:11pt"><span style="font-family:Calibri,"sans-serif""><span style="font-size:13.0pt">Over the same period, the proportion of non-food spending has escalated from an average of 38 percent to 47 percent. Moreover, the distribution of food expenditures has undergone a transformation since the previous NLSS, shifting away from cereals, which provide relatively inexpensive calories, towards more nutritious diets characterized by a greater allocation of spending on fruits, nuts, and meats, albeit these being more costly calorie sources.</span></span></span></p>
<p><span style="font-size:11pt"><span style="font-family:Calibri,"sans-serif""><span style="font-size:13.0pt">When it comes to nominal household consumption expenditure, Kathmandu Valley leads with an annual average of Rs 263,318. Following closely, urban areas of Gandaki Province records the second highest expenditure at Rs 176,542 per year, representing 67 percent of that in Kathmandu Valley. </span></span></span></p>
<p><span style="font-size:11pt"><span style="font-family:Calibri,"sans-serif""><span style="font-size:13.0pt">Conversely, the lowest average annual nominal per capita expenditures are observed in rural areas of Madhesh and Sudurpaschim provinces at Rs 71,828 and Rs 72,861 per person per year, respectively.</span></span></span></p>
<p> </p>
',
'published' => true,
'created' => '2024-02-13',
'modified' => '2024-02-13',
'keywords' => '',
'description' => '',
'sortorder' => '19964',
'image' => '20240213105500_foodbasket.jpg',
'article_date' => '2024-02-13 10:51:07',
'homepage' => false,
'breaking_news' => false,
'main_news' => true,
'in_scroller' => false,
'user_id' => '34'
),
'ArticleCategory' => array(
'id' => '1',
'name' => 'NEWS',
'parentOf' => '0',
'published' => true,
'registered' => '2015-07-20 00:00:00',
'sortorder' => '158',
'del_flag' => '0',
'homepage' => true,
'display_in_menu' => true,
'user_id' => '1',
'created' => '0000-00-00 00:00:00',
'modified' => '2018-11-22 11:58:49'
),
'User' => array(
'password' => '*****',
'id' => '34',
'user_detail_id' => '1',
'group_id' => '1',
'username' => 'neeraj.roy@newbusinessage.com',
'name' => null,
'email' => 'neeraj.roy@newbusinessage.com',
'address' => null,
'gender' => null,
'access' => '1',
'phone' => null,
'access_type' => null,
'activated' => true,
'sortorder' => null,
'published' => null,
'created' => '2020-07-19 16:40:23',
'last_login' => '2024-08-13 13:55:06',
'ip' => '172.69.41.137'
),
'ArticleComment' => array(),
'ArticleFeature' => array(),
'ArticleHasAuthor' => array(),
'ArticleHasTag' => array(),
'ArticleView' => array(
(int) 0 => array(
'article_id' => '20237',
'hit' => '638'
)
),
'Slider' => array()
)
$current_user = null
$logged_in = false
$image = 'https://old.newbusinessage.com/app/webroot/img/news/20240213105500_foodbasket.jpg'
$user = null
$groupId = null
include - APP/View/Articles/view.ctp, line 116
View::_evaluate() - CORE/Cake/View/View.php, line 971
View::_render() - CORE/Cake/View/View.php, line 933
View::render() - CORE/Cake/View/View.php, line 473
Controller::render() - CORE/Cake/Controller/Controller.php, line 968
Dispatcher::_invoke() - CORE/Cake/Routing/Dispatcher.php, line 200
Dispatcher::dispatch() - CORE/Cake/Routing/Dispatcher.php, line 167
[main] - APP/webroot/index.php, line 117
$viewFile = '/var/www/html/newbusinessage.com/app/View/Articles/view.ctp'
$dataForView = array(
'article' => array(
'Article' => array(
'id' => '20237',
'article_category_id' => '1',
'title' => 'Annual Nominal Household Consumption Expenditure up by 66.23 Percent',
'sub_title' => '',
'summary' => 'February 13: The Nepal Living Standards Survey has shown that yearly spatially and temporally adjusted per capita consumption expenditures have surged by 66 percent, rising from Rs 75,902 to Rs 126,172 in real terms between 2011 and 2023.',
'content' => '<p><span style="font-size:11pt"><span style="font-family:Calibri,"sans-serif""><span style="font-size:13.0pt">February 13: The Nepal Living Standards Survey has shown that yearly spatially and temporally adjusted per capita consumption expenditures have surged by 66 percent, rising from Rs 75,902 to Rs 126,172 in real terms between 2011 and 2023. </span></span></span></p>
<p><span style="font-size:11pt"><span style="font-family:Calibri,"sans-serif""><span style="font-size:13.0pt">Over the same period, the proportion of non-food spending has escalated from an average of 38 percent to 47 percent. Moreover, the distribution of food expenditures has undergone a transformation since the previous NLSS, shifting away from cereals, which provide relatively inexpensive calories, towards more nutritious diets characterized by a greater allocation of spending on fruits, nuts, and meats, albeit these being more costly calorie sources.</span></span></span></p>
<p><span style="font-size:11pt"><span style="font-family:Calibri,"sans-serif""><span style="font-size:13.0pt">When it comes to nominal household consumption expenditure, Kathmandu Valley leads with an annual average of Rs 263,318. Following closely, urban areas of Gandaki Province records the second highest expenditure at Rs 176,542 per year, representing 67 percent of that in Kathmandu Valley. </span></span></span></p>
<p><span style="font-size:11pt"><span style="font-family:Calibri,"sans-serif""><span style="font-size:13.0pt">Conversely, the lowest average annual nominal per capita expenditures are observed in rural areas of Madhesh and Sudurpaschim provinces at Rs 71,828 and Rs 72,861 per person per year, respectively.</span></span></span></p>
<p> </p>
',
'published' => true,
'created' => '2024-02-13',
'modified' => '2024-02-13',
'keywords' => '',
'description' => '',
'sortorder' => '19964',
'image' => '20240213105500_foodbasket.jpg',
'article_date' => '2024-02-13 10:51:07',
'homepage' => false,
'breaking_news' => false,
'main_news' => true,
'in_scroller' => false,
'user_id' => '34'
),
'ArticleCategory' => array(
'id' => '1',
'name' => 'NEWS',
'parentOf' => '0',
'published' => true,
'registered' => '2015-07-20 00:00:00',
'sortorder' => '158',
'del_flag' => '0',
'homepage' => true,
'display_in_menu' => true,
'user_id' => '1',
'created' => '0000-00-00 00:00:00',
'modified' => '2018-11-22 11:58:49'
),
'User' => array(
'password' => '*****',
'id' => '34',
'user_detail_id' => '1',
'group_id' => '1',
'username' => 'neeraj.roy@newbusinessage.com',
'name' => null,
'email' => 'neeraj.roy@newbusinessage.com',
'address' => null,
'gender' => null,
'access' => '1',
'phone' => null,
'access_type' => null,
'activated' => true,
'sortorder' => null,
'published' => null,
'created' => '2020-07-19 16:40:23',
'last_login' => '2024-08-13 13:55:06',
'ip' => '172.69.41.137'
),
'ArticleComment' => array(),
'ArticleFeature' => array(),
'ArticleHasAuthor' => array(),
'ArticleHasTag' => array(),
'ArticleView' => array(
(int) 0 => array(
[maximum depth reached]
)
),
'Slider' => array()
),
'current_user' => null,
'logged_in' => false
)
$article = array(
'Article' => array(
'id' => '20237',
'article_category_id' => '1',
'title' => 'Annual Nominal Household Consumption Expenditure up by 66.23 Percent',
'sub_title' => '',
'summary' => 'February 13: The Nepal Living Standards Survey has shown that yearly spatially and temporally adjusted per capita consumption expenditures have surged by 66 percent, rising from Rs 75,902 to Rs 126,172 in real terms between 2011 and 2023.',
'content' => '<p><span style="font-size:11pt"><span style="font-family:Calibri,"sans-serif""><span style="font-size:13.0pt">February 13: The Nepal Living Standards Survey has shown that yearly spatially and temporally adjusted per capita consumption expenditures have surged by 66 percent, rising from Rs 75,902 to Rs 126,172 in real terms between 2011 and 2023. </span></span></span></p>
<p><span style="font-size:11pt"><span style="font-family:Calibri,"sans-serif""><span style="font-size:13.0pt">Over the same period, the proportion of non-food spending has escalated from an average of 38 percent to 47 percent. Moreover, the distribution of food expenditures has undergone a transformation since the previous NLSS, shifting away from cereals, which provide relatively inexpensive calories, towards more nutritious diets characterized by a greater allocation of spending on fruits, nuts, and meats, albeit these being more costly calorie sources.</span></span></span></p>
<p><span style="font-size:11pt"><span style="font-family:Calibri,"sans-serif""><span style="font-size:13.0pt">When it comes to nominal household consumption expenditure, Kathmandu Valley leads with an annual average of Rs 263,318. Following closely, urban areas of Gandaki Province records the second highest expenditure at Rs 176,542 per year, representing 67 percent of that in Kathmandu Valley. </span></span></span></p>
<p><span style="font-size:11pt"><span style="font-family:Calibri,"sans-serif""><span style="font-size:13.0pt">Conversely, the lowest average annual nominal per capita expenditures are observed in rural areas of Madhesh and Sudurpaschim provinces at Rs 71,828 and Rs 72,861 per person per year, respectively.</span></span></span></p>
<p> </p>
',
'published' => true,
'created' => '2024-02-13',
'modified' => '2024-02-13',
'keywords' => '',
'description' => '',
'sortorder' => '19964',
'image' => '20240213105500_foodbasket.jpg',
'article_date' => '2024-02-13 10:51:07',
'homepage' => false,
'breaking_news' => false,
'main_news' => true,
'in_scroller' => false,
'user_id' => '34'
),
'ArticleCategory' => array(
'id' => '1',
'name' => 'NEWS',
'parentOf' => '0',
'published' => true,
'registered' => '2015-07-20 00:00:00',
'sortorder' => '158',
'del_flag' => '0',
'homepage' => true,
'display_in_menu' => true,
'user_id' => '1',
'created' => '0000-00-00 00:00:00',
'modified' => '2018-11-22 11:58:49'
),
'User' => array(
'password' => '*****',
'id' => '34',
'user_detail_id' => '1',
'group_id' => '1',
'username' => 'neeraj.roy@newbusinessage.com',
'name' => null,
'email' => 'neeraj.roy@newbusinessage.com',
'address' => null,
'gender' => null,
'access' => '1',
'phone' => null,
'access_type' => null,
'activated' => true,
'sortorder' => null,
'published' => null,
'created' => '2020-07-19 16:40:23',
'last_login' => '2024-08-13 13:55:06',
'ip' => '172.69.41.137'
),
'ArticleComment' => array(),
'ArticleFeature' => array(),
'ArticleHasAuthor' => array(),
'ArticleHasTag' => array(),
'ArticleView' => array(
(int) 0 => array(
'article_id' => '20237',
'hit' => '638'
)
),
'Slider' => array()
)
$current_user = null
$logged_in = false
$image = 'https://old.newbusinessage.com/app/webroot/img/news/20240213105500_foodbasket.jpg'
$user = null
$groupId = null
$user_id = null
$date = '2024-02-13 10:51:07'
$dateFromDatabase = (int) 1707800767
$newDate = 'Feb 13, 2024'
$articleView = array(
'article_id' => '20237',
'hit' => '638'
)
$word_count = (int) 247
$time_to_read = (float) 1.24
$time_to_read_min = (float) 1
$time_to_read_second = (float) 14
include - APP/View/Articles/view.ctp, line 241
View::_evaluate() - CORE/Cake/View/View.php, line 971
View::_render() - CORE/Cake/View/View.php, line 933
View::render() - CORE/Cake/View/View.php, line 473
Controller::render() - CORE/Cake/Controller/Controller.php, line 968
Dispatcher::_invoke() - CORE/Cake/Routing/Dispatcher.php, line 200
Dispatcher::dispatch() - CORE/Cake/Routing/Dispatcher.php, line 167
[main] - APP/webroot/index.php, line 117
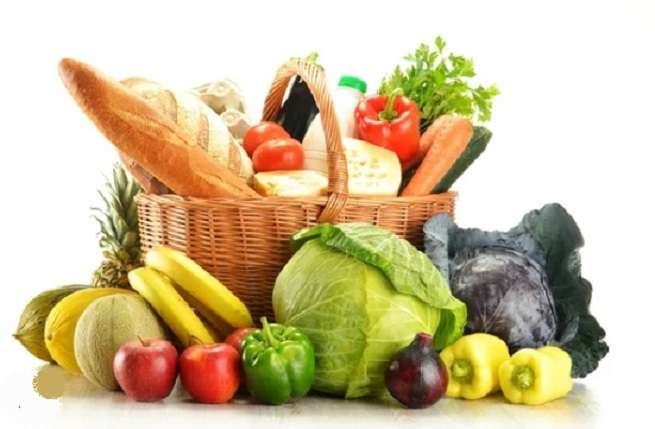
February 13: The Nepal Living Standards Survey has shown that yearly spatially and temporally adjusted per capita consumption expenditures have surged by 66 percent, rising from Rs 75,902 to Rs 126,172 in real terms between 2011 and 2023.
Over the same period, the proportion of non-food spending has escalated from an average of 38 percent to 47 percent. Moreover, the distribution of food expenditures has undergone a transformation since the previous NLSS, shifting away from cereals, which provide relatively inexpensive calories, towards more nutritious diets characterized by a greater allocation of spending on fruits, nuts, and meats, albeit these being more costly calorie sources.
When it comes to nominal household consumption expenditure, Kathmandu Valley leads with an annual average of Rs 263,318. Following closely, urban areas of Gandaki Province records the second highest expenditure at Rs 176,542 per year, representing 67 percent of that in Kathmandu Valley.
Conversely, the lowest average annual nominal per capita expenditures are observed in rural areas of Madhesh and Sudurpaschim provinces at Rs 71,828 and Rs 72,861 per person per year, respectively.
FormHelper::create() - CORE/Cake/View/Helper/FormHelper.php, line 383
include - APP/View/Articles/view.ctp, line 273
View::_evaluate() - CORE/Cake/View/View.php, line 971
View::_render() - CORE/Cake/View/View.php, line 933
View::render() - CORE/Cake/View/View.php, line 473
Controller::render() - CORE/Cake/Controller/Controller.php, line 968
Dispatcher::_invoke() - CORE/Cake/Routing/Dispatcher.php, line 200
Dispatcher::dispatch() - CORE/Cake/Routing/Dispatcher.php, line 167
[main] - APP/webroot/index.php, line 117
$viewFile = '/var/www/html/newbusinessage.com/app/View/Elements/side_bar.ctp'
$dataForView = array(
'article' => array(
'Article' => array(
'id' => '20237',
'article_category_id' => '1',
'title' => 'Annual Nominal Household Consumption Expenditure up by 66.23 Percent',
'sub_title' => '',
'summary' => 'February 13: The Nepal Living Standards Survey has shown that yearly spatially and temporally adjusted per capita consumption expenditures have surged by 66 percent, rising from Rs 75,902 to Rs 126,172 in real terms between 2011 and 2023.',
'content' => '<p><span style="font-size:11pt"><span style="font-family:Calibri,"sans-serif""><span style="font-size:13.0pt">February 13: The Nepal Living Standards Survey has shown that yearly spatially and temporally adjusted per capita consumption expenditures have surged by 66 percent, rising from Rs 75,902 to Rs 126,172 in real terms between 2011 and 2023. </span></span></span></p>
<p><span style="font-size:11pt"><span style="font-family:Calibri,"sans-serif""><span style="font-size:13.0pt">Over the same period, the proportion of non-food spending has escalated from an average of 38 percent to 47 percent. Moreover, the distribution of food expenditures has undergone a transformation since the previous NLSS, shifting away from cereals, which provide relatively inexpensive calories, towards more nutritious diets characterized by a greater allocation of spending on fruits, nuts, and meats, albeit these being more costly calorie sources.</span></span></span></p>
<p><span style="font-size:11pt"><span style="font-family:Calibri,"sans-serif""><span style="font-size:13.0pt">When it comes to nominal household consumption expenditure, Kathmandu Valley leads with an annual average of Rs 263,318. Following closely, urban areas of Gandaki Province records the second highest expenditure at Rs 176,542 per year, representing 67 percent of that in Kathmandu Valley. </span></span></span></p>
<p><span style="font-size:11pt"><span style="font-family:Calibri,"sans-serif""><span style="font-size:13.0pt">Conversely, the lowest average annual nominal per capita expenditures are observed in rural areas of Madhesh and Sudurpaschim provinces at Rs 71,828 and Rs 72,861 per person per year, respectively.</span></span></span></p>
<p> </p>
',
'published' => true,
'created' => '2024-02-13',
'modified' => '2024-02-13',
'keywords' => '',
'description' => '',
'sortorder' => '19964',
'image' => '20240213105500_foodbasket.jpg',
'article_date' => '2024-02-13 10:51:07',
'homepage' => false,
'breaking_news' => false,
'main_news' => true,
'in_scroller' => false,
'user_id' => '34'
),
'ArticleCategory' => array(
'id' => '1',
'name' => 'NEWS',
'parentOf' => '0',
'published' => true,
'registered' => '2015-07-20 00:00:00',
'sortorder' => '158',
'del_flag' => '0',
'homepage' => true,
'display_in_menu' => true,
'user_id' => '1',
'created' => '0000-00-00 00:00:00',
'modified' => '2018-11-22 11:58:49'
),
'User' => array(
'password' => '*****',
'id' => '34',
'user_detail_id' => '1',
'group_id' => '1',
'username' => 'neeraj.roy@newbusinessage.com',
'name' => null,
'email' => 'neeraj.roy@newbusinessage.com',
'address' => null,
'gender' => null,
'access' => '1',
'phone' => null,
'access_type' => null,
'activated' => true,
'sortorder' => null,
'published' => null,
'created' => '2020-07-19 16:40:23',
'last_login' => '2024-08-13 13:55:06',
'ip' => '172.69.41.137'
),
'ArticleComment' => array(),
'ArticleFeature' => array(),
'ArticleHasAuthor' => array(),
'ArticleHasTag' => array(),
'ArticleView' => array(
(int) 0 => array(
[maximum depth reached]
)
),
'Slider' => array()
),
'current_user' => null,
'logged_in' => false
)
$article = array(
'Article' => array(
'id' => '20237',
'article_category_id' => '1',
'title' => 'Annual Nominal Household Consumption Expenditure up by 66.23 Percent',
'sub_title' => '',
'summary' => 'February 13: The Nepal Living Standards Survey has shown that yearly spatially and temporally adjusted per capita consumption expenditures have surged by 66 percent, rising from Rs 75,902 to Rs 126,172 in real terms between 2011 and 2023.',
'content' => '<p><span style="font-size:11pt"><span style="font-family:Calibri,"sans-serif""><span style="font-size:13.0pt">February 13: The Nepal Living Standards Survey has shown that yearly spatially and temporally adjusted per capita consumption expenditures have surged by 66 percent, rising from Rs 75,902 to Rs 126,172 in real terms between 2011 and 2023. </span></span></span></p>
<p><span style="font-size:11pt"><span style="font-family:Calibri,"sans-serif""><span style="font-size:13.0pt">Over the same period, the proportion of non-food spending has escalated from an average of 38 percent to 47 percent. Moreover, the distribution of food expenditures has undergone a transformation since the previous NLSS, shifting away from cereals, which provide relatively inexpensive calories, towards more nutritious diets characterized by a greater allocation of spending on fruits, nuts, and meats, albeit these being more costly calorie sources.</span></span></span></p>
<p><span style="font-size:11pt"><span style="font-family:Calibri,"sans-serif""><span style="font-size:13.0pt">When it comes to nominal household consumption expenditure, Kathmandu Valley leads with an annual average of Rs 263,318. Following closely, urban areas of Gandaki Province records the second highest expenditure at Rs 176,542 per year, representing 67 percent of that in Kathmandu Valley. </span></span></span></p>
<p><span style="font-size:11pt"><span style="font-family:Calibri,"sans-serif""><span style="font-size:13.0pt">Conversely, the lowest average annual nominal per capita expenditures are observed in rural areas of Madhesh and Sudurpaschim provinces at Rs 71,828 and Rs 72,861 per person per year, respectively.</span></span></span></p>
<p> </p>
',
'published' => true,
'created' => '2024-02-13',
'modified' => '2024-02-13',
'keywords' => '',
'description' => '',
'sortorder' => '19964',
'image' => '20240213105500_foodbasket.jpg',
'article_date' => '2024-02-13 10:51:07',
'homepage' => false,
'breaking_news' => false,
'main_news' => true,
'in_scroller' => false,
'user_id' => '34'
),
'ArticleCategory' => array(
'id' => '1',
'name' => 'NEWS',
'parentOf' => '0',
'published' => true,
'registered' => '2015-07-20 00:00:00',
'sortorder' => '158',
'del_flag' => '0',
'homepage' => true,
'display_in_menu' => true,
'user_id' => '1',
'created' => '0000-00-00 00:00:00',
'modified' => '2018-11-22 11:58:49'
),
'User' => array(
'password' => '*****',
'id' => '34',
'user_detail_id' => '1',
'group_id' => '1',
'username' => 'neeraj.roy@newbusinessage.com',
'name' => null,
'email' => 'neeraj.roy@newbusinessage.com',
'address' => null,
'gender' => null,
'access' => '1',
'phone' => null,
'access_type' => null,
'activated' => true,
'sortorder' => null,
'published' => null,
'created' => '2020-07-19 16:40:23',
'last_login' => '2024-08-13 13:55:06',
'ip' => '172.69.41.137'
),
'ArticleComment' => array(),
'ArticleFeature' => array(),
'ArticleHasAuthor' => array(),
'ArticleHasTag' => array(),
'ArticleView' => array(
(int) 0 => array(
'article_id' => '20237',
'hit' => '638'
)
),
'Slider' => array()
)
$current_user = null
$logged_in = false
include - APP/View/Elements/side_bar.ctp, line 60
View::_evaluate() - CORE/Cake/View/View.php, line 971
View::_render() - CORE/Cake/View/View.php, line 933
View::_renderElement() - CORE/Cake/View/View.php, line 1224
View::element() - CORE/Cake/View/View.php, line 418
include - APP/View/Articles/view.ctp, line 391
View::_evaluate() - CORE/Cake/View/View.php, line 971
View::_render() - CORE/Cake/View/View.php, line 933
View::render() - CORE/Cake/View/View.php, line 473
Controller::render() - CORE/Cake/Controller/Controller.php, line 968
Dispatcher::_invoke() - CORE/Cake/Routing/Dispatcher.php, line 200
Dispatcher::dispatch() - CORE/Cake/Routing/Dispatcher.php, line 167
[main] - APP/webroot/index.php, line 117
Warning (2): simplexml_load_file() [<a href='http://php.net/function.simplexml-load-file'>function.simplexml-load-file</a>]: I/O warning : failed to load external entity "" [APP/View/Elements/side_bar.ctp, line 60]
$viewFile = '/var/www/html/newbusinessage.com/app/View/Elements/side_bar.ctp'
$dataForView = array(
'article' => array(
'Article' => array(
'id' => '20237',
'article_category_id' => '1',
'title' => 'Annual Nominal Household Consumption Expenditure up by 66.23 Percent',
'sub_title' => '',
'summary' => 'February 13: The Nepal Living Standards Survey has shown that yearly spatially and temporally adjusted per capita consumption expenditures have surged by 66 percent, rising from Rs 75,902 to Rs 126,172 in real terms between 2011 and 2023.',
'content' => '<p><span style="font-size:11pt"><span style="font-family:Calibri,"sans-serif""><span style="font-size:13.0pt">February 13: The Nepal Living Standards Survey has shown that yearly spatially and temporally adjusted per capita consumption expenditures have surged by 66 percent, rising from Rs 75,902 to Rs 126,172 in real terms between 2011 and 2023. </span></span></span></p>
<p><span style="font-size:11pt"><span style="font-family:Calibri,"sans-serif""><span style="font-size:13.0pt">Over the same period, the proportion of non-food spending has escalated from an average of 38 percent to 47 percent. Moreover, the distribution of food expenditures has undergone a transformation since the previous NLSS, shifting away from cereals, which provide relatively inexpensive calories, towards more nutritious diets characterized by a greater allocation of spending on fruits, nuts, and meats, albeit these being more costly calorie sources.</span></span></span></p>
<p><span style="font-size:11pt"><span style="font-family:Calibri,"sans-serif""><span style="font-size:13.0pt">When it comes to nominal household consumption expenditure, Kathmandu Valley leads with an annual average of Rs 263,318. Following closely, urban areas of Gandaki Province records the second highest expenditure at Rs 176,542 per year, representing 67 percent of that in Kathmandu Valley. </span></span></span></p>
<p><span style="font-size:11pt"><span style="font-family:Calibri,"sans-serif""><span style="font-size:13.0pt">Conversely, the lowest average annual nominal per capita expenditures are observed in rural areas of Madhesh and Sudurpaschim provinces at Rs 71,828 and Rs 72,861 per person per year, respectively.</span></span></span></p>
<p> </p>
',
'published' => true,
'created' => '2024-02-13',
'modified' => '2024-02-13',
'keywords' => '',
'description' => '',
'sortorder' => '19964',
'image' => '20240213105500_foodbasket.jpg',
'article_date' => '2024-02-13 10:51:07',
'homepage' => false,
'breaking_news' => false,
'main_news' => true,
'in_scroller' => false,
'user_id' => '34'
),
'ArticleCategory' => array(
'id' => '1',
'name' => 'NEWS',
'parentOf' => '0',
'published' => true,
'registered' => '2015-07-20 00:00:00',
'sortorder' => '158',
'del_flag' => '0',
'homepage' => true,
'display_in_menu' => true,
'user_id' => '1',
'created' => '0000-00-00 00:00:00',
'modified' => '2018-11-22 11:58:49'
),
'User' => array(
'password' => '*****',
'id' => '34',
'user_detail_id' => '1',
'group_id' => '1',
'username' => 'neeraj.roy@newbusinessage.com',
'name' => null,
'email' => 'neeraj.roy@newbusinessage.com',
'address' => null,
'gender' => null,
'access' => '1',
'phone' => null,
'access_type' => null,
'activated' => true,
'sortorder' => null,
'published' => null,
'created' => '2020-07-19 16:40:23',
'last_login' => '2024-08-13 13:55:06',
'ip' => '172.69.41.137'
),
'ArticleComment' => array(),
'ArticleFeature' => array(),
'ArticleHasAuthor' => array(),
'ArticleHasTag' => array(),
'ArticleView' => array(
(int) 0 => array(
[maximum depth reached]
)
),
'Slider' => array()
),
'current_user' => null,
'logged_in' => false
)
$article = array(
'Article' => array(
'id' => '20237',
'article_category_id' => '1',
'title' => 'Annual Nominal Household Consumption Expenditure up by 66.23 Percent',
'sub_title' => '',
'summary' => 'February 13: The Nepal Living Standards Survey has shown that yearly spatially and temporally adjusted per capita consumption expenditures have surged by 66 percent, rising from Rs 75,902 to Rs 126,172 in real terms between 2011 and 2023.',
'content' => '<p><span style="font-size:11pt"><span style="font-family:Calibri,"sans-serif""><span style="font-size:13.0pt">February 13: The Nepal Living Standards Survey has shown that yearly spatially and temporally adjusted per capita consumption expenditures have surged by 66 percent, rising from Rs 75,902 to Rs 126,172 in real terms between 2011 and 2023. </span></span></span></p>
<p><span style="font-size:11pt"><span style="font-family:Calibri,"sans-serif""><span style="font-size:13.0pt">Over the same period, the proportion of non-food spending has escalated from an average of 38 percent to 47 percent. Moreover, the distribution of food expenditures has undergone a transformation since the previous NLSS, shifting away from cereals, which provide relatively inexpensive calories, towards more nutritious diets characterized by a greater allocation of spending on fruits, nuts, and meats, albeit these being more costly calorie sources.</span></span></span></p>
<p><span style="font-size:11pt"><span style="font-family:Calibri,"sans-serif""><span style="font-size:13.0pt">When it comes to nominal household consumption expenditure, Kathmandu Valley leads with an annual average of Rs 263,318. Following closely, urban areas of Gandaki Province records the second highest expenditure at Rs 176,542 per year, representing 67 percent of that in Kathmandu Valley. </span></span></span></p>
<p><span style="font-size:11pt"><span style="font-family:Calibri,"sans-serif""><span style="font-size:13.0pt">Conversely, the lowest average annual nominal per capita expenditures are observed in rural areas of Madhesh and Sudurpaschim provinces at Rs 71,828 and Rs 72,861 per person per year, respectively.</span></span></span></p>
<p> </p>
',
'published' => true,
'created' => '2024-02-13',
'modified' => '2024-02-13',
'keywords' => '',
'description' => '',
'sortorder' => '19964',
'image' => '20240213105500_foodbasket.jpg',
'article_date' => '2024-02-13 10:51:07',
'homepage' => false,
'breaking_news' => false,
'main_news' => true,
'in_scroller' => false,
'user_id' => '34'
),
'ArticleCategory' => array(
'id' => '1',
'name' => 'NEWS',
'parentOf' => '0',
'published' => true,
'registered' => '2015-07-20 00:00:00',
'sortorder' => '158',
'del_flag' => '0',
'homepage' => true,
'display_in_menu' => true,
'user_id' => '1',
'created' => '0000-00-00 00:00:00',
'modified' => '2018-11-22 11:58:49'
),
'User' => array(
'password' => '*****',
'id' => '34',
'user_detail_id' => '1',
'group_id' => '1',
'username' => 'neeraj.roy@newbusinessage.com',
'name' => null,
'email' => 'neeraj.roy@newbusinessage.com',
'address' => null,
'gender' => null,
'access' => '1',
'phone' => null,
'access_type' => null,
'activated' => true,
'sortorder' => null,
'published' => null,
'created' => '2020-07-19 16:40:23',
'last_login' => '2024-08-13 13:55:06',
'ip' => '172.69.41.137'
),
'ArticleComment' => array(),
'ArticleFeature' => array(),
'ArticleHasAuthor' => array(),
'ArticleHasTag' => array(),
'ArticleView' => array(
(int) 0 => array(
'article_id' => '20237',
'hit' => '638'
)
),
'Slider' => array()
)
$current_user = null
$logged_in = false
simplexml_load_file - [internal], line ??
include - APP/View/Elements/side_bar.ctp, line 60
View::_evaluate() - CORE/Cake/View/View.php, line 971
View::_render() - CORE/Cake/View/View.php, line 933
View::_renderElement() - CORE/Cake/View/View.php, line 1224
View::element() - CORE/Cake/View/View.php, line 418
include - APP/View/Articles/view.ctp, line 391
View::_evaluate() - CORE/Cake/View/View.php, line 971
View::_render() - CORE/Cake/View/View.php, line 933
View::render() - CORE/Cake/View/View.php, line 473
Controller::render() - CORE/Cake/Controller/Controller.php, line 968
Dispatcher::_invoke() - CORE/Cake/Routing/Dispatcher.php, line 200
Dispatcher::dispatch() - CORE/Cake/Routing/Dispatcher.php, line 167
[main] - APP/webroot/index.php, line 117
file not found!
Notice (8): Undefined variable: file [APP/View/Elements/side_bar.ctp, line 133]
$viewFile = '/var/www/html/newbusinessage.com/app/View/Elements/side_bar.ctp'
$dataForView = array(
'article' => array(
'Article' => array(
'id' => '20237',
'article_category_id' => '1',
'title' => 'Annual Nominal Household Consumption Expenditure up by 66.23 Percent',
'sub_title' => '',
'summary' => 'February 13: The Nepal Living Standards Survey has shown that yearly spatially and temporally adjusted per capita consumption expenditures have surged by 66 percent, rising from Rs 75,902 to Rs 126,172 in real terms between 2011 and 2023.',
'content' => '<p><span style="font-size:11pt"><span style="font-family:Calibri,"sans-serif""><span style="font-size:13.0pt">February 13: The Nepal Living Standards Survey has shown that yearly spatially and temporally adjusted per capita consumption expenditures have surged by 66 percent, rising from Rs 75,902 to Rs 126,172 in real terms between 2011 and 2023. </span></span></span></p>
<p><span style="font-size:11pt"><span style="font-family:Calibri,"sans-serif""><span style="font-size:13.0pt">Over the same period, the proportion of non-food spending has escalated from an average of 38 percent to 47 percent. Moreover, the distribution of food expenditures has undergone a transformation since the previous NLSS, shifting away from cereals, which provide relatively inexpensive calories, towards more nutritious diets characterized by a greater allocation of spending on fruits, nuts, and meats, albeit these being more costly calorie sources.</span></span></span></p>
<p><span style="font-size:11pt"><span style="font-family:Calibri,"sans-serif""><span style="font-size:13.0pt">When it comes to nominal household consumption expenditure, Kathmandu Valley leads with an annual average of Rs 263,318. Following closely, urban areas of Gandaki Province records the second highest expenditure at Rs 176,542 per year, representing 67 percent of that in Kathmandu Valley. </span></span></span></p>
<p><span style="font-size:11pt"><span style="font-family:Calibri,"sans-serif""><span style="font-size:13.0pt">Conversely, the lowest average annual nominal per capita expenditures are observed in rural areas of Madhesh and Sudurpaschim provinces at Rs 71,828 and Rs 72,861 per person per year, respectively.</span></span></span></p>
<p> </p>
',
'published' => true,
'created' => '2024-02-13',
'modified' => '2024-02-13',
'keywords' => '',
'description' => '',
'sortorder' => '19964',
'image' => '20240213105500_foodbasket.jpg',
'article_date' => '2024-02-13 10:51:07',
'homepage' => false,
'breaking_news' => false,
'main_news' => true,
'in_scroller' => false,
'user_id' => '34'
),
'ArticleCategory' => array(
'id' => '1',
'name' => 'NEWS',
'parentOf' => '0',
'published' => true,
'registered' => '2015-07-20 00:00:00',
'sortorder' => '158',
'del_flag' => '0',
'homepage' => true,
'display_in_menu' => true,
'user_id' => '1',
'created' => '0000-00-00 00:00:00',
'modified' => '2018-11-22 11:58:49'
),
'User' => array(
'password' => '*****',
'id' => '34',
'user_detail_id' => '1',
'group_id' => '1',
'username' => 'neeraj.roy@newbusinessage.com',
'name' => null,
'email' => 'neeraj.roy@newbusinessage.com',
'address' => null,
'gender' => null,
'access' => '1',
'phone' => null,
'access_type' => null,
'activated' => true,
'sortorder' => null,
'published' => null,
'created' => '2020-07-19 16:40:23',
'last_login' => '2024-08-13 13:55:06',
'ip' => '172.69.41.137'
),
'ArticleComment' => array(),
'ArticleFeature' => array(),
'ArticleHasAuthor' => array(),
'ArticleHasTag' => array(),
'ArticleView' => array(
(int) 0 => array(
[maximum depth reached]
)
),
'Slider' => array()
),
'current_user' => null,
'logged_in' => false
)
$article = array(
'Article' => array(
'id' => '20237',
'article_category_id' => '1',
'title' => 'Annual Nominal Household Consumption Expenditure up by 66.23 Percent',
'sub_title' => '',
'summary' => 'February 13: The Nepal Living Standards Survey has shown that yearly spatially and temporally adjusted per capita consumption expenditures have surged by 66 percent, rising from Rs 75,902 to Rs 126,172 in real terms between 2011 and 2023.',
'content' => '<p><span style="font-size:11pt"><span style="font-family:Calibri,"sans-serif""><span style="font-size:13.0pt">February 13: The Nepal Living Standards Survey has shown that yearly spatially and temporally adjusted per capita consumption expenditures have surged by 66 percent, rising from Rs 75,902 to Rs 126,172 in real terms between 2011 and 2023. </span></span></span></p>
<p><span style="font-size:11pt"><span style="font-family:Calibri,"sans-serif""><span style="font-size:13.0pt">Over the same period, the proportion of non-food spending has escalated from an average of 38 percent to 47 percent. Moreover, the distribution of food expenditures has undergone a transformation since the previous NLSS, shifting away from cereals, which provide relatively inexpensive calories, towards more nutritious diets characterized by a greater allocation of spending on fruits, nuts, and meats, albeit these being more costly calorie sources.</span></span></span></p>
<p><span style="font-size:11pt"><span style="font-family:Calibri,"sans-serif""><span style="font-size:13.0pt">When it comes to nominal household consumption expenditure, Kathmandu Valley leads with an annual average of Rs 263,318. Following closely, urban areas of Gandaki Province records the second highest expenditure at Rs 176,542 per year, representing 67 percent of that in Kathmandu Valley. </span></span></span></p>
<p><span style="font-size:11pt"><span style="font-family:Calibri,"sans-serif""><span style="font-size:13.0pt">Conversely, the lowest average annual nominal per capita expenditures are observed in rural areas of Madhesh and Sudurpaschim provinces at Rs 71,828 and Rs 72,861 per person per year, respectively.</span></span></span></p>
<p> </p>
',
'published' => true,
'created' => '2024-02-13',
'modified' => '2024-02-13',
'keywords' => '',
'description' => '',
'sortorder' => '19964',
'image' => '20240213105500_foodbasket.jpg',
'article_date' => '2024-02-13 10:51:07',
'homepage' => false,
'breaking_news' => false,
'main_news' => true,
'in_scroller' => false,
'user_id' => '34'
),
'ArticleCategory' => array(
'id' => '1',
'name' => 'NEWS',
'parentOf' => '0',
'published' => true,
'registered' => '2015-07-20 00:00:00',
'sortorder' => '158',
'del_flag' => '0',
'homepage' => true,
'display_in_menu' => true,
'user_id' => '1',
'created' => '0000-00-00 00:00:00',
'modified' => '2018-11-22 11:58:49'
),
'User' => array(
'password' => '*****',
'id' => '34',
'user_detail_id' => '1',
'group_id' => '1',
'username' => 'neeraj.roy@newbusinessage.com',
'name' => null,
'email' => 'neeraj.roy@newbusinessage.com',
'address' => null,
'gender' => null,
'access' => '1',
'phone' => null,
'access_type' => null,
'activated' => true,
'sortorder' => null,
'published' => null,
'created' => '2020-07-19 16:40:23',
'last_login' => '2024-08-13 13:55:06',
'ip' => '172.69.41.137'
),
'ArticleComment' => array(),
'ArticleFeature' => array(),
'ArticleHasAuthor' => array(),
'ArticleHasTag' => array(),
'ArticleView' => array(
(int) 0 => array(
'article_id' => '20237',
'hit' => '638'
)
),
'Slider' => array()
)
$current_user = null
$logged_in = false
$xml = false
include - APP/View/Elements/side_bar.ctp, line 133
View::_evaluate() - CORE/Cake/View/View.php, line 971
View::_render() - CORE/Cake/View/View.php, line 933
View::_renderElement() - CORE/Cake/View/View.php, line 1224
View::element() - CORE/Cake/View/View.php, line 418
include - APP/View/Articles/view.ctp, line 391
View::_evaluate() - CORE/Cake/View/View.php, line 971
View::_render() - CORE/Cake/View/View.php, line 933
View::render() - CORE/Cake/View/View.php, line 473
Controller::render() - CORE/Cake/Controller/Controller.php, line 968
Dispatcher::_invoke() - CORE/Cake/Routing/Dispatcher.php, line 200
Dispatcher::dispatch() - CORE/Cake/Routing/Dispatcher.php, line 167
[main] - APP/webroot/index.php, line 117
Warning (2): simplexml_load_file() [<a href='http://php.net/function.simplexml-load-file'>function.simplexml-load-file</a>]: I/O warning : failed to load external entity "" [APP/View/Elements/side_bar.ctp, line 133]
$viewFile = '/var/www/html/newbusinessage.com/app/View/Elements/side_bar.ctp'
$dataForView = array(
'article' => array(
'Article' => array(
'id' => '20237',
'article_category_id' => '1',
'title' => 'Annual Nominal Household Consumption Expenditure up by 66.23 Percent',
'sub_title' => '',
'summary' => 'February 13: The Nepal Living Standards Survey has shown that yearly spatially and temporally adjusted per capita consumption expenditures have surged by 66 percent, rising from Rs 75,902 to Rs 126,172 in real terms between 2011 and 2023.',
'content' => '<p><span style="font-size:11pt"><span style="font-family:Calibri,"sans-serif""><span style="font-size:13.0pt">February 13: The Nepal Living Standards Survey has shown that yearly spatially and temporally adjusted per capita consumption expenditures have surged by 66 percent, rising from Rs 75,902 to Rs 126,172 in real terms between 2011 and 2023. </span></span></span></p>
<p><span style="font-size:11pt"><span style="font-family:Calibri,"sans-serif""><span style="font-size:13.0pt">Over the same period, the proportion of non-food spending has escalated from an average of 38 percent to 47 percent. Moreover, the distribution of food expenditures has undergone a transformation since the previous NLSS, shifting away from cereals, which provide relatively inexpensive calories, towards more nutritious diets characterized by a greater allocation of spending on fruits, nuts, and meats, albeit these being more costly calorie sources.</span></span></span></p>
<p><span style="font-size:11pt"><span style="font-family:Calibri,"sans-serif""><span style="font-size:13.0pt">When it comes to nominal household consumption expenditure, Kathmandu Valley leads with an annual average of Rs 263,318. Following closely, urban areas of Gandaki Province records the second highest expenditure at Rs 176,542 per year, representing 67 percent of that in Kathmandu Valley. </span></span></span></p>
<p><span style="font-size:11pt"><span style="font-family:Calibri,"sans-serif""><span style="font-size:13.0pt">Conversely, the lowest average annual nominal per capita expenditures are observed in rural areas of Madhesh and Sudurpaschim provinces at Rs 71,828 and Rs 72,861 per person per year, respectively.</span></span></span></p>
<p> </p>
',
'published' => true,
'created' => '2024-02-13',
'modified' => '2024-02-13',
'keywords' => '',
'description' => '',
'sortorder' => '19964',
'image' => '20240213105500_foodbasket.jpg',
'article_date' => '2024-02-13 10:51:07',
'homepage' => false,
'breaking_news' => false,
'main_news' => true,
'in_scroller' => false,
'user_id' => '34'
),
'ArticleCategory' => array(
'id' => '1',
'name' => 'NEWS',
'parentOf' => '0',
'published' => true,
'registered' => '2015-07-20 00:00:00',
'sortorder' => '158',
'del_flag' => '0',
'homepage' => true,
'display_in_menu' => true,
'user_id' => '1',
'created' => '0000-00-00 00:00:00',
'modified' => '2018-11-22 11:58:49'
),
'User' => array(
'password' => '*****',
'id' => '34',
'user_detail_id' => '1',
'group_id' => '1',
'username' => 'neeraj.roy@newbusinessage.com',
'name' => null,
'email' => 'neeraj.roy@newbusinessage.com',
'address' => null,
'gender' => null,
'access' => '1',
'phone' => null,
'access_type' => null,
'activated' => true,
'sortorder' => null,
'published' => null,
'created' => '2020-07-19 16:40:23',
'last_login' => '2024-08-13 13:55:06',
'ip' => '172.69.41.137'
),
'ArticleComment' => array(),
'ArticleFeature' => array(),
'ArticleHasAuthor' => array(),
'ArticleHasTag' => array(),
'ArticleView' => array(
(int) 0 => array(
[maximum depth reached]
)
),
'Slider' => array()
),
'current_user' => null,
'logged_in' => false
)
$article = array(
'Article' => array(
'id' => '20237',
'article_category_id' => '1',
'title' => 'Annual Nominal Household Consumption Expenditure up by 66.23 Percent',
'sub_title' => '',
'summary' => 'February 13: The Nepal Living Standards Survey has shown that yearly spatially and temporally adjusted per capita consumption expenditures have surged by 66 percent, rising from Rs 75,902 to Rs 126,172 in real terms between 2011 and 2023.',
'content' => '<p><span style="font-size:11pt"><span style="font-family:Calibri,"sans-serif""><span style="font-size:13.0pt">February 13: The Nepal Living Standards Survey has shown that yearly spatially and temporally adjusted per capita consumption expenditures have surged by 66 percent, rising from Rs 75,902 to Rs 126,172 in real terms between 2011 and 2023. </span></span></span></p>
<p><span style="font-size:11pt"><span style="font-family:Calibri,"sans-serif""><span style="font-size:13.0pt">Over the same period, the proportion of non-food spending has escalated from an average of 38 percent to 47 percent. Moreover, the distribution of food expenditures has undergone a transformation since the previous NLSS, shifting away from cereals, which provide relatively inexpensive calories, towards more nutritious diets characterized by a greater allocation of spending on fruits, nuts, and meats, albeit these being more costly calorie sources.</span></span></span></p>
<p><span style="font-size:11pt"><span style="font-family:Calibri,"sans-serif""><span style="font-size:13.0pt">When it comes to nominal household consumption expenditure, Kathmandu Valley leads with an annual average of Rs 263,318. Following closely, urban areas of Gandaki Province records the second highest expenditure at Rs 176,542 per year, representing 67 percent of that in Kathmandu Valley. </span></span></span></p>
<p><span style="font-size:11pt"><span style="font-family:Calibri,"sans-serif""><span style="font-size:13.0pt">Conversely, the lowest average annual nominal per capita expenditures are observed in rural areas of Madhesh and Sudurpaschim provinces at Rs 71,828 and Rs 72,861 per person per year, respectively.</span></span></span></p>
<p> </p>
',
'published' => true,
'created' => '2024-02-13',
'modified' => '2024-02-13',
'keywords' => '',
'description' => '',
'sortorder' => '19964',
'image' => '20240213105500_foodbasket.jpg',
'article_date' => '2024-02-13 10:51:07',
'homepage' => false,
'breaking_news' => false,
'main_news' => true,
'in_scroller' => false,
'user_id' => '34'
),
'ArticleCategory' => array(
'id' => '1',
'name' => 'NEWS',
'parentOf' => '0',
'published' => true,
'registered' => '2015-07-20 00:00:00',
'sortorder' => '158',
'del_flag' => '0',
'homepage' => true,
'display_in_menu' => true,
'user_id' => '1',
'created' => '0000-00-00 00:00:00',
'modified' => '2018-11-22 11:58:49'
),
'User' => array(
'password' => '*****',
'id' => '34',
'user_detail_id' => '1',
'group_id' => '1',
'username' => 'neeraj.roy@newbusinessage.com',
'name' => null,
'email' => 'neeraj.roy@newbusinessage.com',
'address' => null,
'gender' => null,
'access' => '1',
'phone' => null,
'access_type' => null,
'activated' => true,
'sortorder' => null,
'published' => null,
'created' => '2020-07-19 16:40:23',
'last_login' => '2024-08-13 13:55:06',
'ip' => '172.69.41.137'
),
'ArticleComment' => array(),
'ArticleFeature' => array(),
'ArticleHasAuthor' => array(),
'ArticleHasTag' => array(),
'ArticleView' => array(
(int) 0 => array(
'article_id' => '20237',
'hit' => '638'
)
),
'Slider' => array()
)
$current_user = null
$logged_in = false
$xml = false
simplexml_load_file - [internal], line ??
include - APP/View/Elements/side_bar.ctp, line 133
View::_evaluate() - CORE/Cake/View/View.php, line 971
View::_render() - CORE/Cake/View/View.php, line 933
View::_renderElement() - CORE/Cake/View/View.php, line 1224
View::element() - CORE/Cake/View/View.php, line 418
include - APP/View/Articles/view.ctp, line 391
View::_evaluate() - CORE/Cake/View/View.php, line 971
View::_render() - CORE/Cake/View/View.php, line 933
View::render() - CORE/Cake/View/View.php, line 473
Controller::render() - CORE/Cake/Controller/Controller.php, line 968
Dispatcher::_invoke() - CORE/Cake/Routing/Dispatcher.php, line 200
Dispatcher::dispatch() - CORE/Cake/Routing/Dispatcher.php, line 167
[main] - APP/webroot/index.php, line 117